

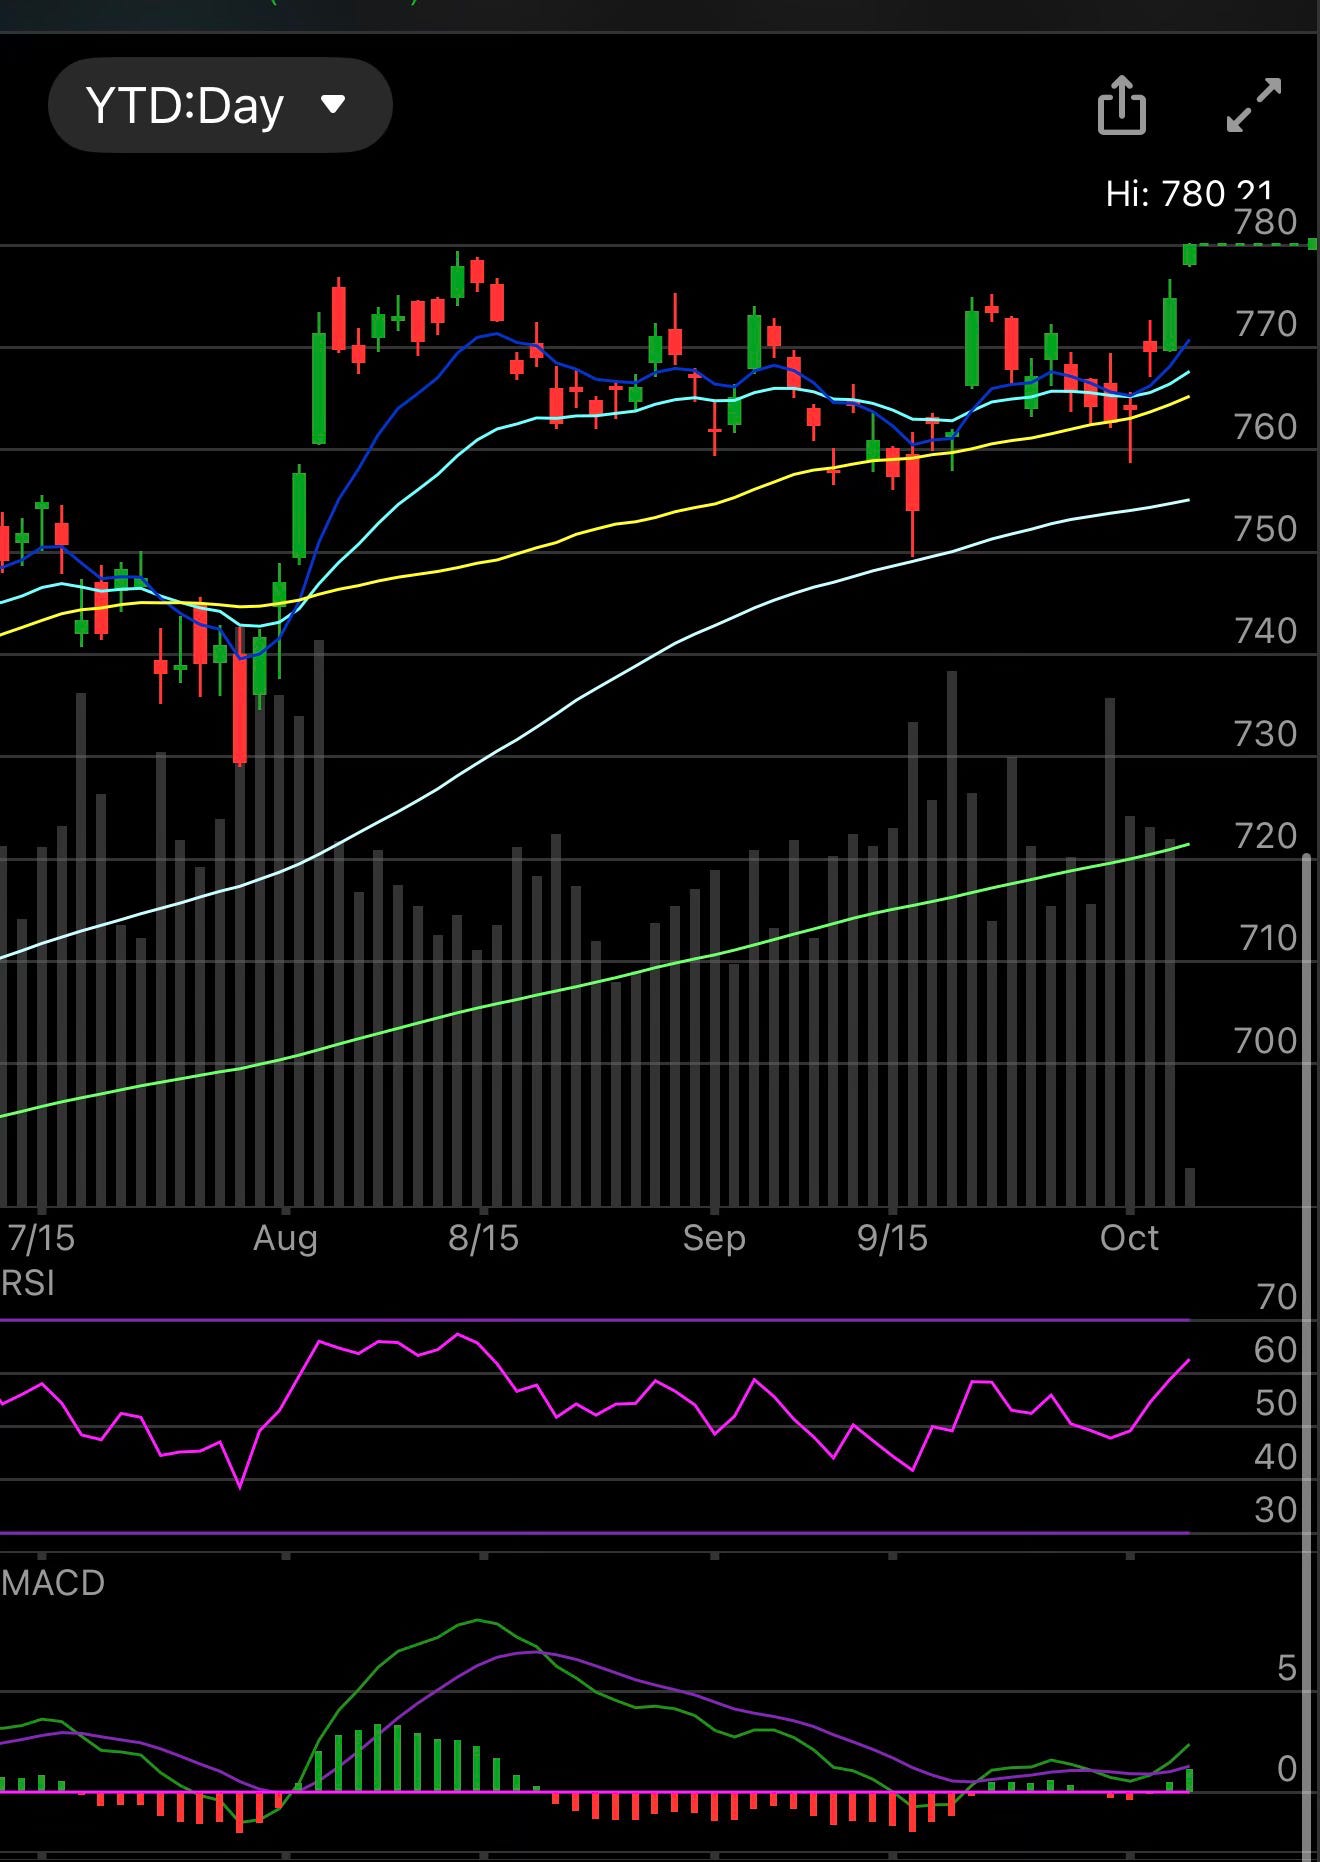
The SPY just broke out to new highs clearing the 780 level for the first time today. We were in a really tight flag for months and while we had a few scary moments along the way, look back at the chart below, we never broke the 100 day, just one test of it. We had just 3 closes below the 50 day, yellow line, and that is where charts never lie to you. Obviously with each moving average that is lost, it is up to you as a trader to decide how much you want to lighten up but charts tell a story and it is your decision what to do with that information. Earnings season now is our next driver to potentially push us to 800, but this was a long time in the making today. NVDA breaking out the last few sessions was a big catalyst here as the markets largest component. There is still alot of time today we need to see where this candle closes on the daily and on friday but so far this is looking like a breakout.
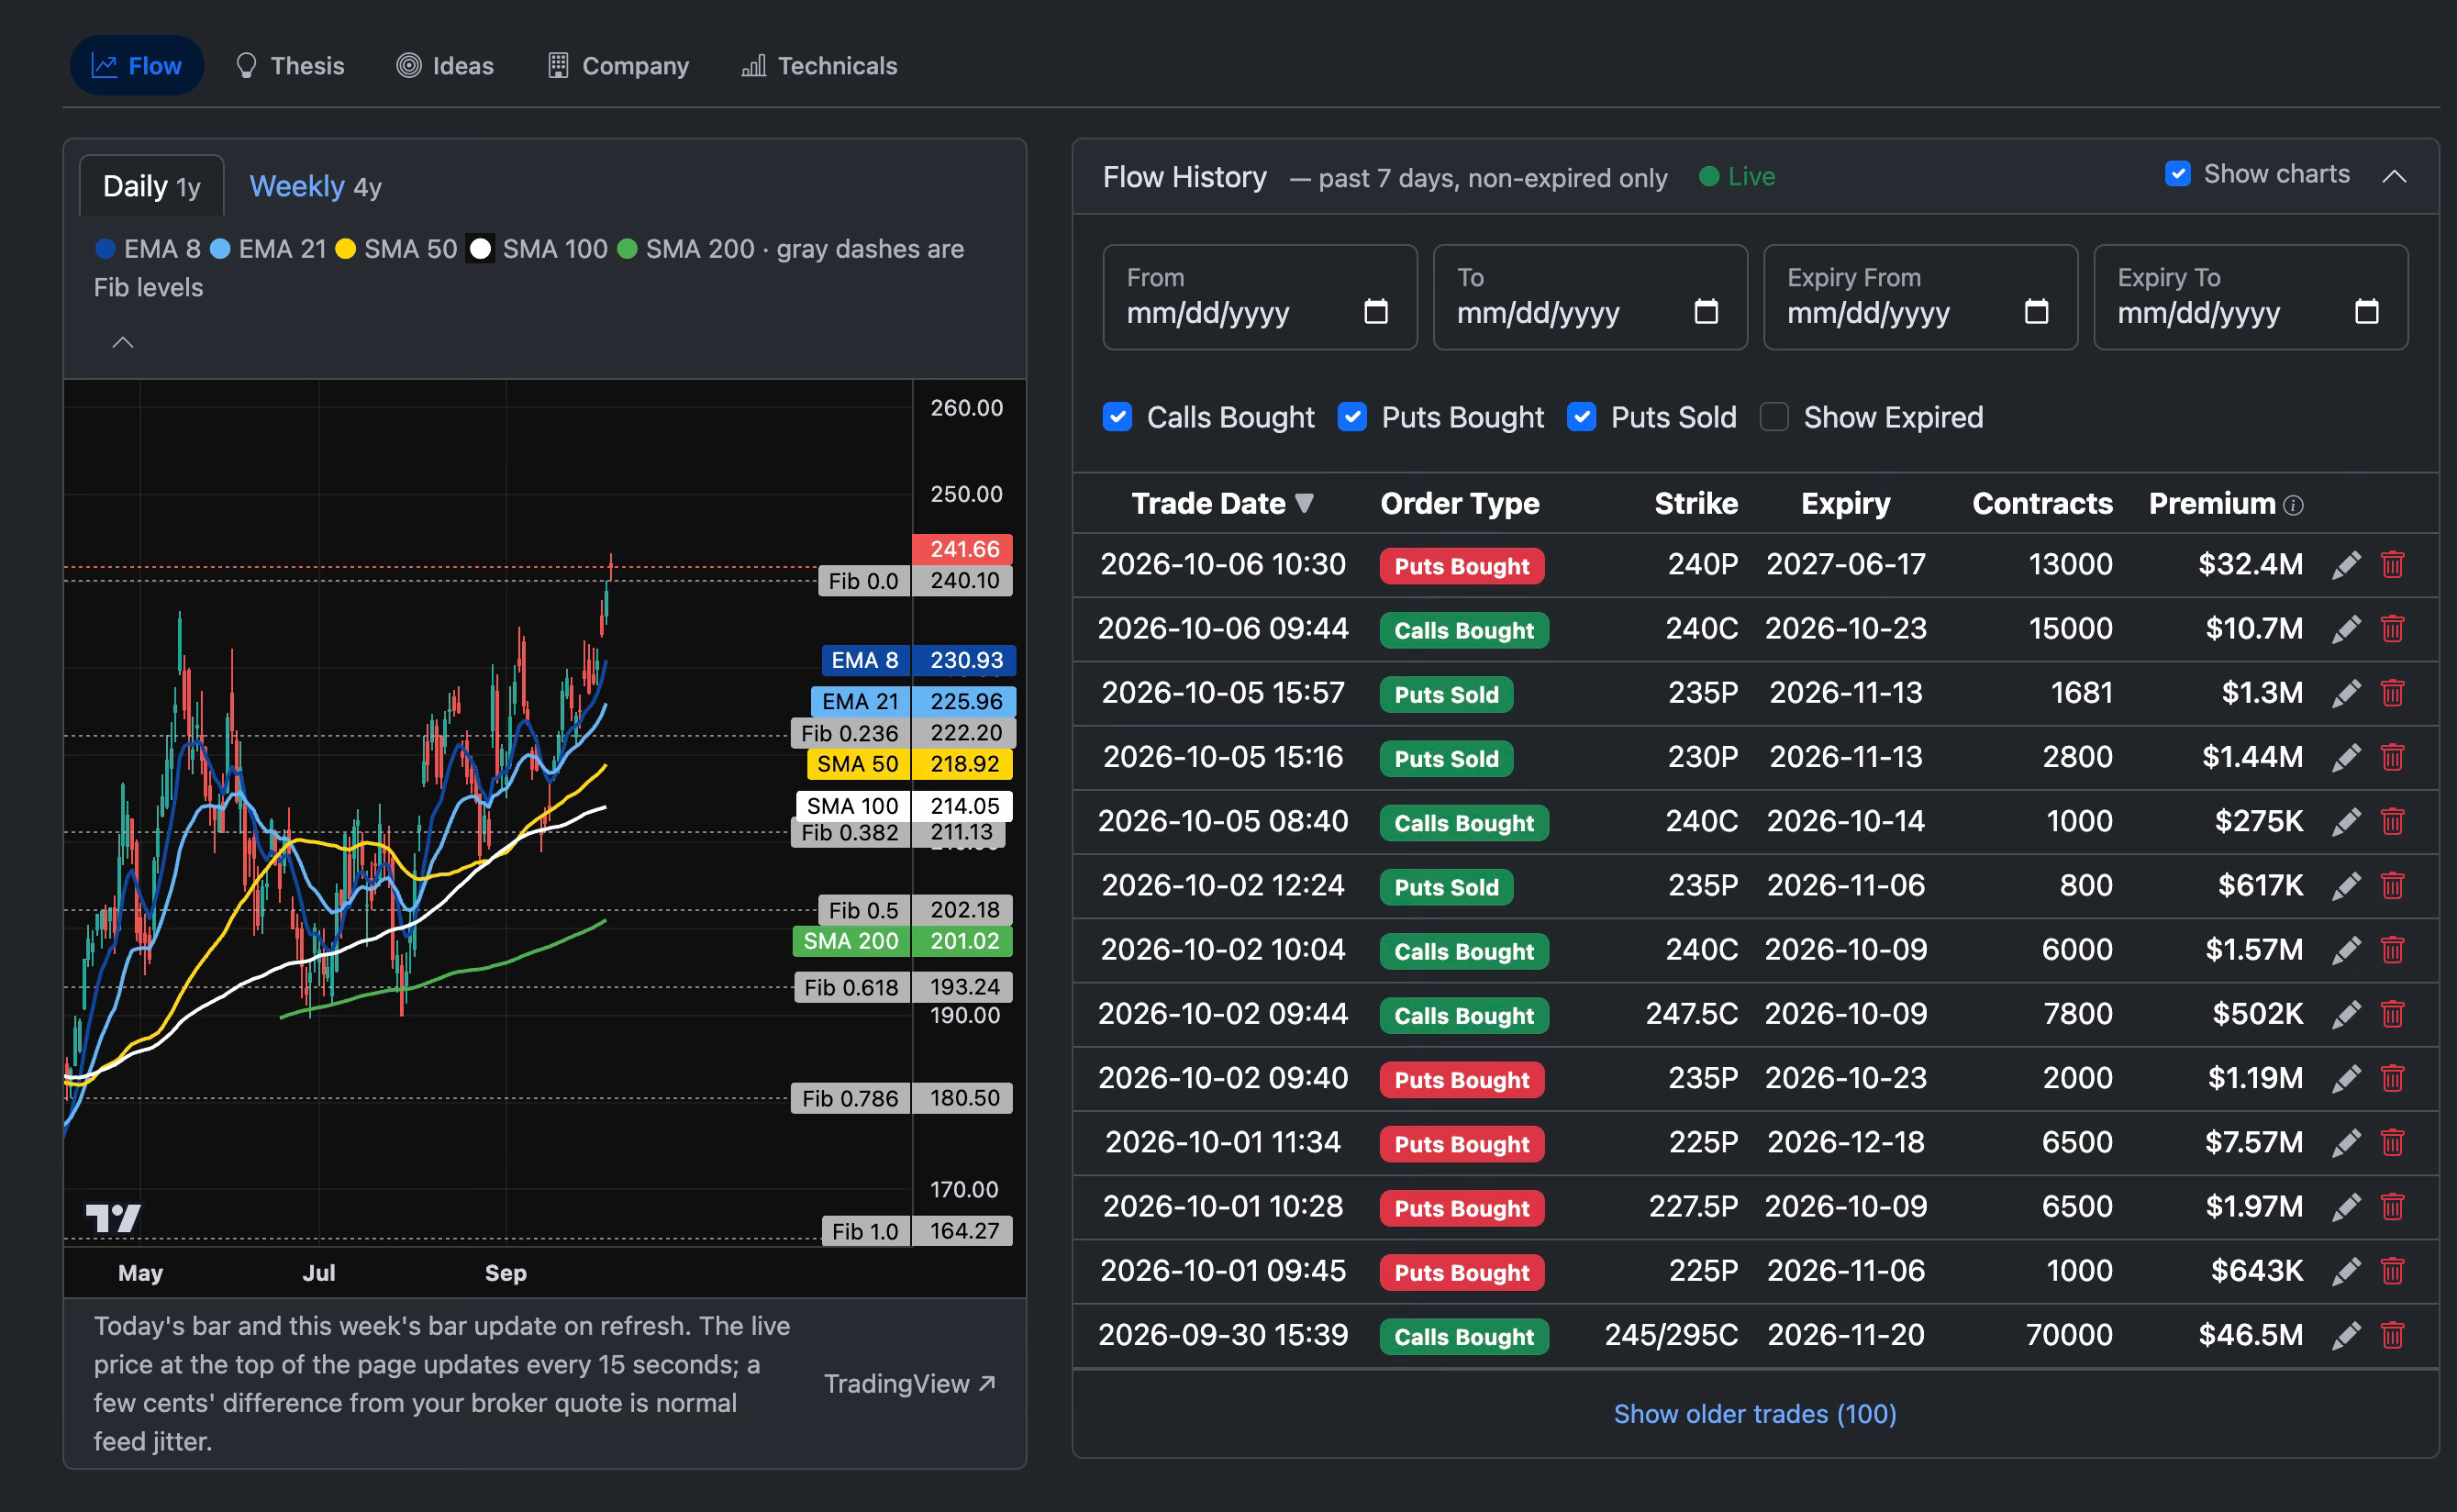
You’ll notice I added back in the charts at the top of each page on the database today, if you don’t like the charts you can just click the show charts button at the top right in the flow history box. This was just to make your life easier so you can see daily/weekly charts alongside the flow but if you don’t like it you don’t have to see it.
Scanner
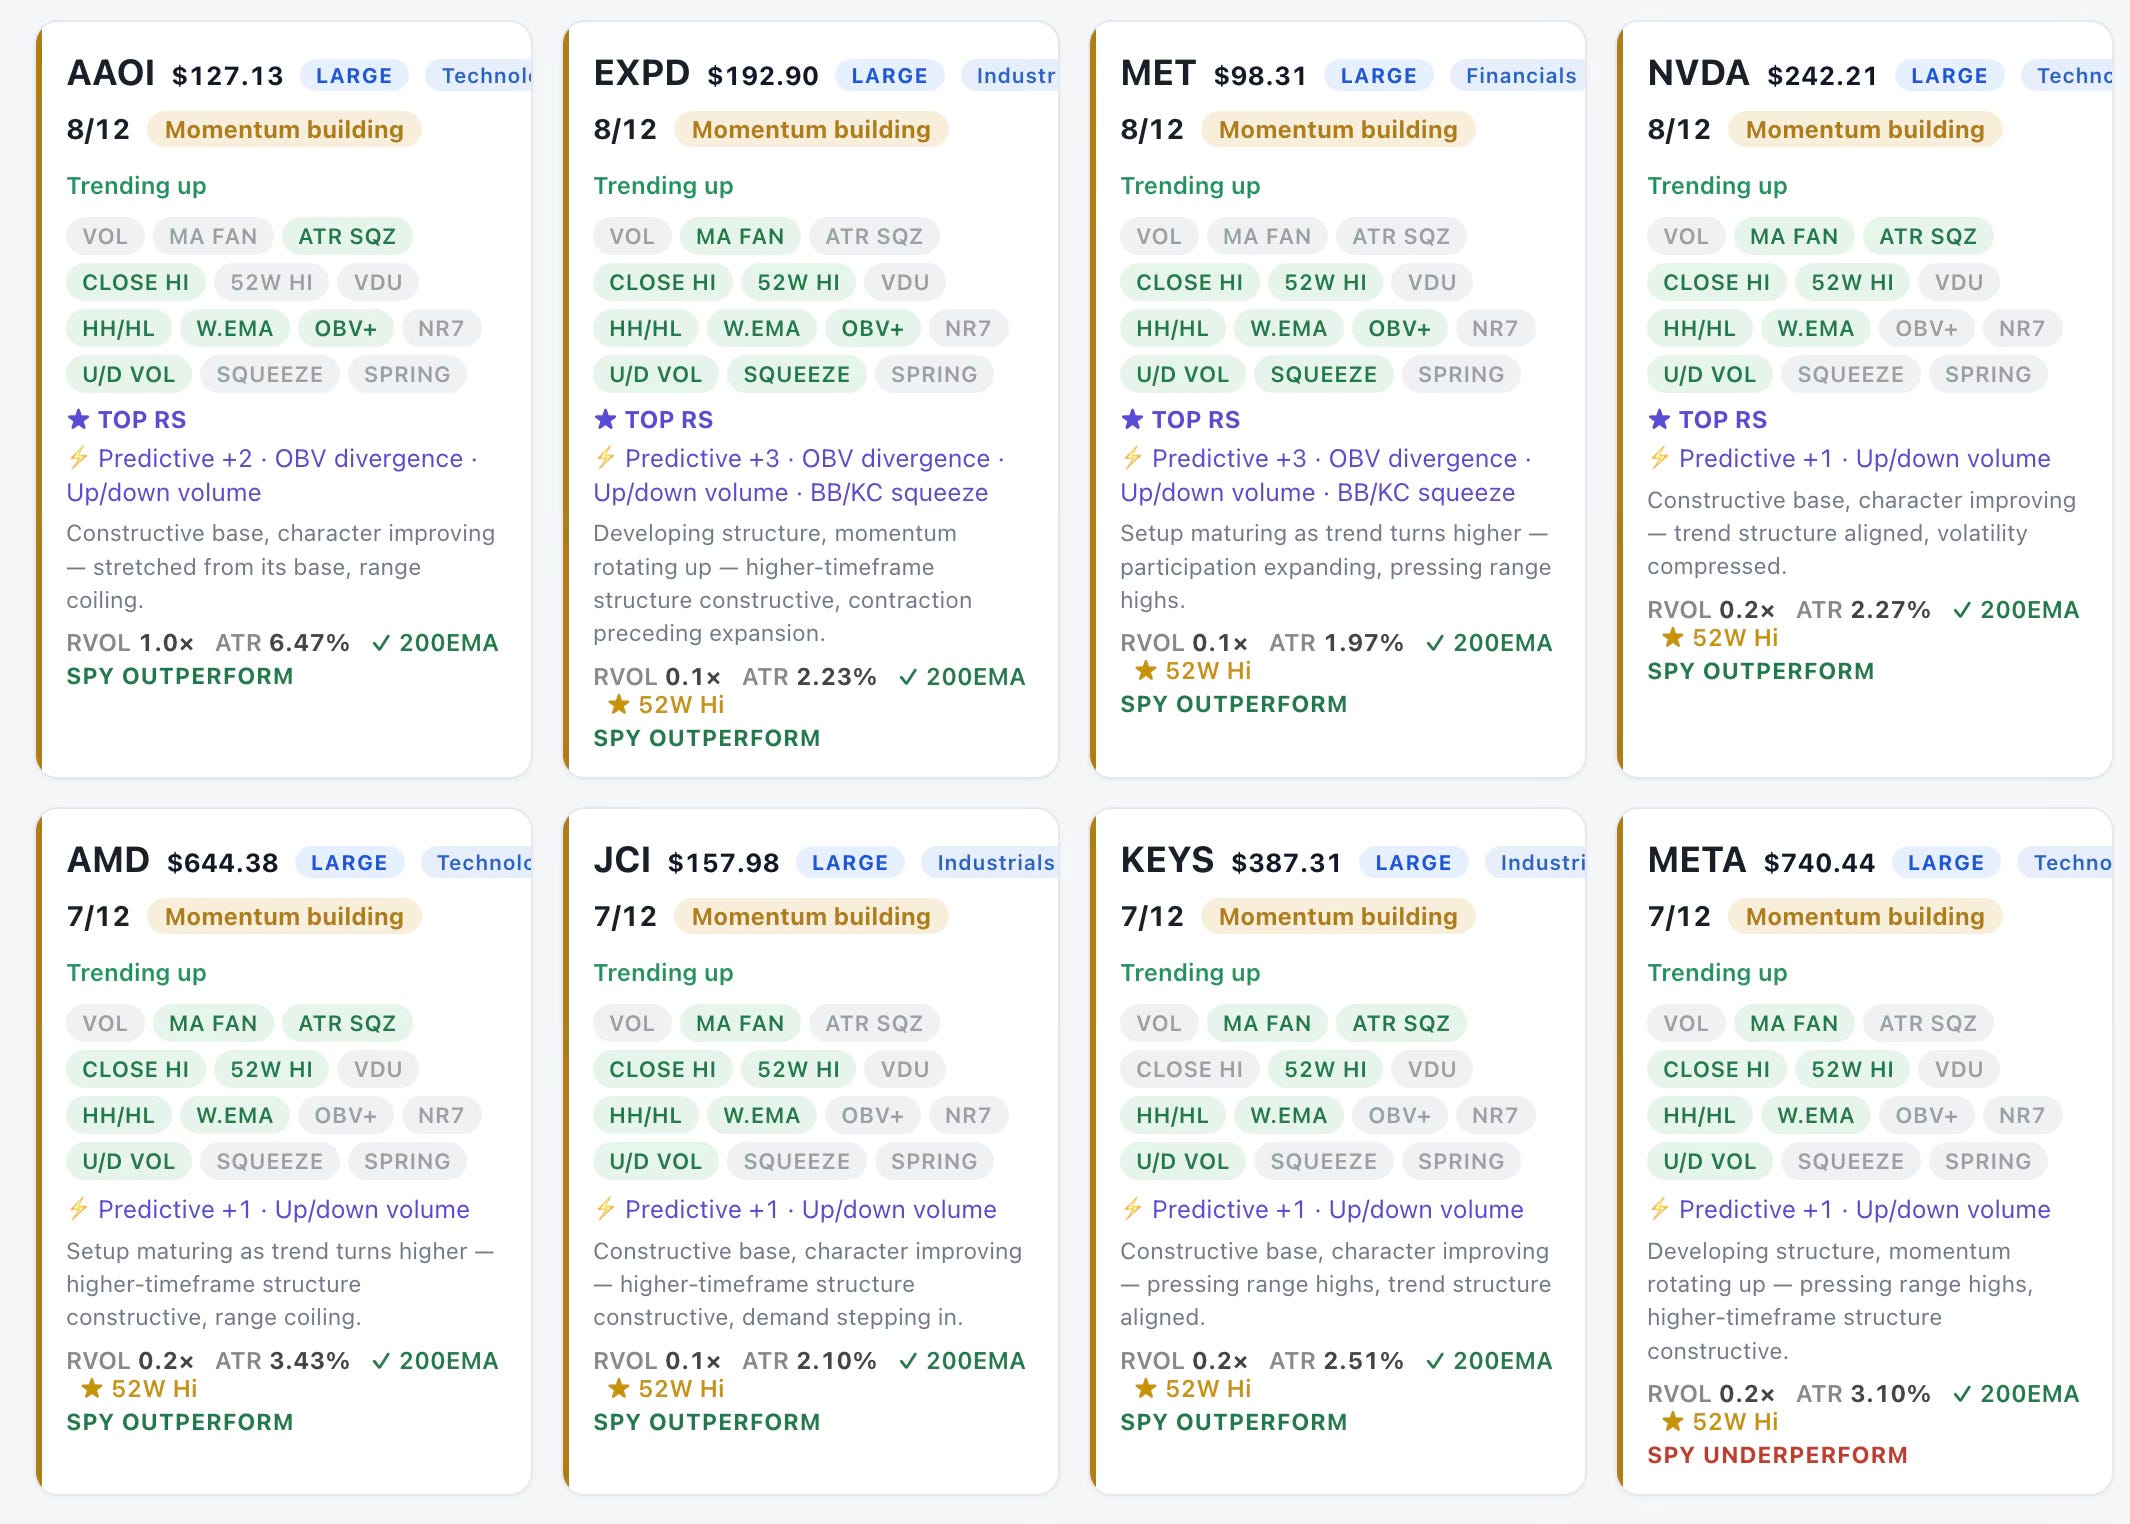
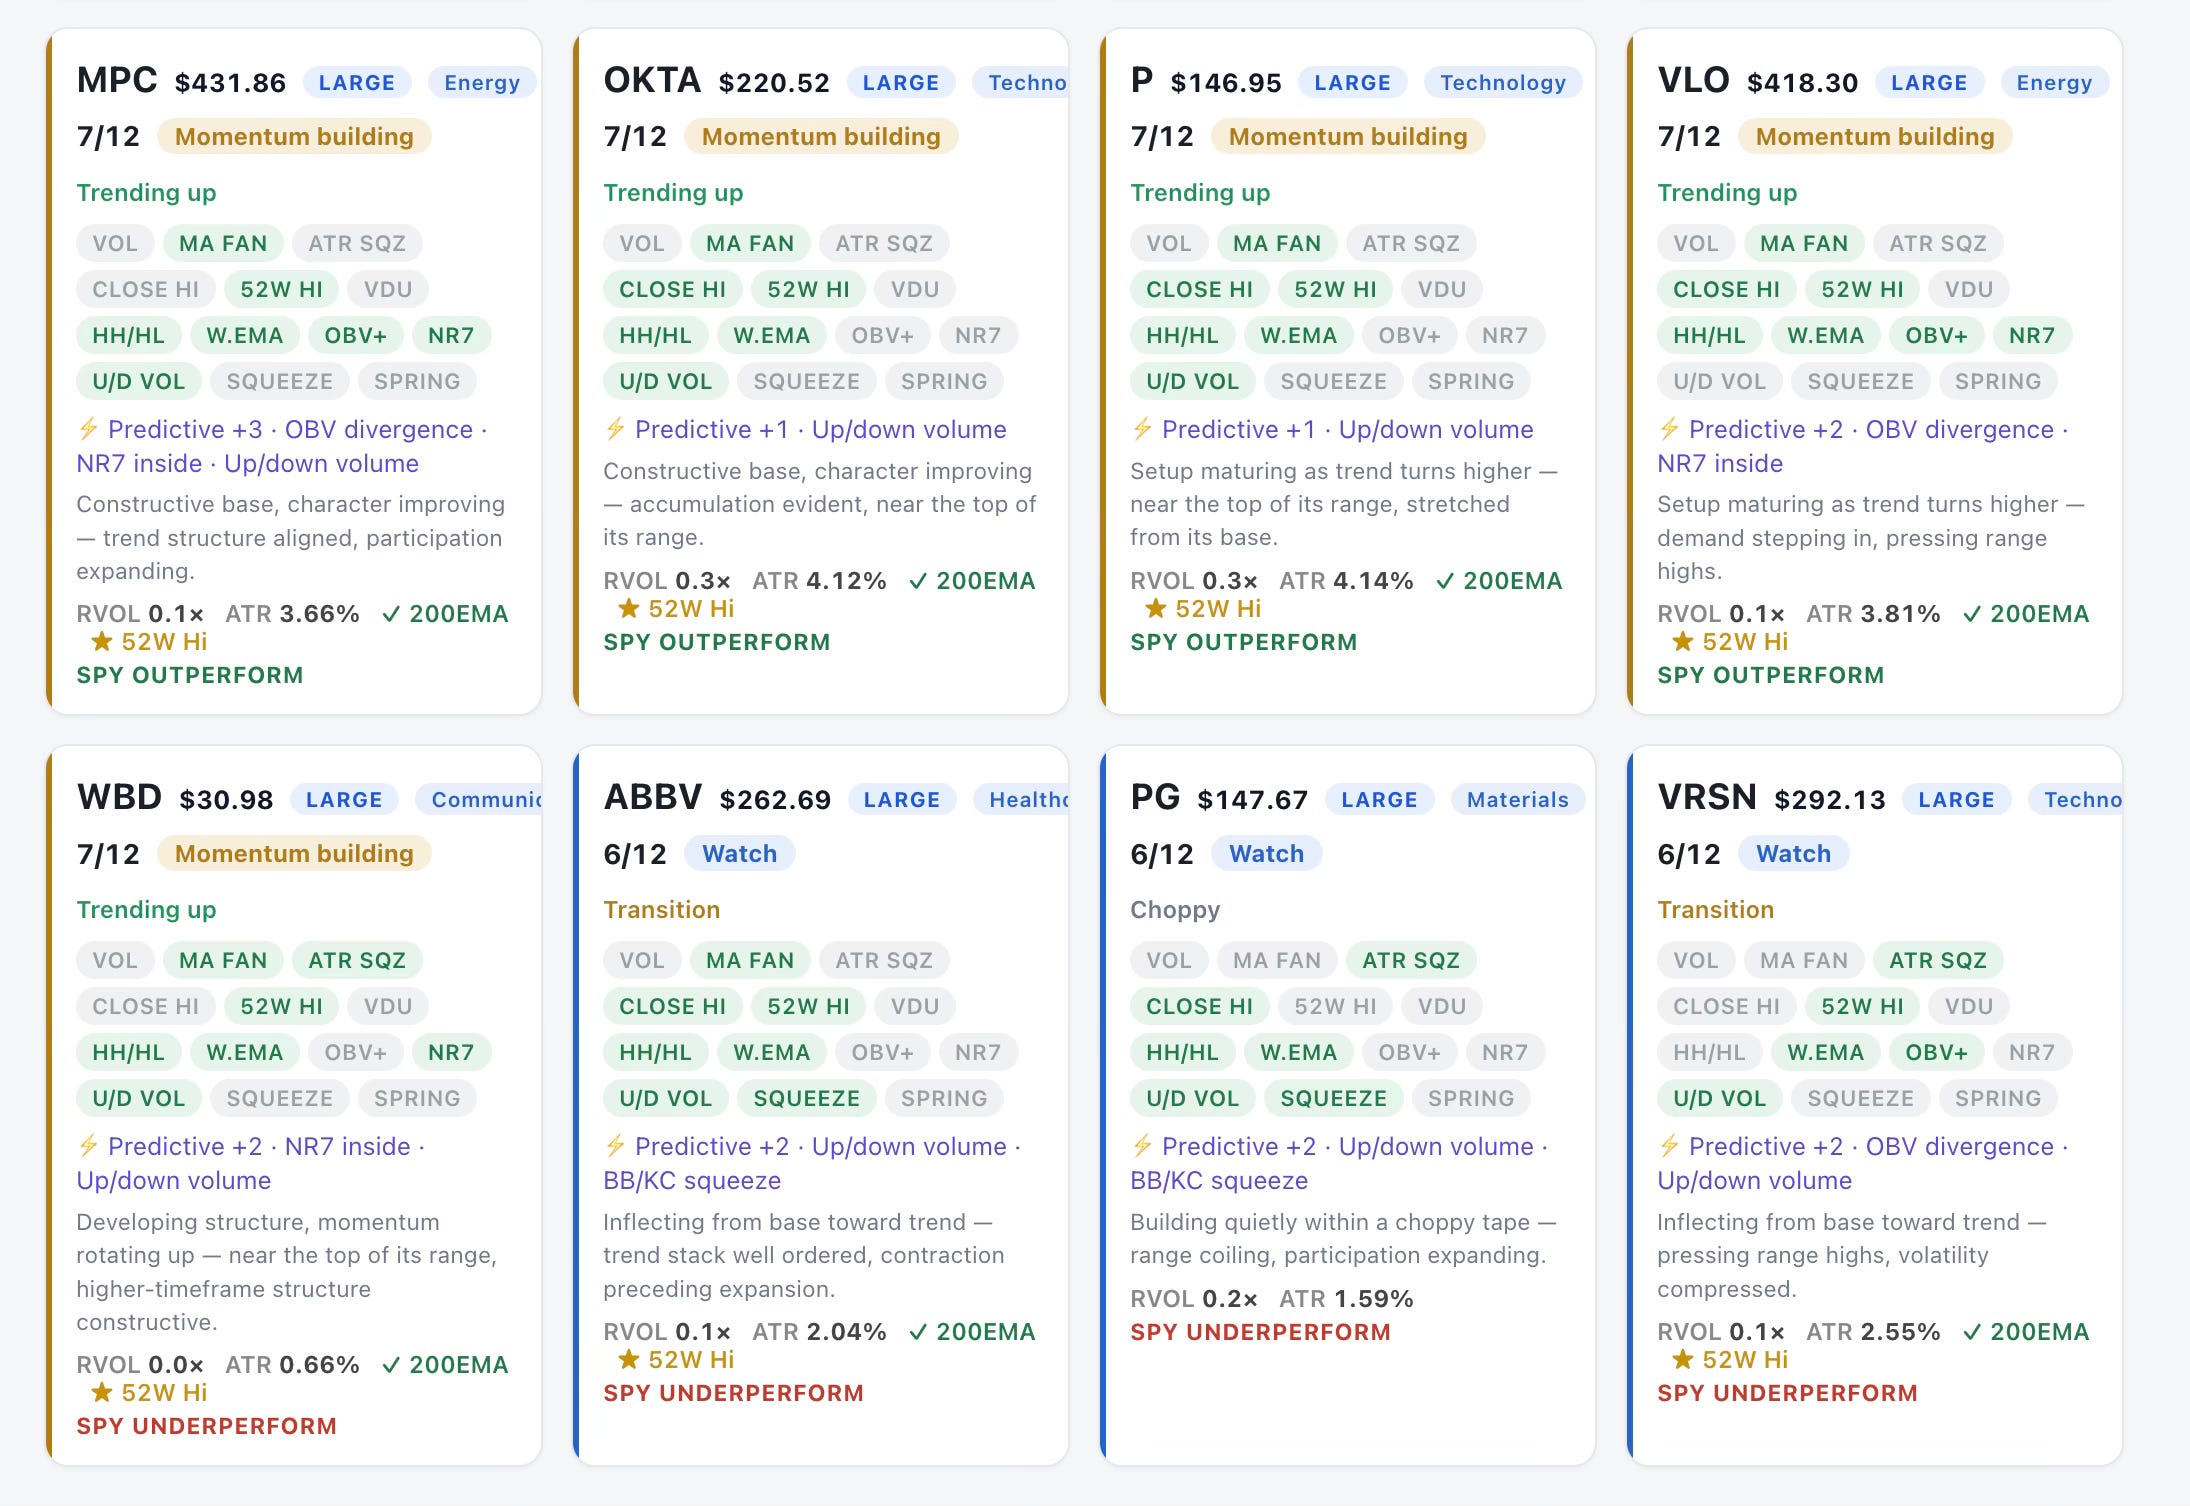
Here are today’s large cap momentum scans. The rest of the small and madcap scans can be found in the database link below.
My Open Book
Trades I Made Today
