

The SPY rallied and closed yesterday right ontop of the 200 day into the NVDA print. This morning it is losing it again after NVDA fully reversed the move up to 162 and turned red. NVDA did everything right, they raised guidance, they told investors business was fine without Jensen but the market is still pressing it lower because unfortunately losing Jensen just means a lower multiple. I don’t think NVDA is in trouble as a business, but as an equity, investors for the moment are not going to pay a premium for it as it now trades below 10x next year’s estimates. Today we have FOMC and we’re going to learn more about the direction of rates. Is this going to be a replay of 2018 where FOMC late in the year sent us into a downwards spiral into year end? I hope not but right now the technical picture is bleak if we’re getting our first close below the 200 day since April today. Hopefully we get a rally into day end and this isn’t a topic of discussion.
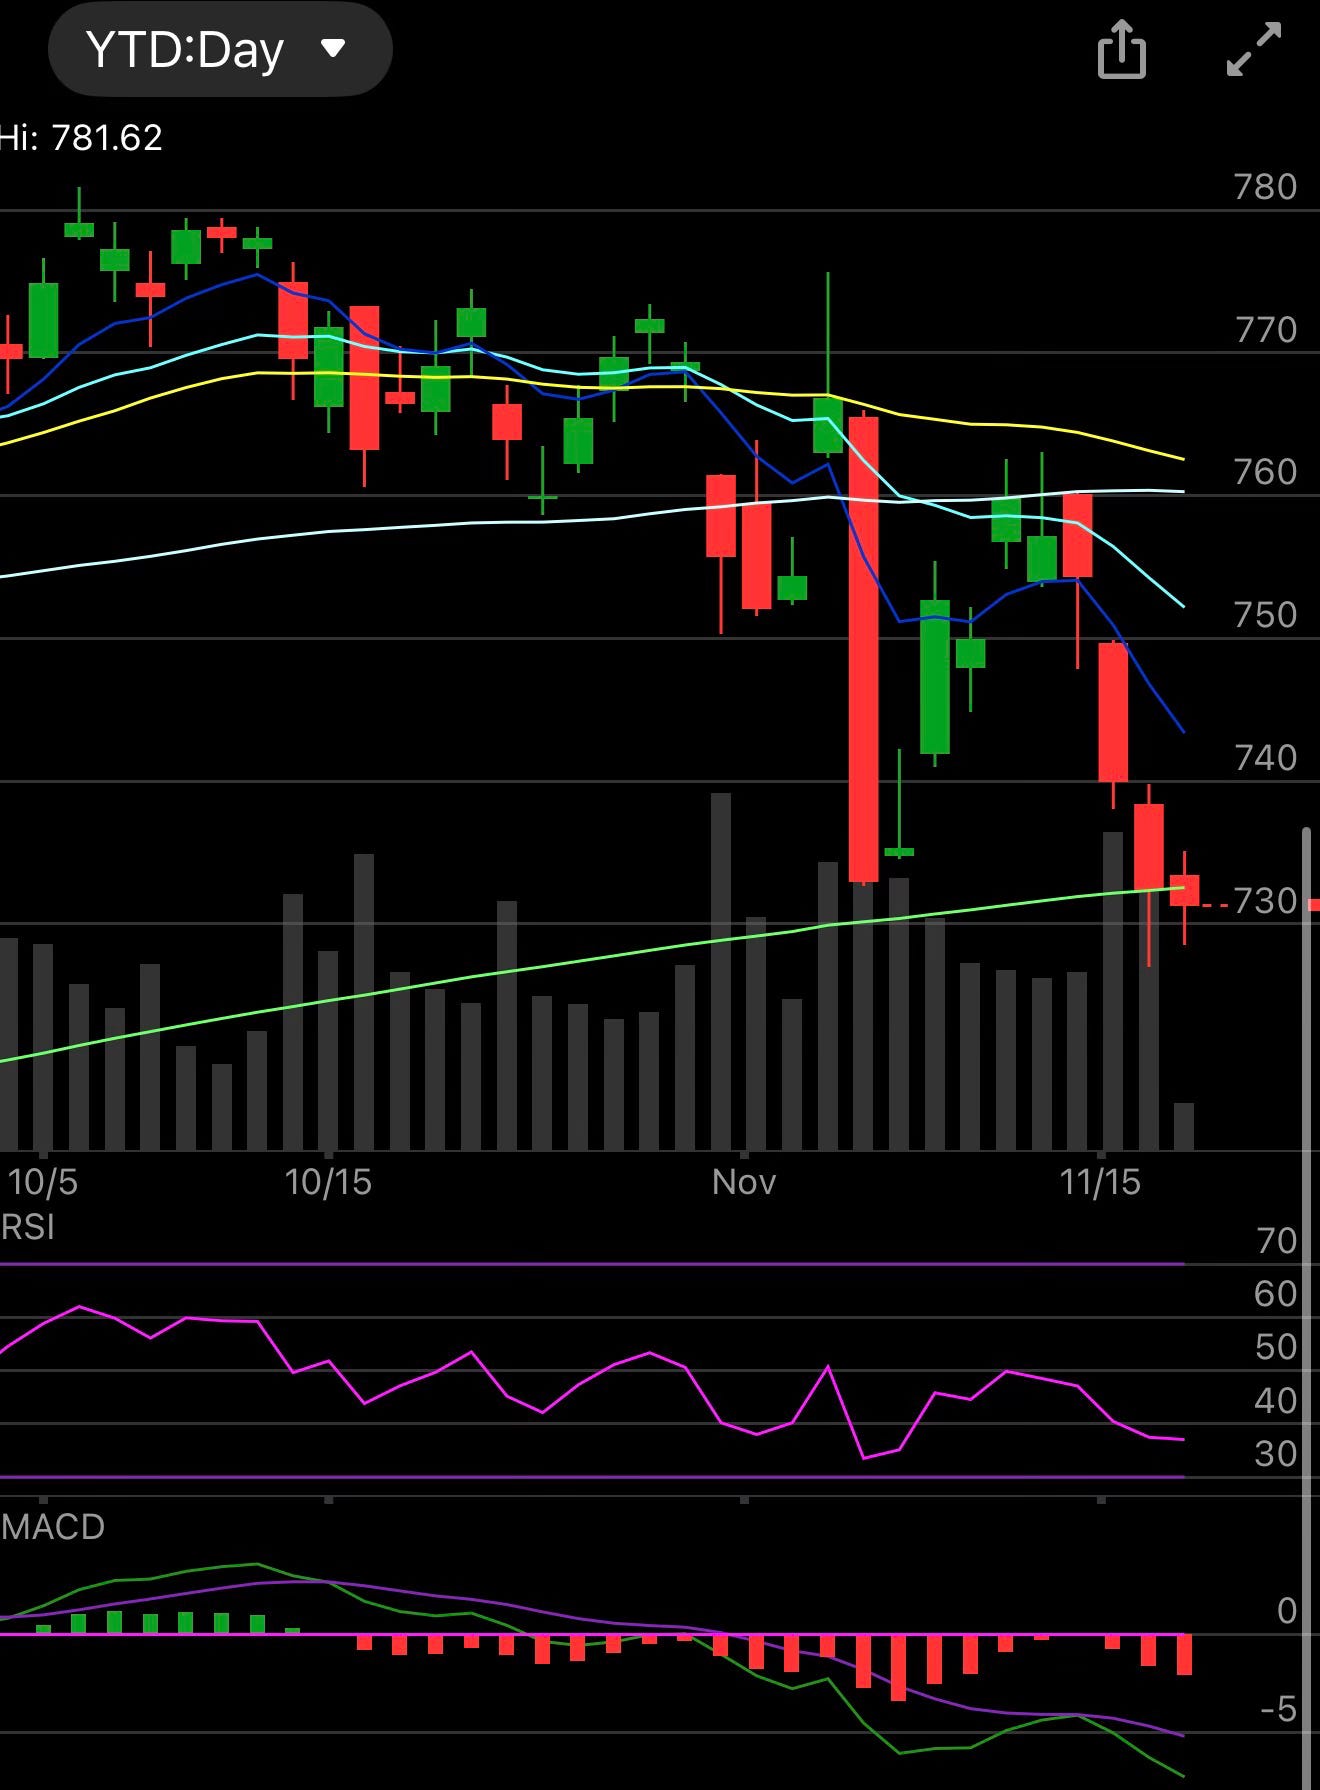
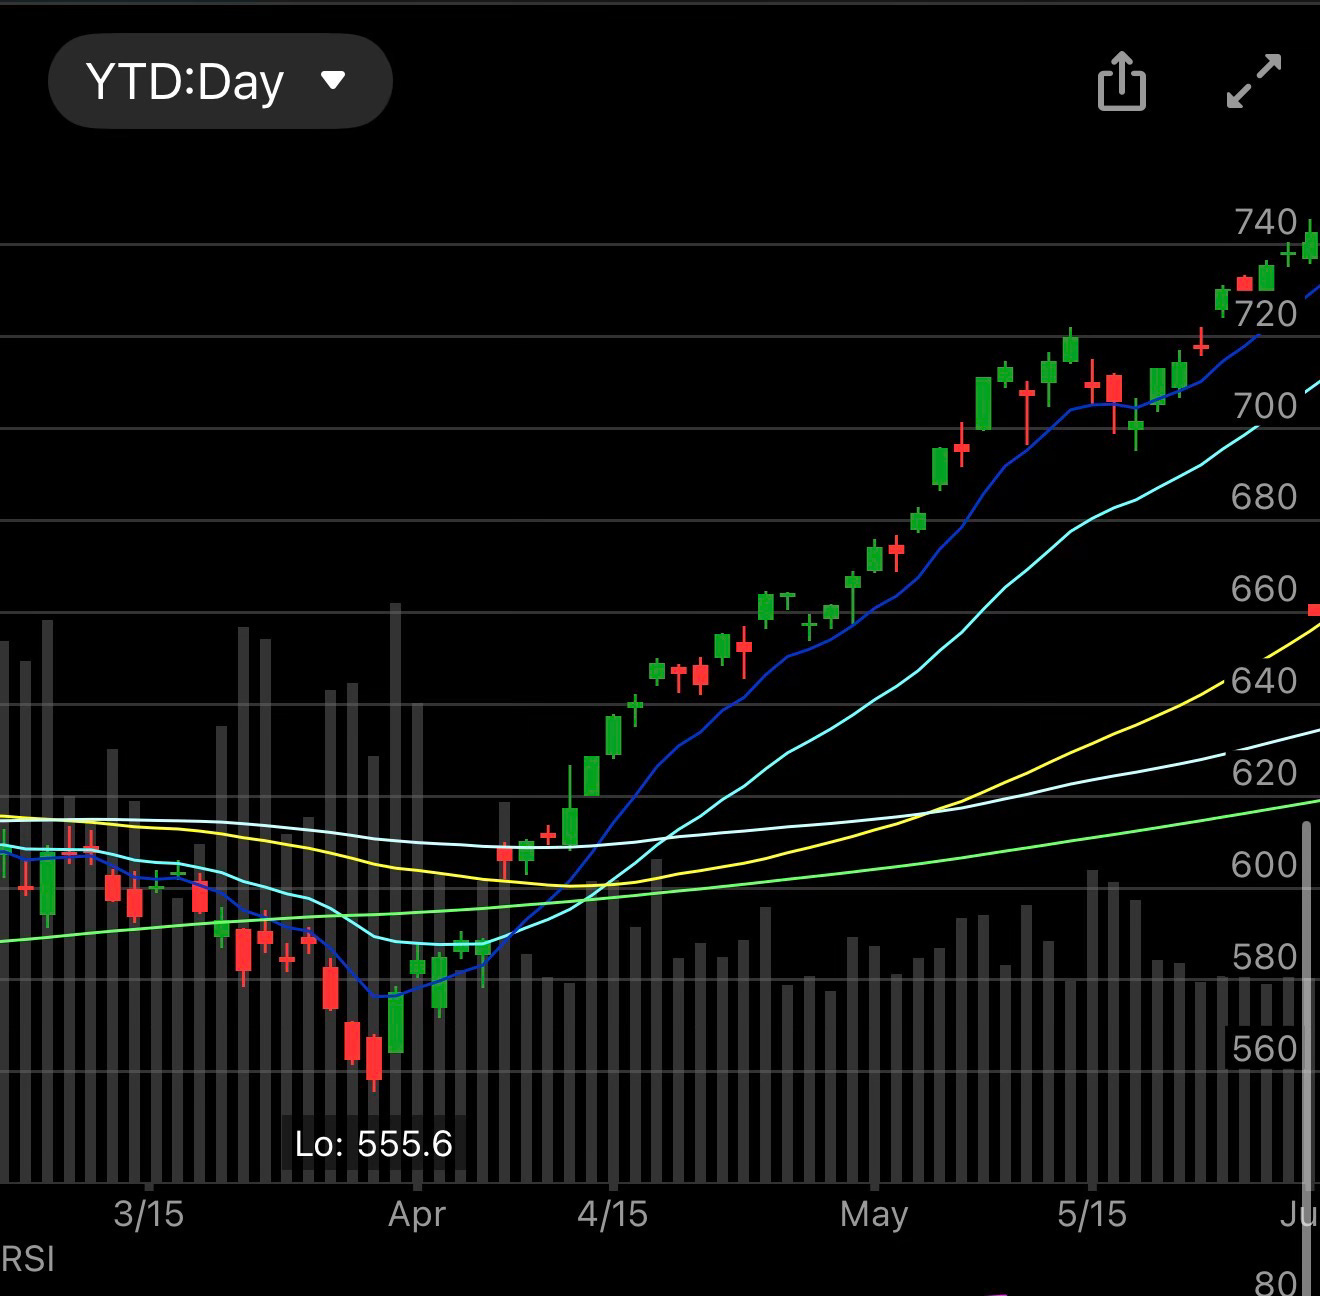
The QQQ chart below is one I want you to look at. I’ve been pretty clearly with you for weeks now that tech is not where you want to be, that wasn’t me being a negative human being, it was just simply what charts were showing. People on twitter are incapable of being unemotional about charts, charts are simply a visualization of buying and selling. When you see a bad chart, that isn’t time to be a super optimistic bull on the matter, it’s just time to be objective that something may be really wrong. What do I think is coming for tech? I hope I’m wrong but I’m looking at this April gap on the QQQ just below 590 and I’m tempted to think that has to fill before all this pain ends. Obviously we’re at 660 on the QQQ today and that is a long way down. I don’t hope it fills but I do think it ultimately will in the next 3-6 months. At that point, you could want to go heavily long tech. For now, you see my positioning I have no tech, I’m short alot of tech puts much lower, but I’m not long any tech. For me, tech is on my do not touch list until it either reclaims some big moving averages overhead or it fills that gap below. Whatever happens first, we will see.
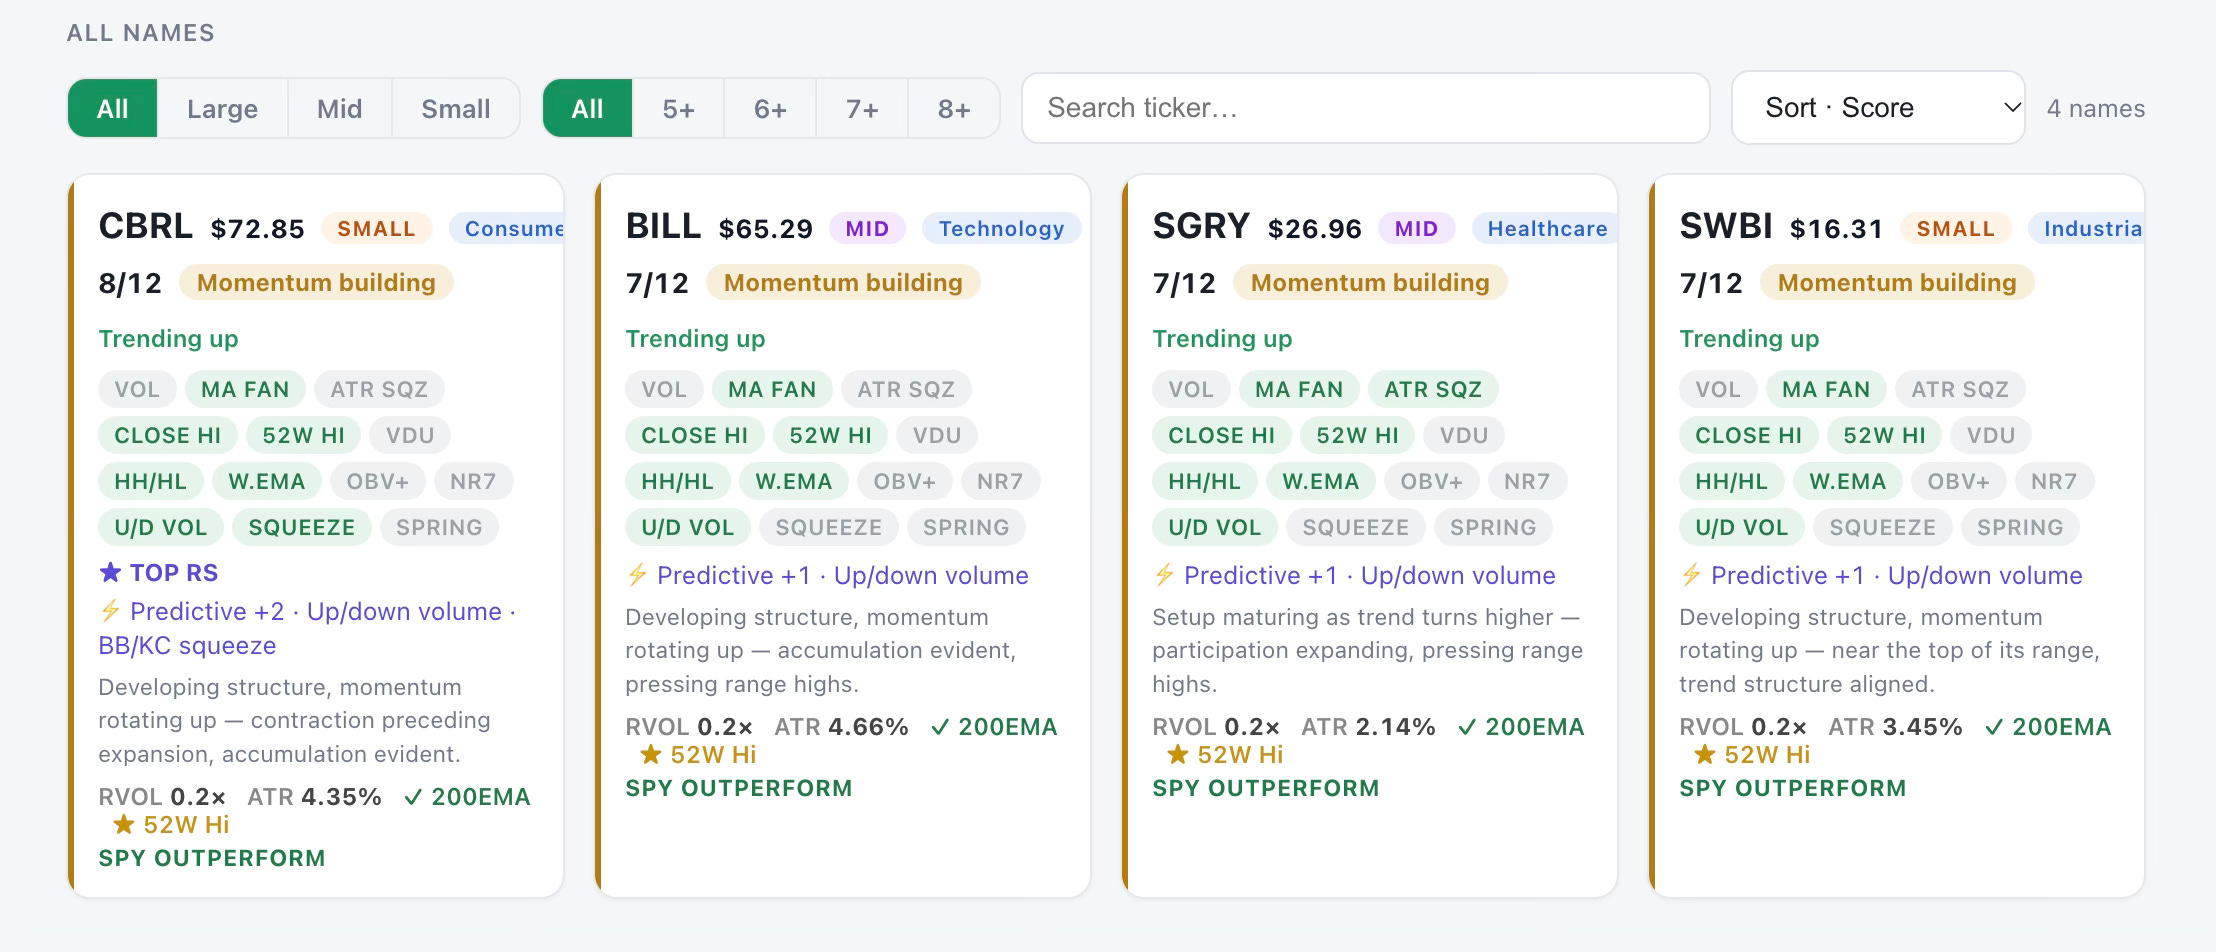
Scanner
There were no large cap names that came up in the momentum scan in the database, only these mid caps below. Pretty telling the day we lose the 200 day nothing shows up in the scans, weird how that works.
My Open Book
Trades I Made Today
