
11/22 Recap

First off all I wanted to say sorry about yesterday. I couldn’t get a recap out because the moment I finished writing and hit submit, substack said it was down and I lost the entire recap, I spent an hour putting everything together as I always do, and it went to waste. Substack was just down for some reason, its done that a couple times on me the last few months, frustrating. So for that I apologize. I wanted to say this would be my last recap for the week, we have alot of family in town the next few days for thanksgiving and I wasn’t going to be around the market at all. The nice part of selling puts like I do is time premium can still work for you even while you’re not around. So I hope you all enjoy a few days off from the market too, we all spend so much time here that a few days away is probably good for everyone. With the great year we’ve had in here, I don’t think 3 days would change much.
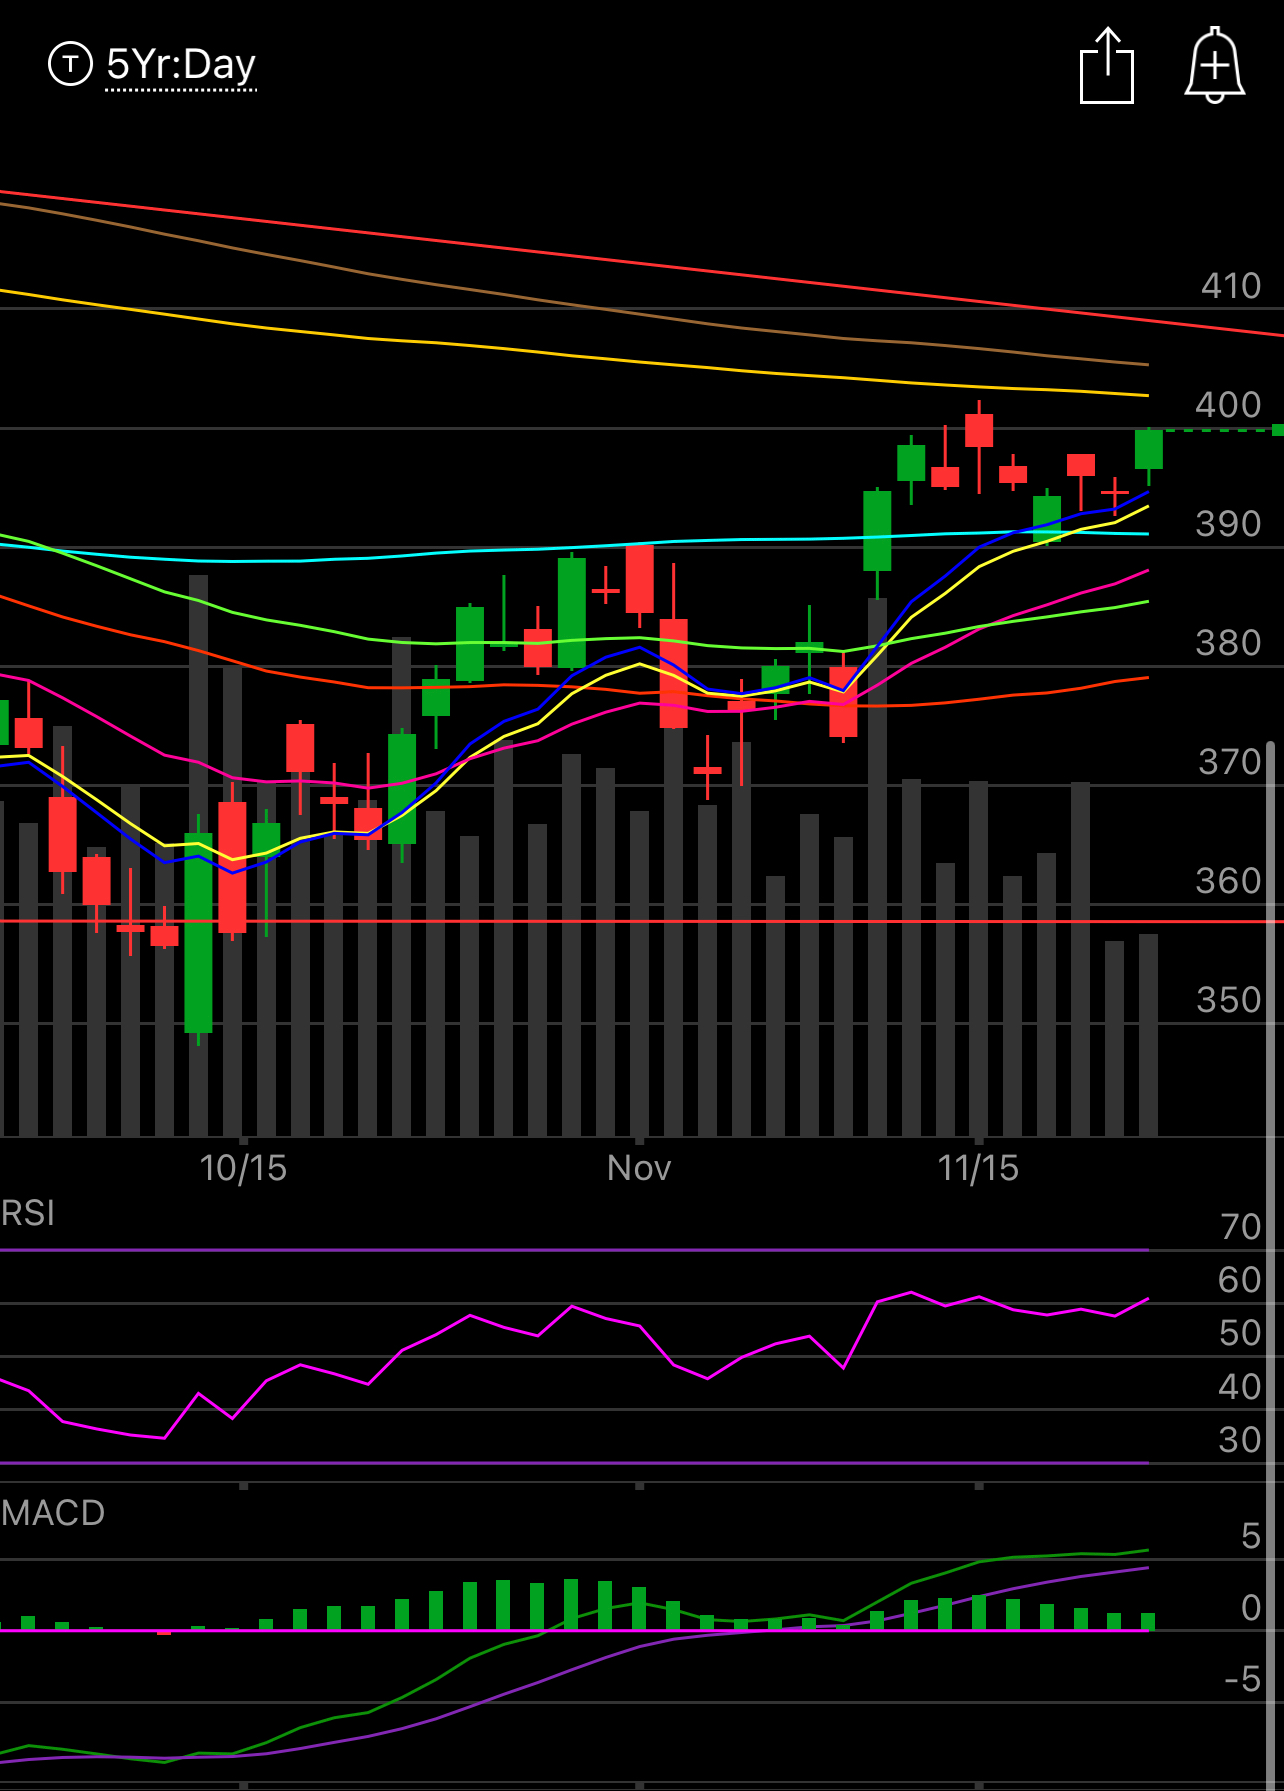
The SPY continues to flag bullishly and hopefully sooner than later we can get that touch of the downtrend line that has been so elusive. I’m a bit tempted to start scaling in to a short position here as the downward slope leaves around 2% upside but I’m meticulous and I’m going to try to hold off for a bit. Either way we are getting close.
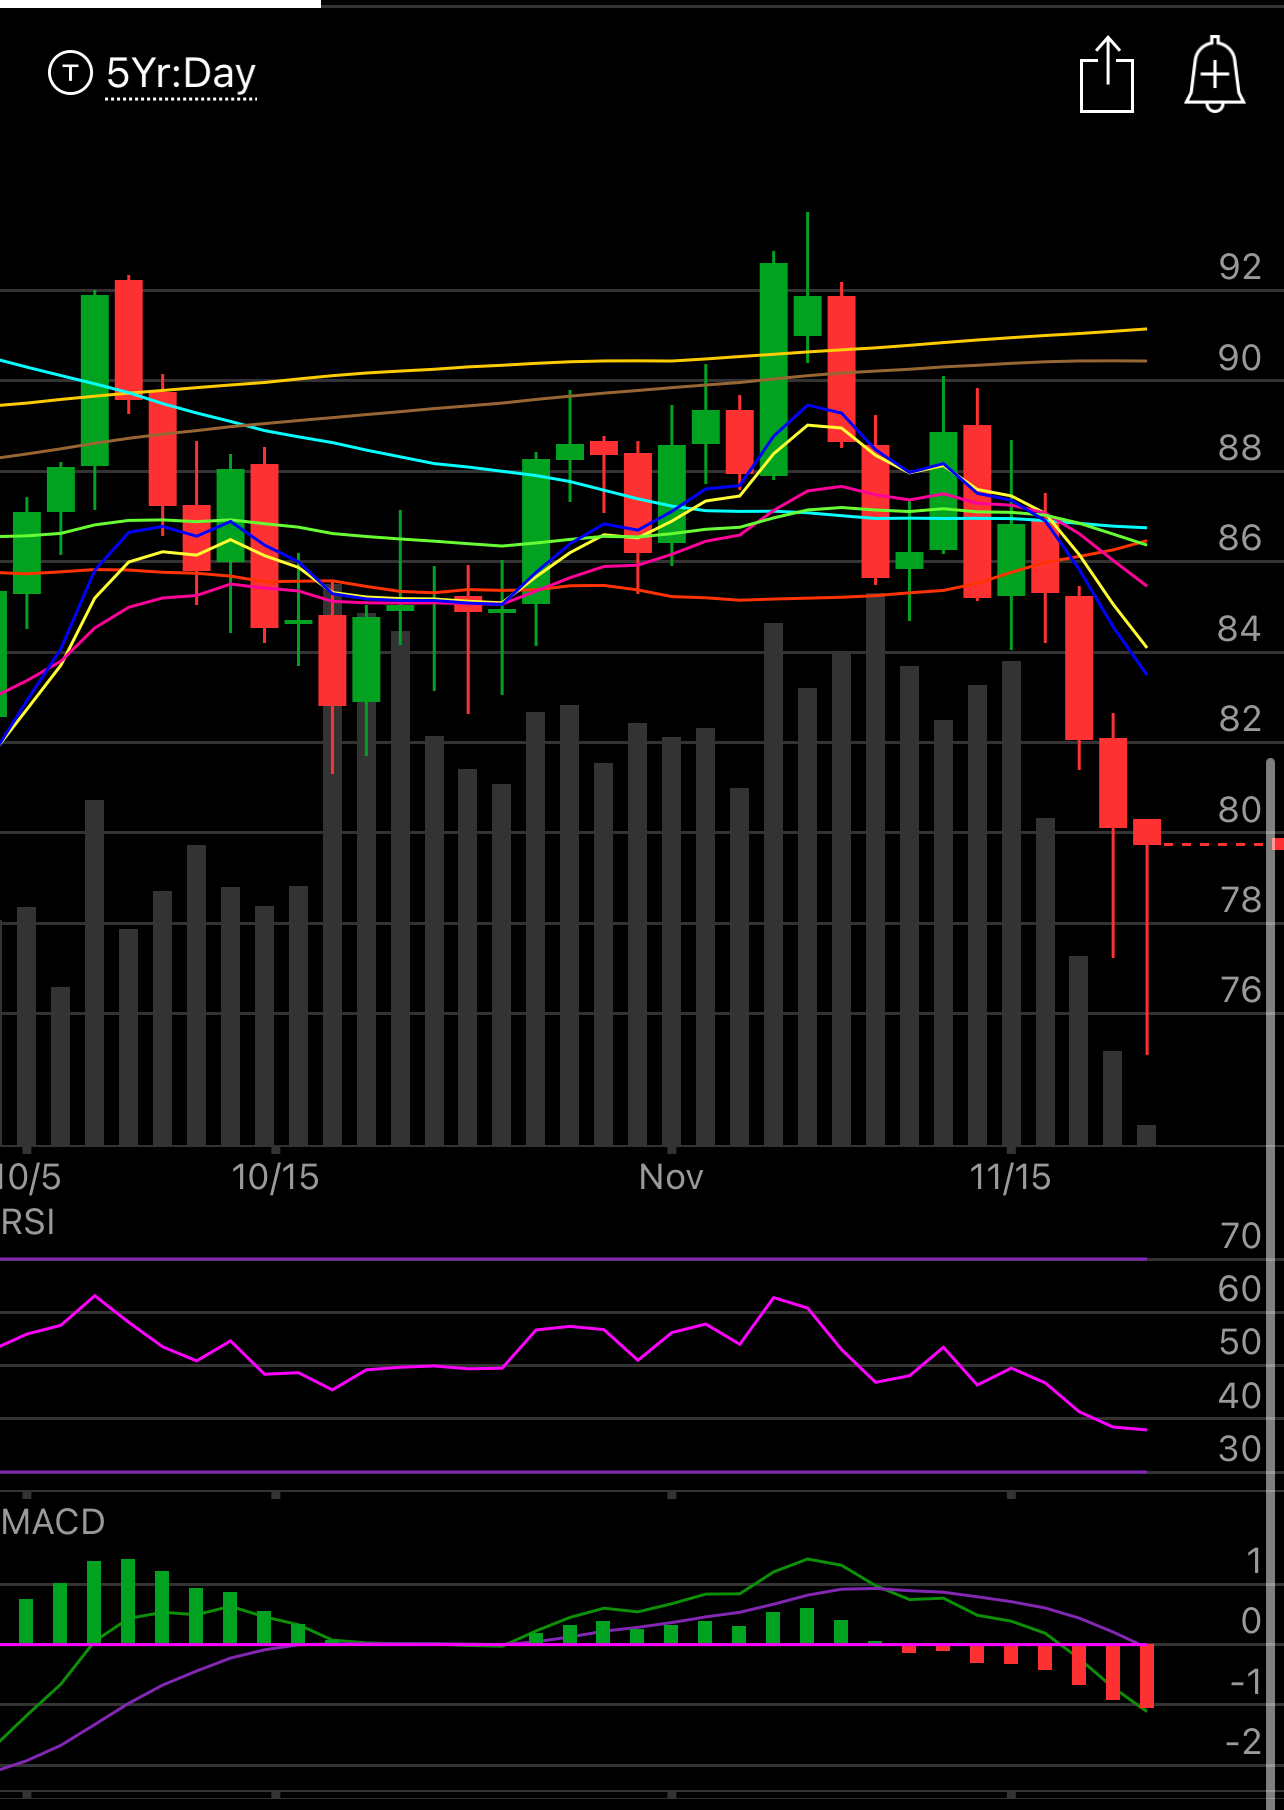
The chart that really stands out is oil below, look at this complete breakdown below $80. The good news is oil names do great even if oil is $75 so I’m not concerned there and you could see the bounce back today in names like OXY that were down 6% yesterday on the rumors Saudis would boost production which turned out to be fake.
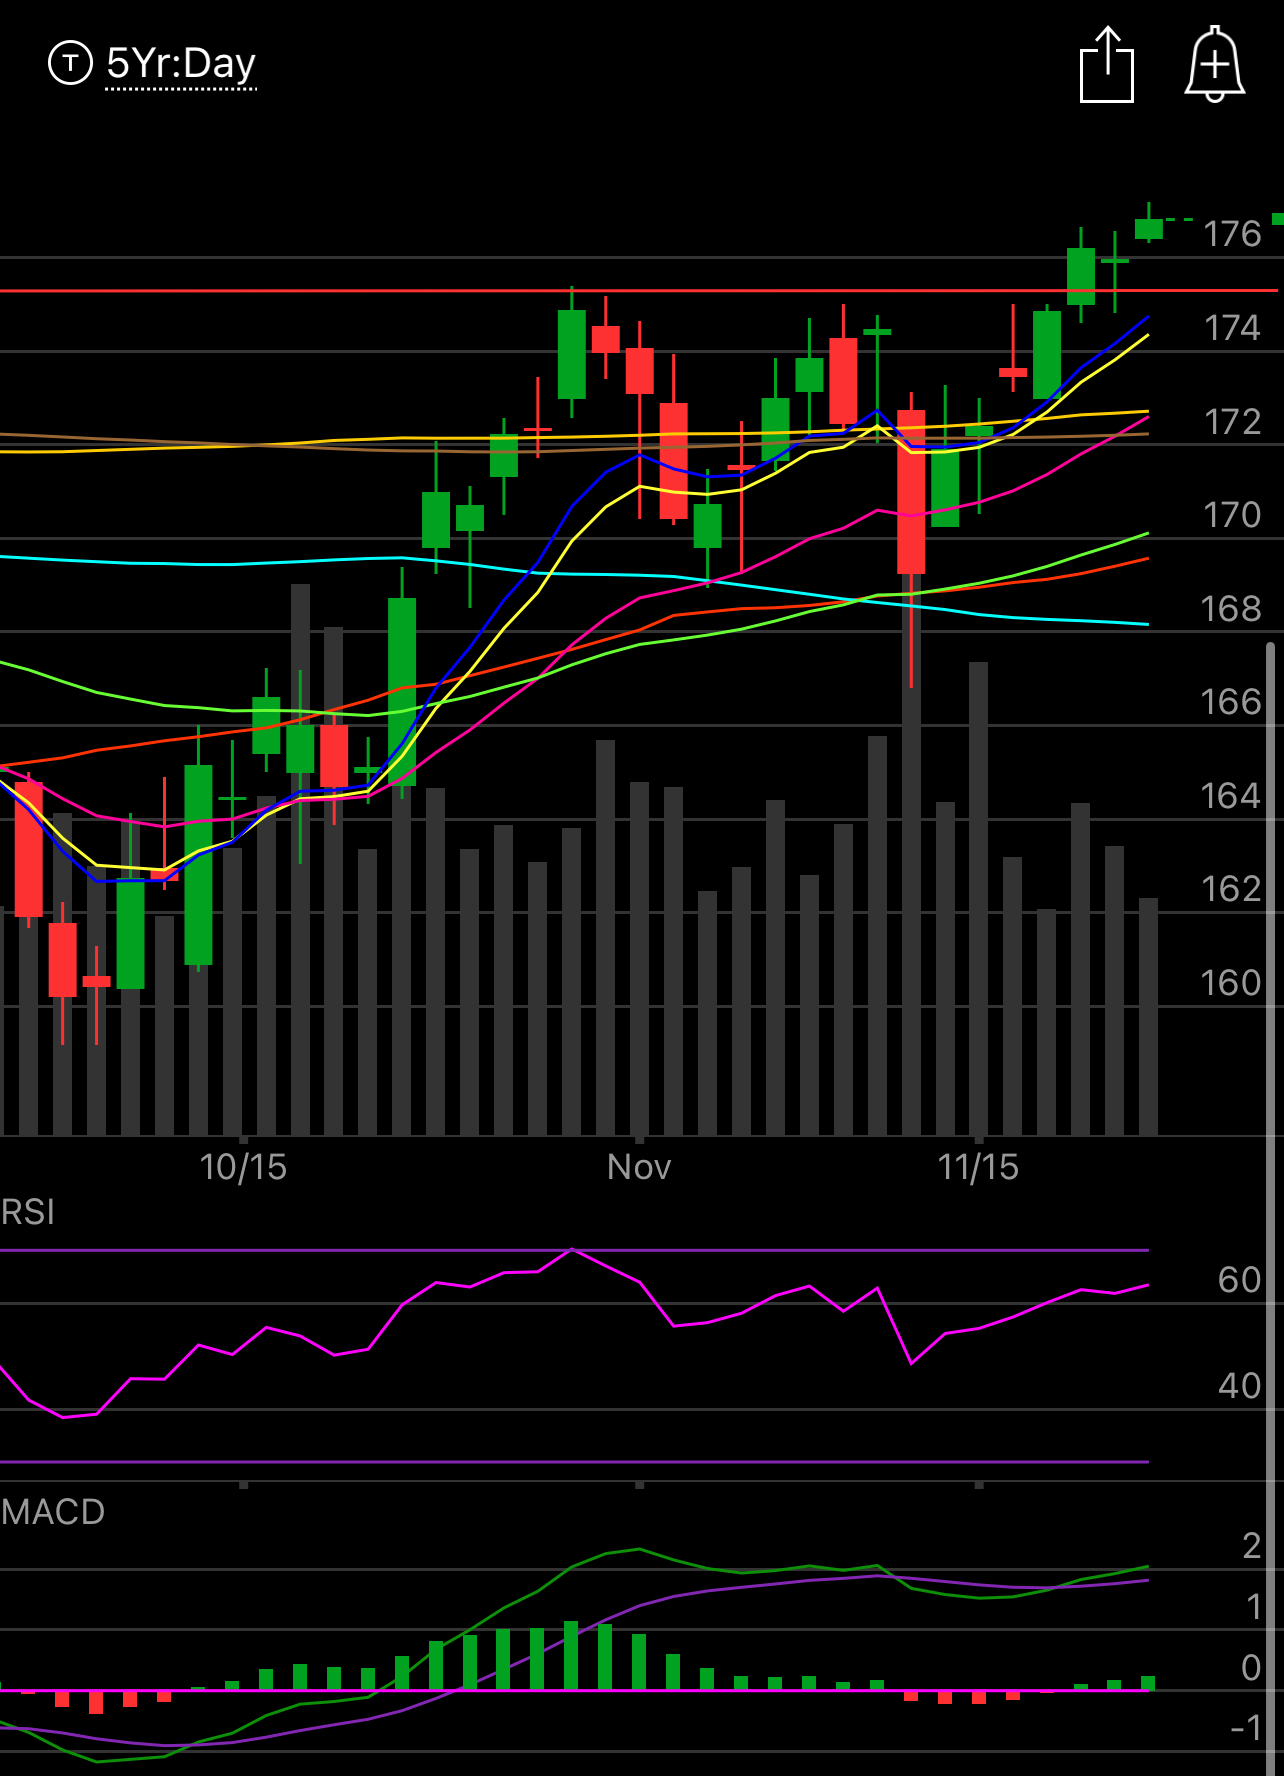
I wanted to also point out this tweet of mine from nearly 2 months ago where I posted a chart on a cult stock and said Tesla was going to the yellow line and sure enough less than 2 months later it hit it on the nose today. I wish I had the courage to short these cult favorites, but I’m so scarred from the last decade of the FED combining with the permabulls to torch shorts that I don’t even waste time with this sort of junk.

Today’s Unusual Activist & What Stood Out
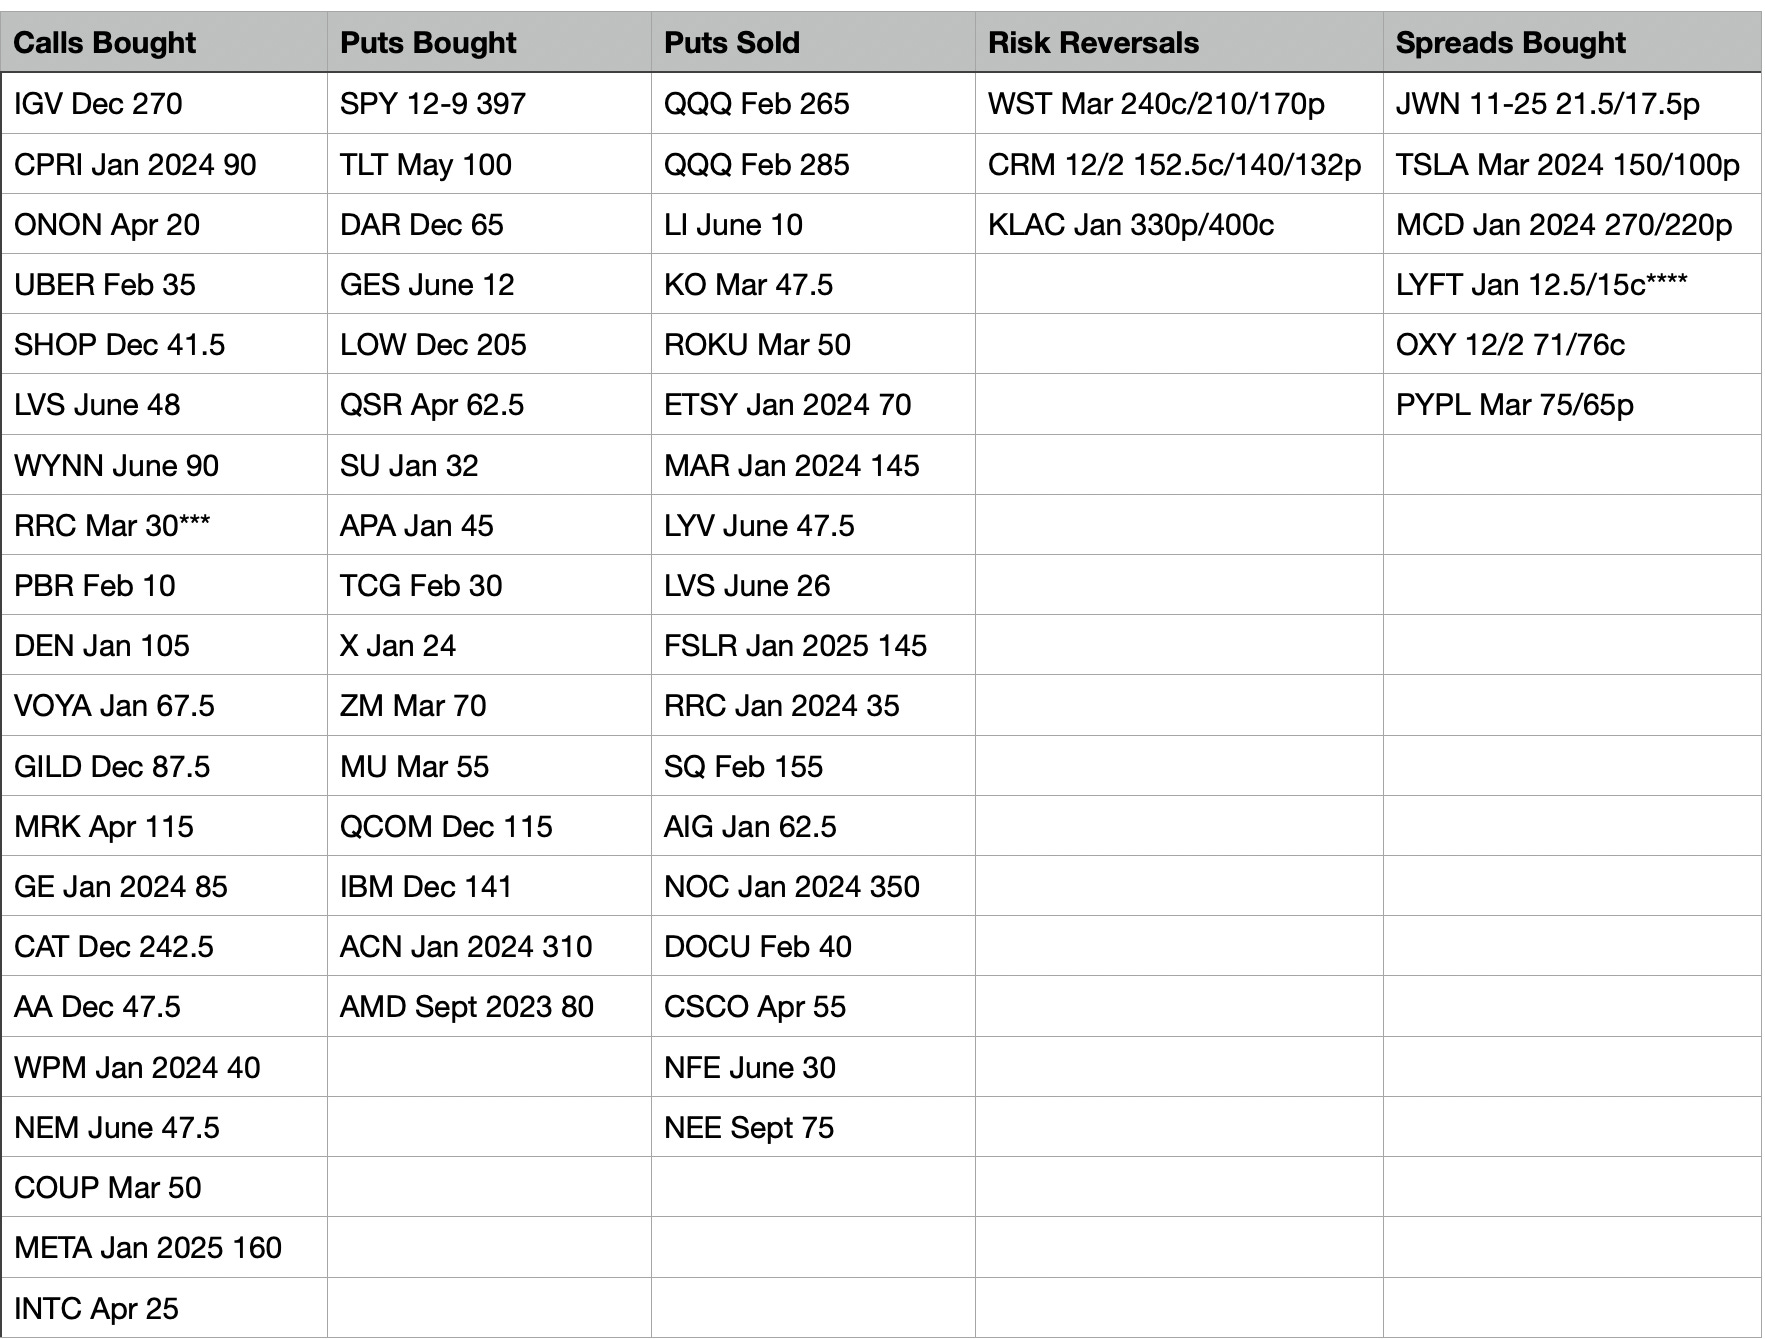
RRC saw 2 unusual trades today in a name that usually doesn’t seem much. There was March $30 calls bought in size and January 2024 $35 puts sold in size.
LYFT saw a huge 50,000 lot of 12.50/15 call spreads bought in January.
OXY saw a nice sized 71/76 call spread bought for next week, this name was smoked yesterday but had a big recovery off the unfounded rumors.
LVS saw a big put sale of next June 26 puts along with 48 calls bought the same month. WYNN also saw $90 calls bought next June, Im tempted to think maybe WYNN is acquired and it lifts LVS by then?
KLAC saw another risk reveral, I forgot what the other one was but I mentioned one recently. Today it was selling January 330 puts to buy $400 calls.
Trade of the Week Update
Look at JNJ, 2 nice candles in a row, funny how that works coming off the breakout. It’s too bad premiums were so soft on this name but it’s had a continued nice move and looks great along with its overall defensive sector. If you sold those puts I recommended over the weekend yesterday morning you should be happy right now.
How Did I Do Today

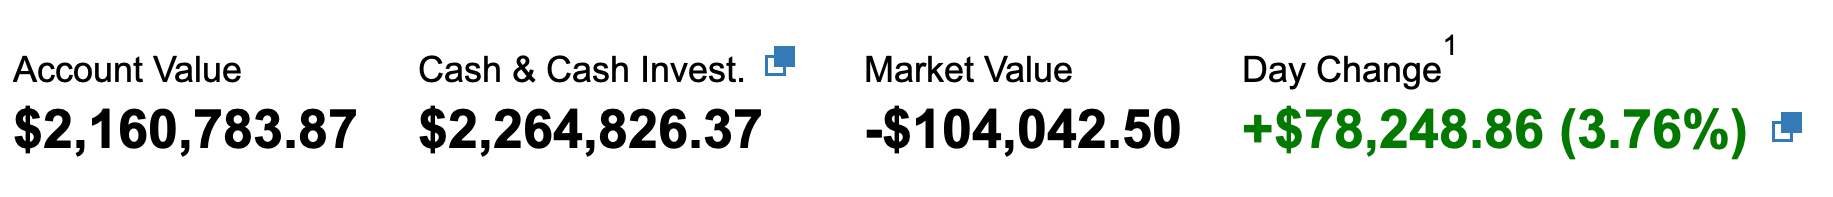
I outperformed pretty nicely today, I had alot of short puts that just evaporated in this meltup. I closed my account today at an all time high for me in my trading account, this was a great way to begin my holiday. Are you guys all close to highs in your trading accounts too? If not, why? I know it’s not my fault if you’ve been trading alongside me since the start in June.
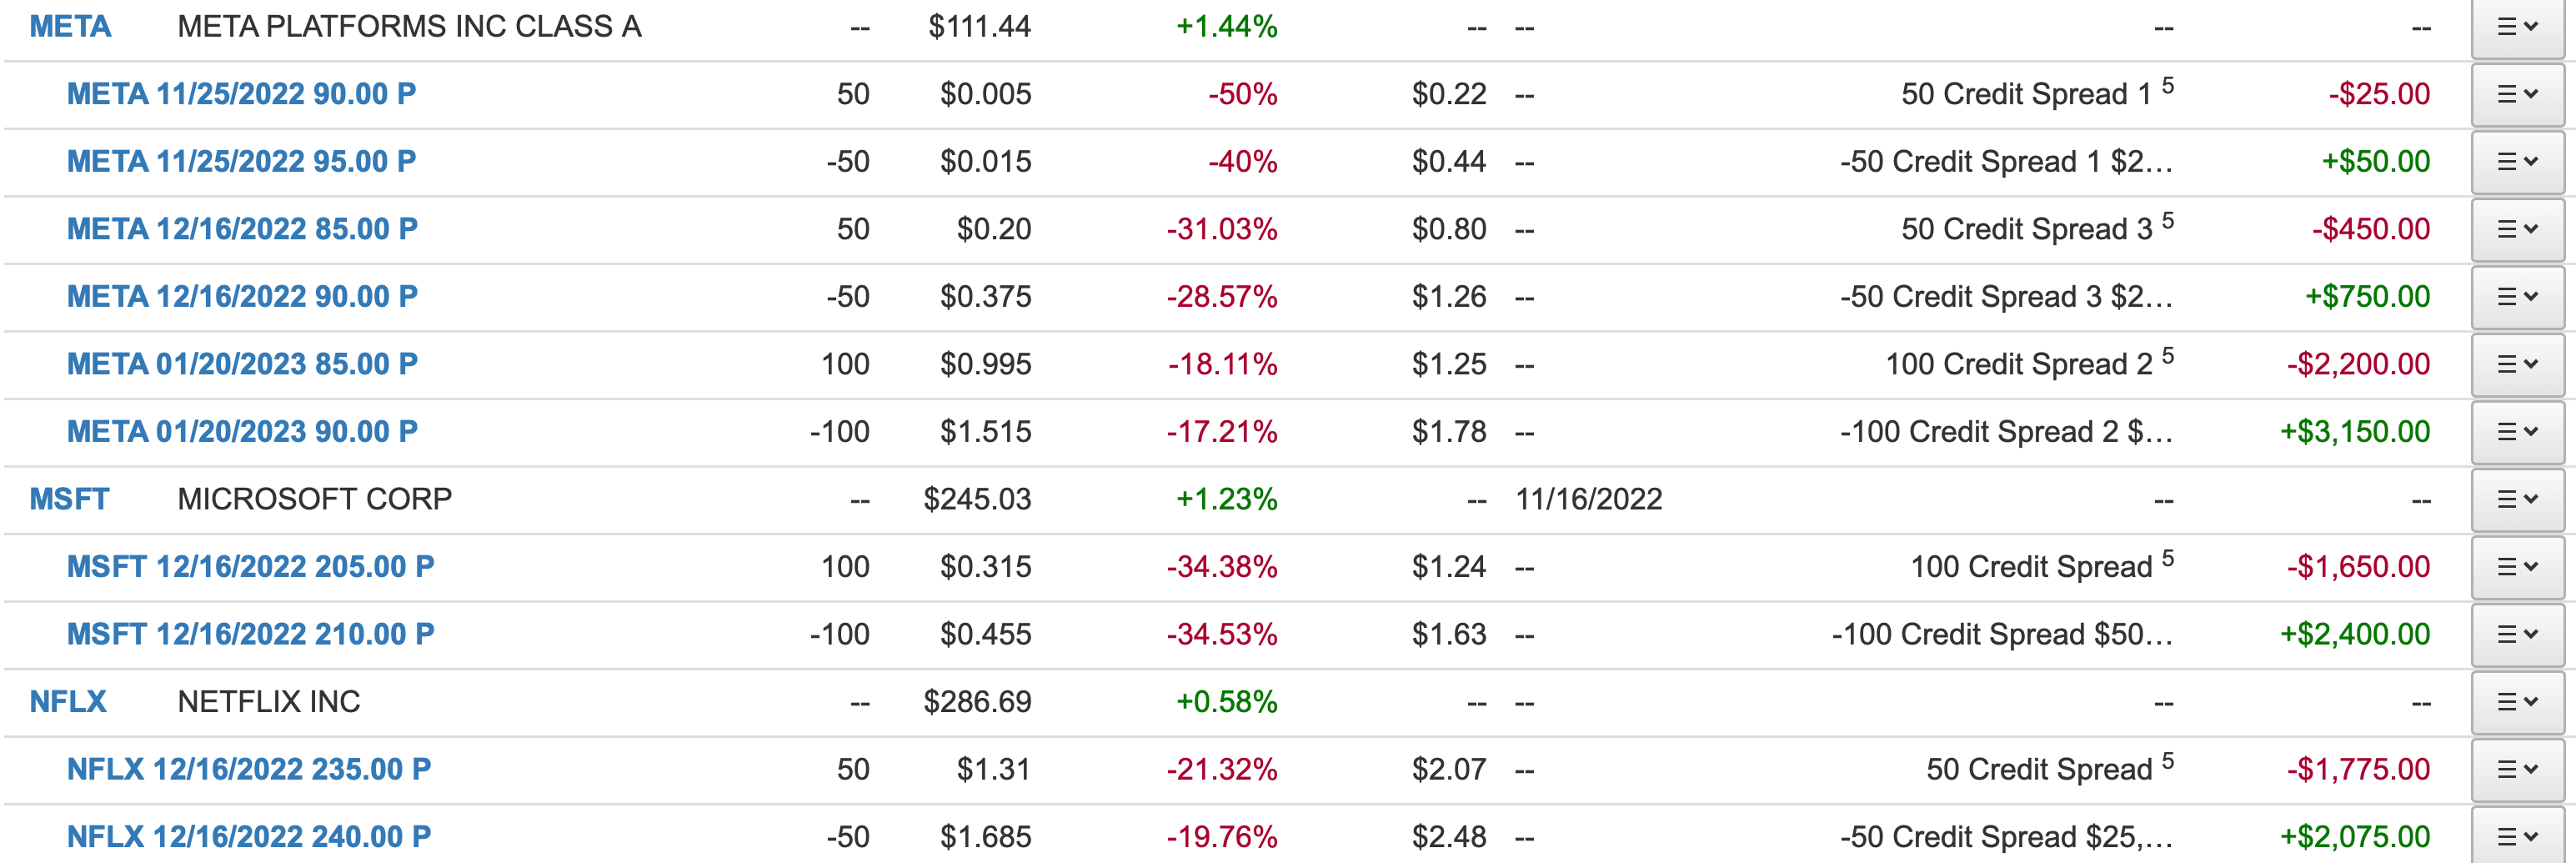
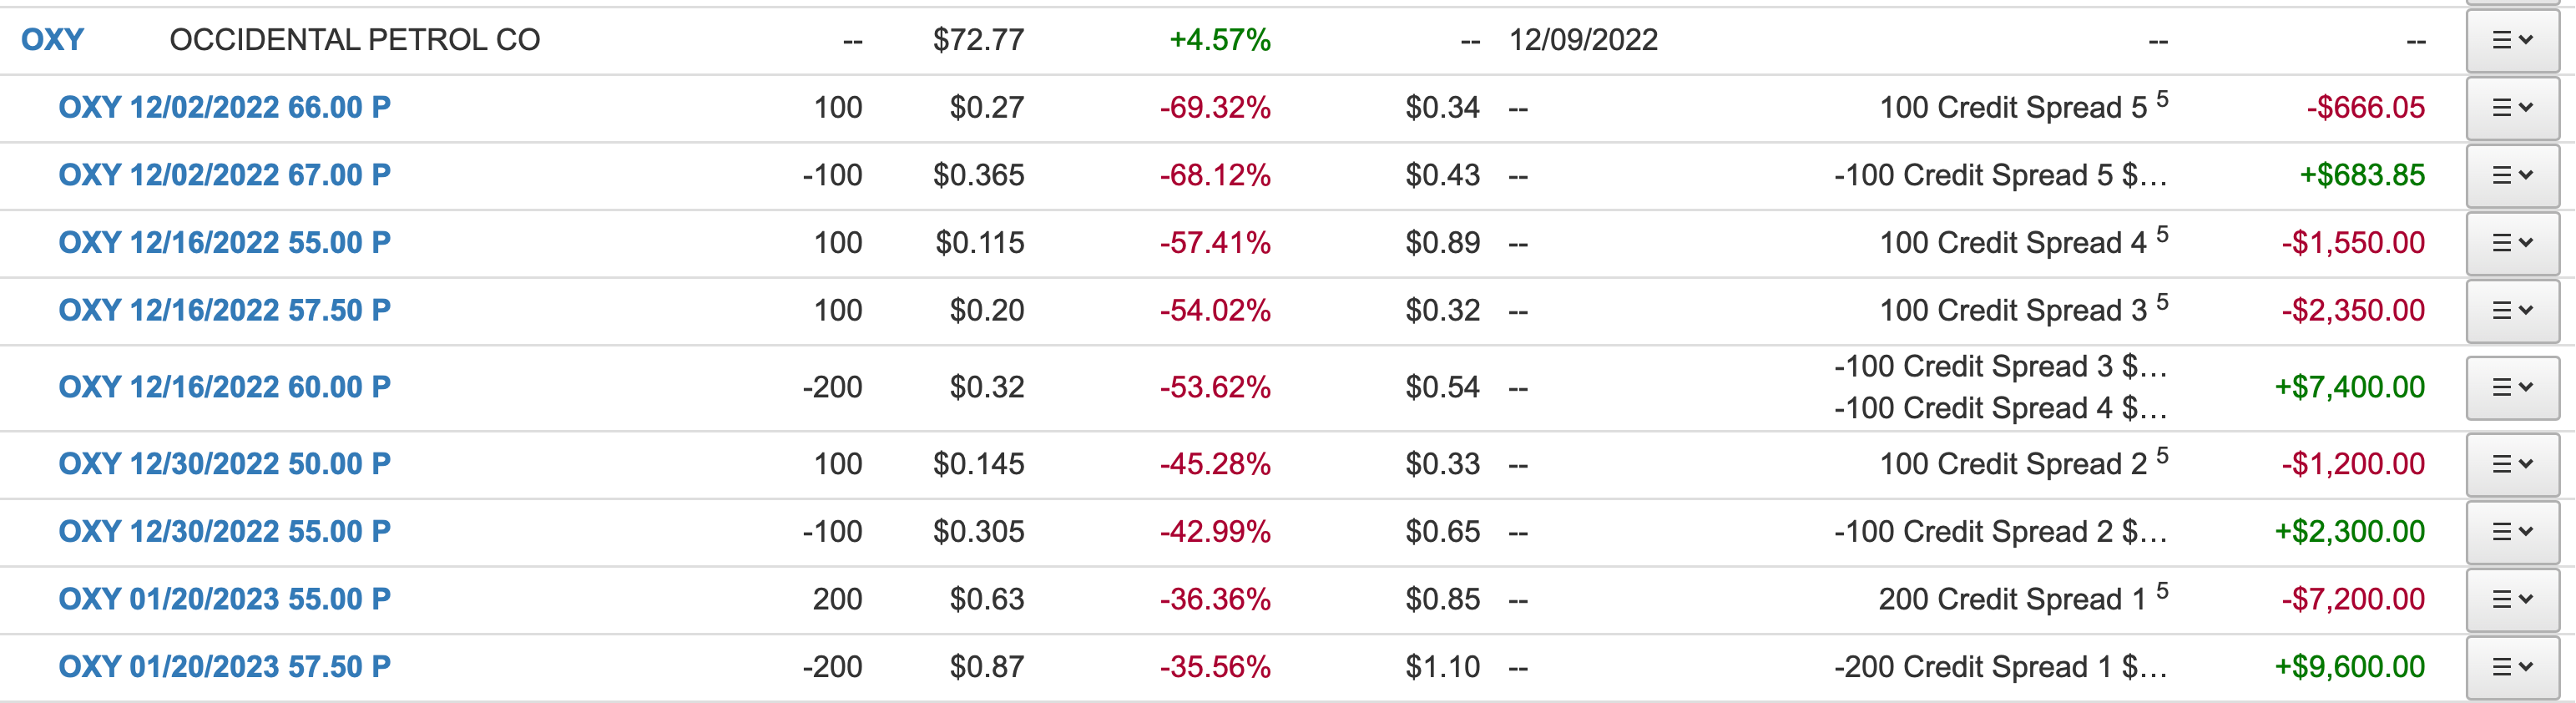
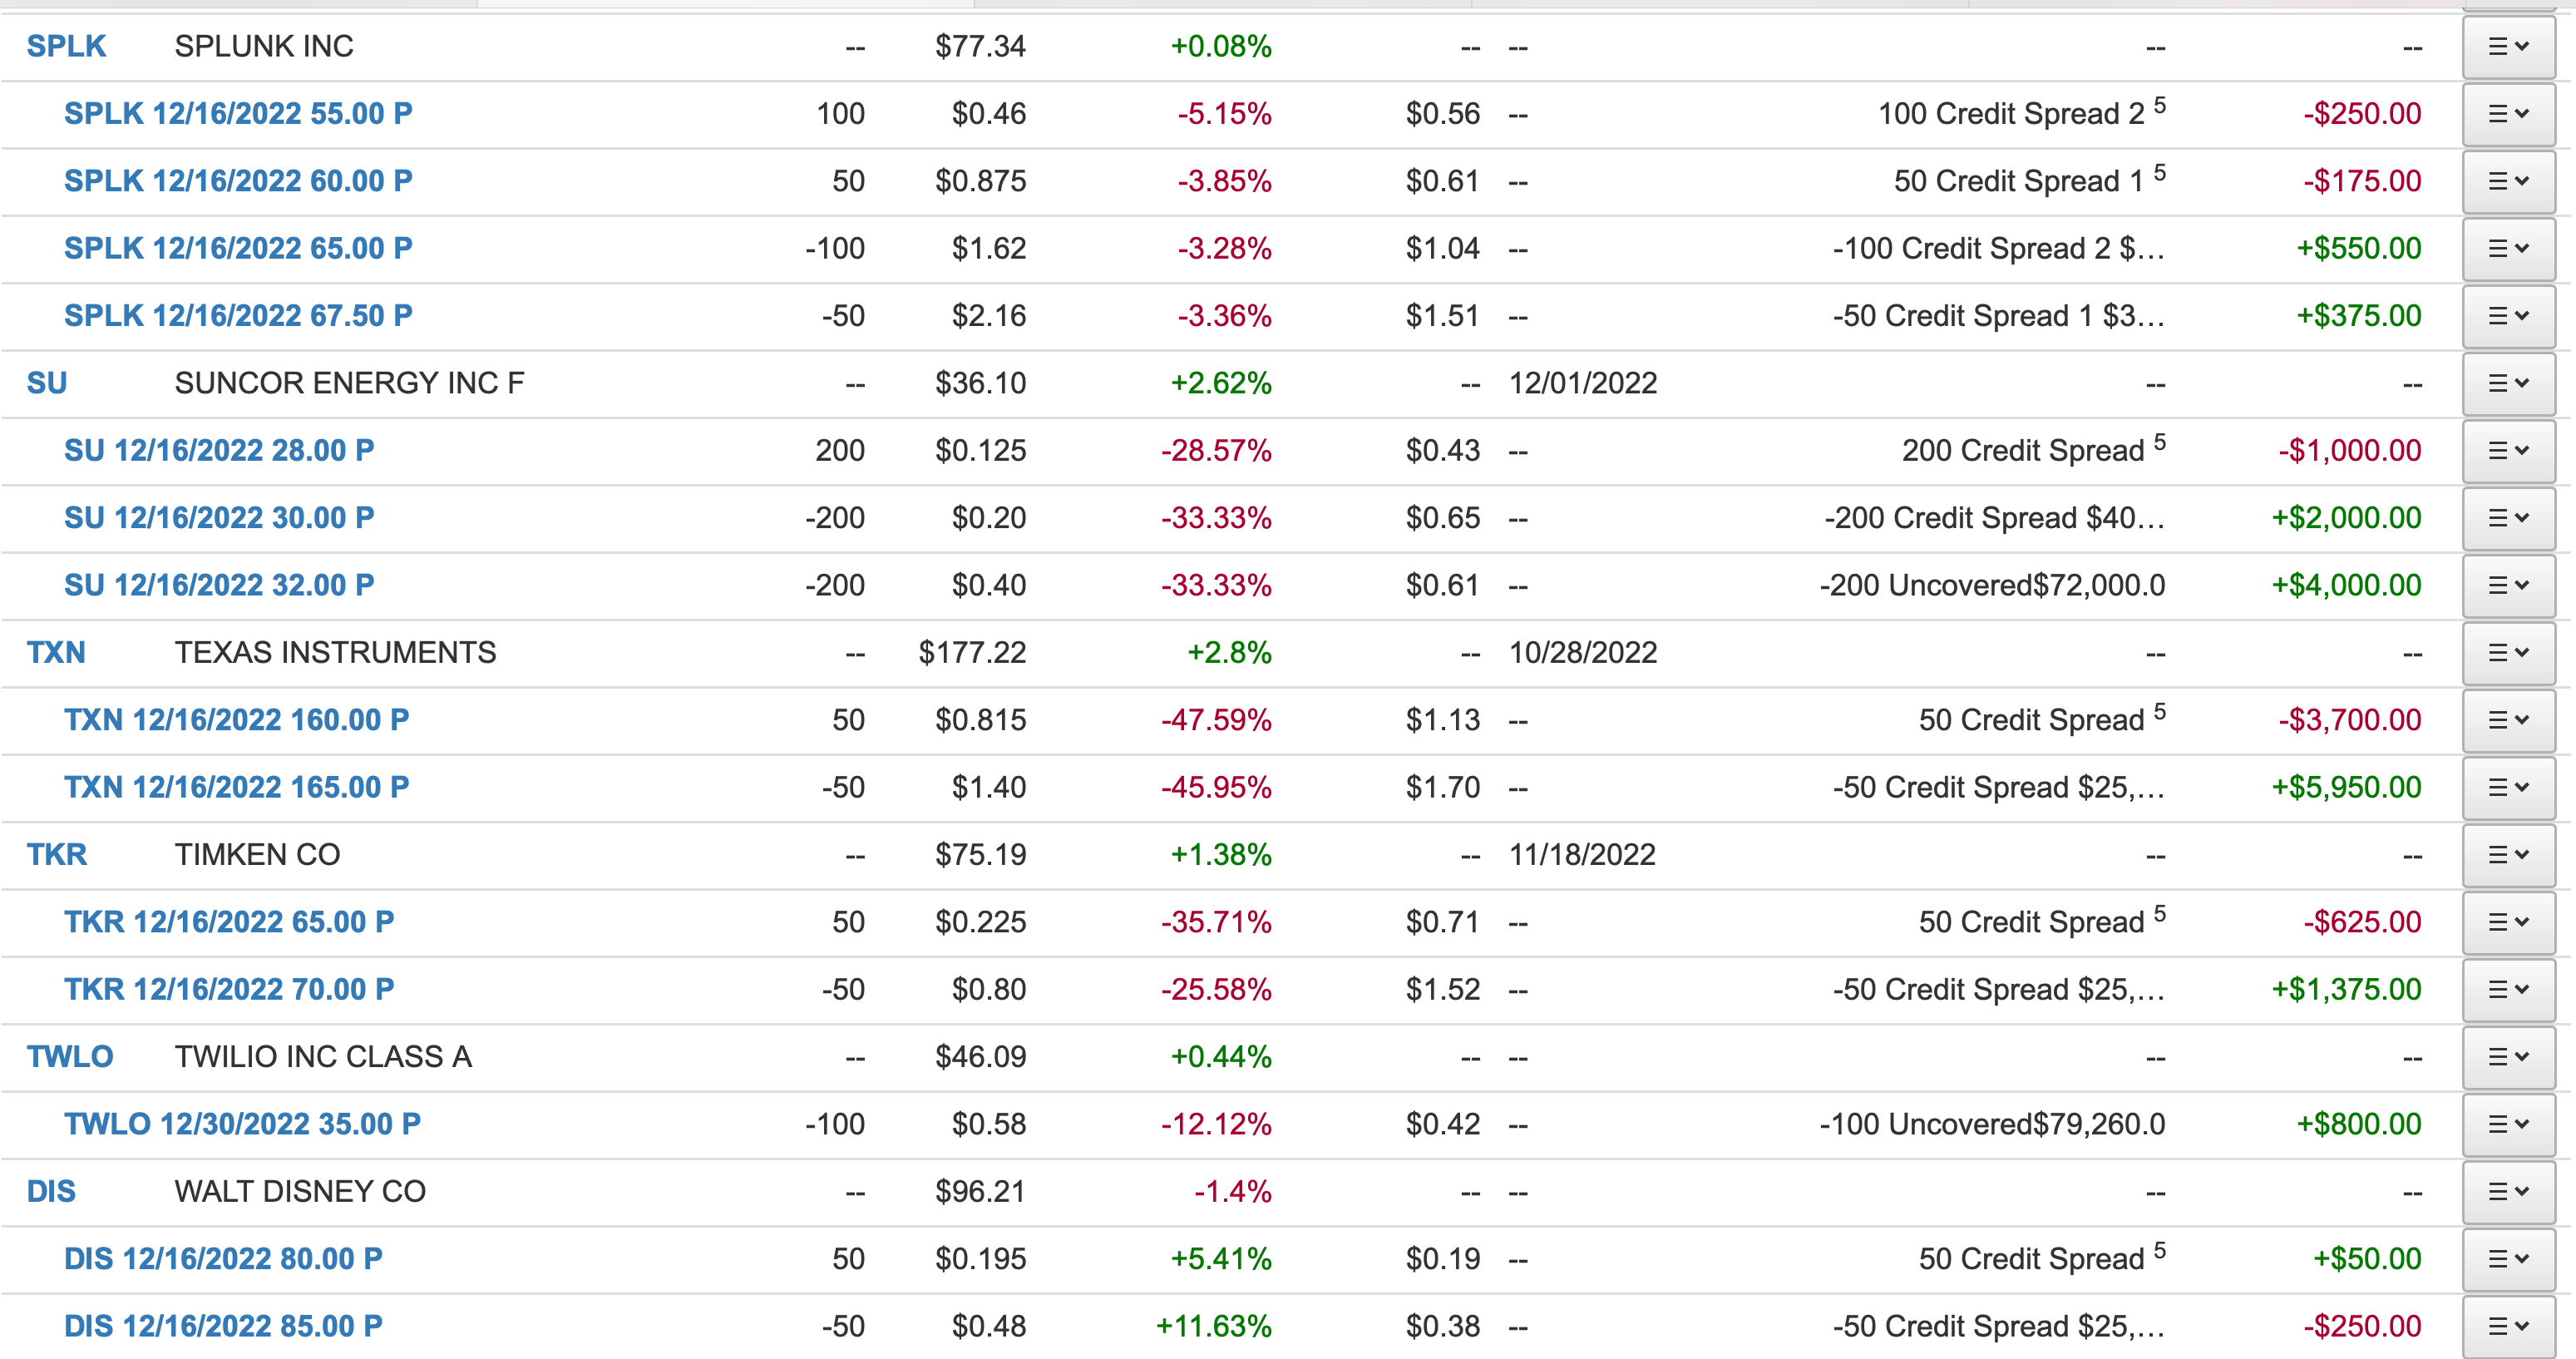
As Always, here is my full positioning at the moment
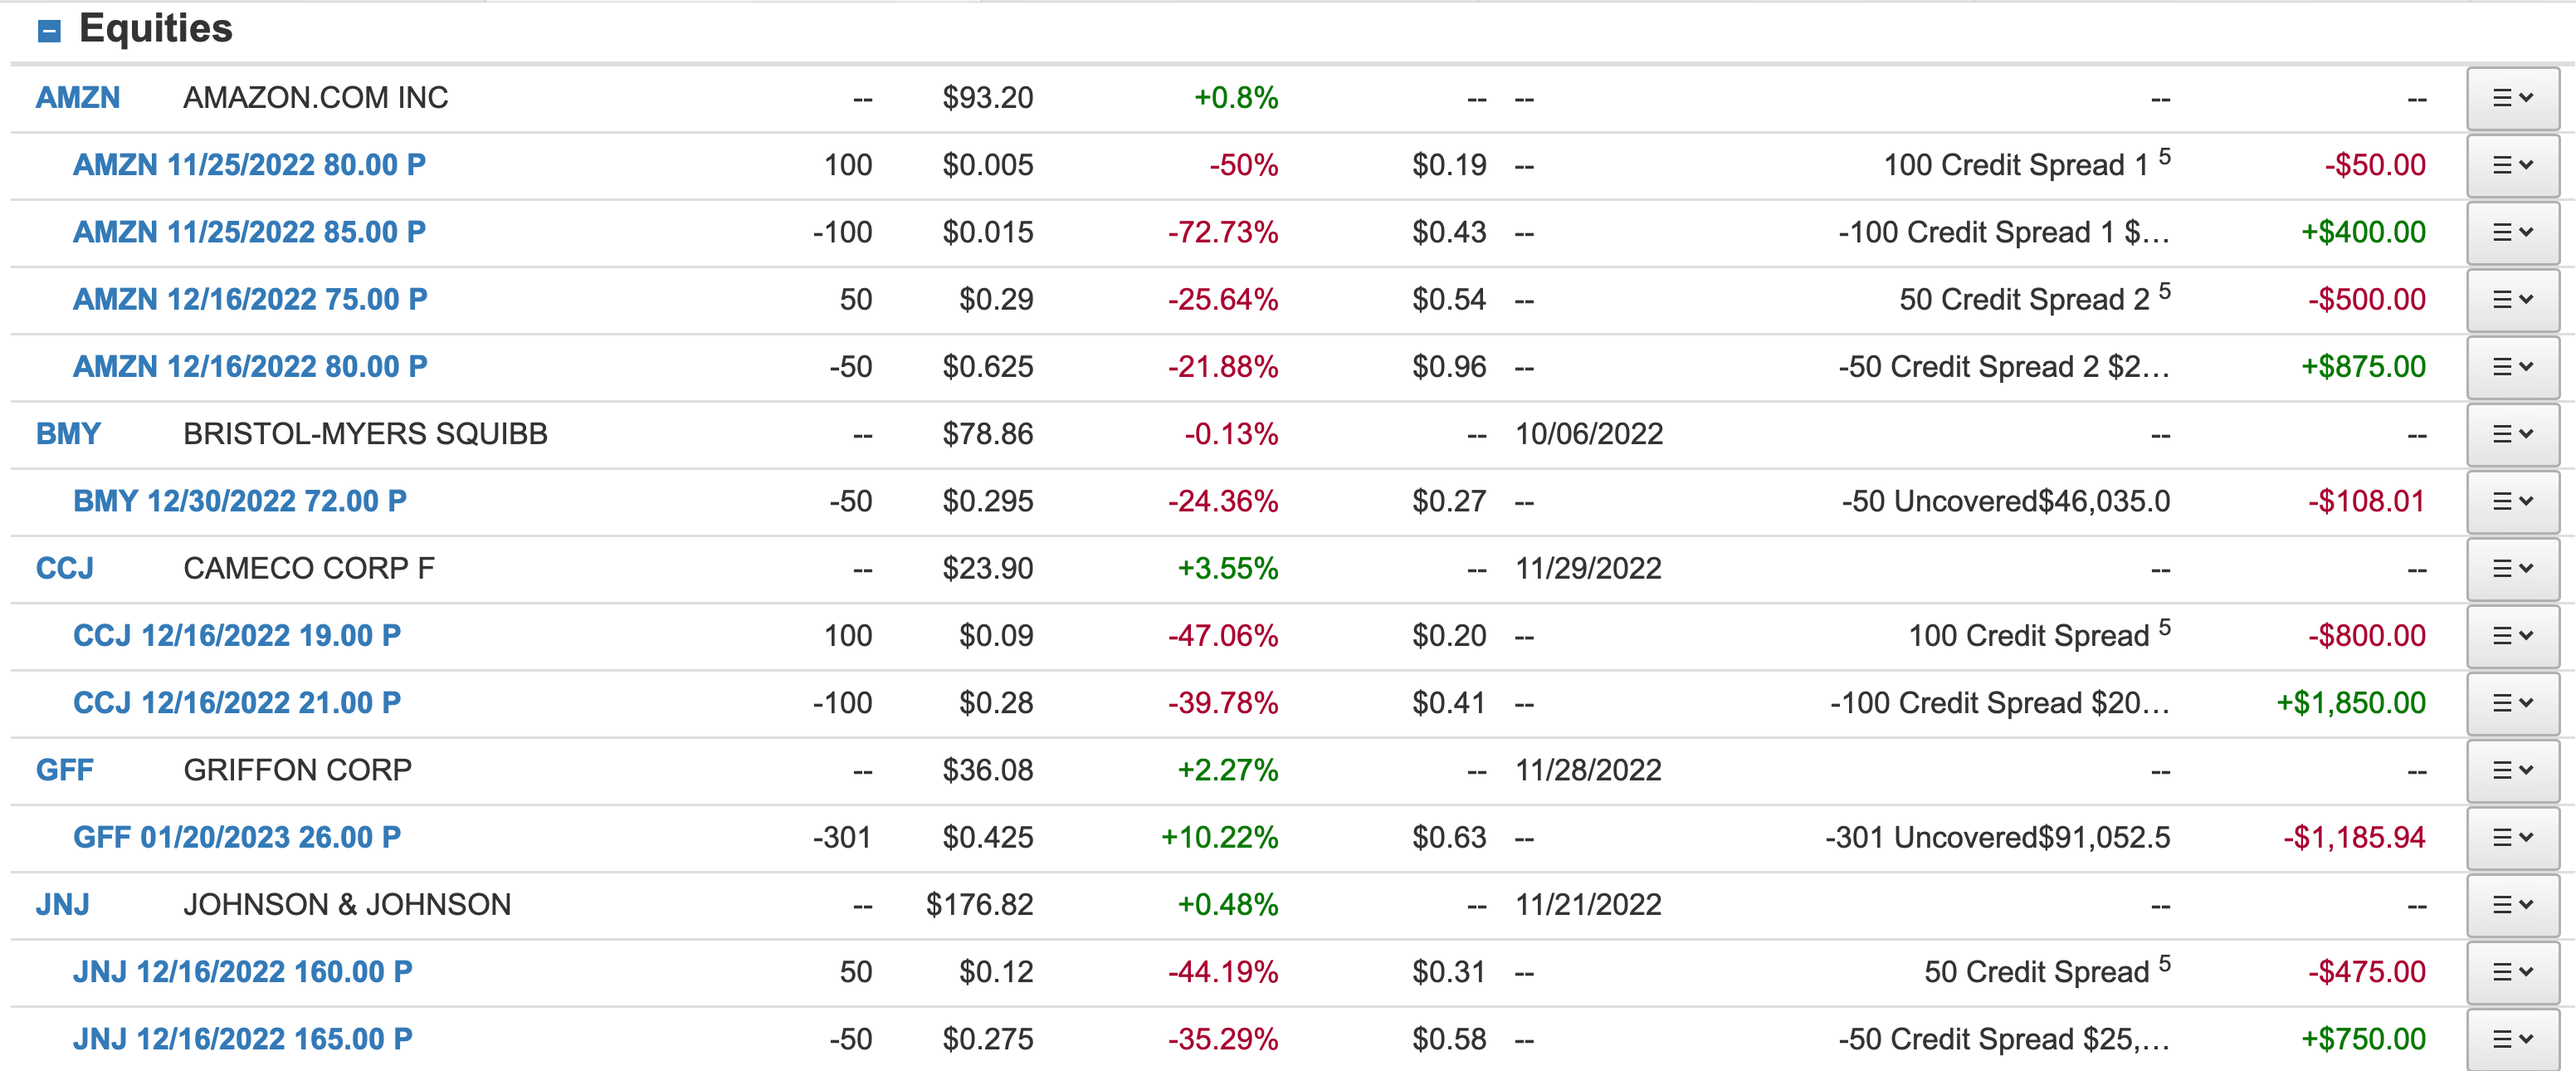
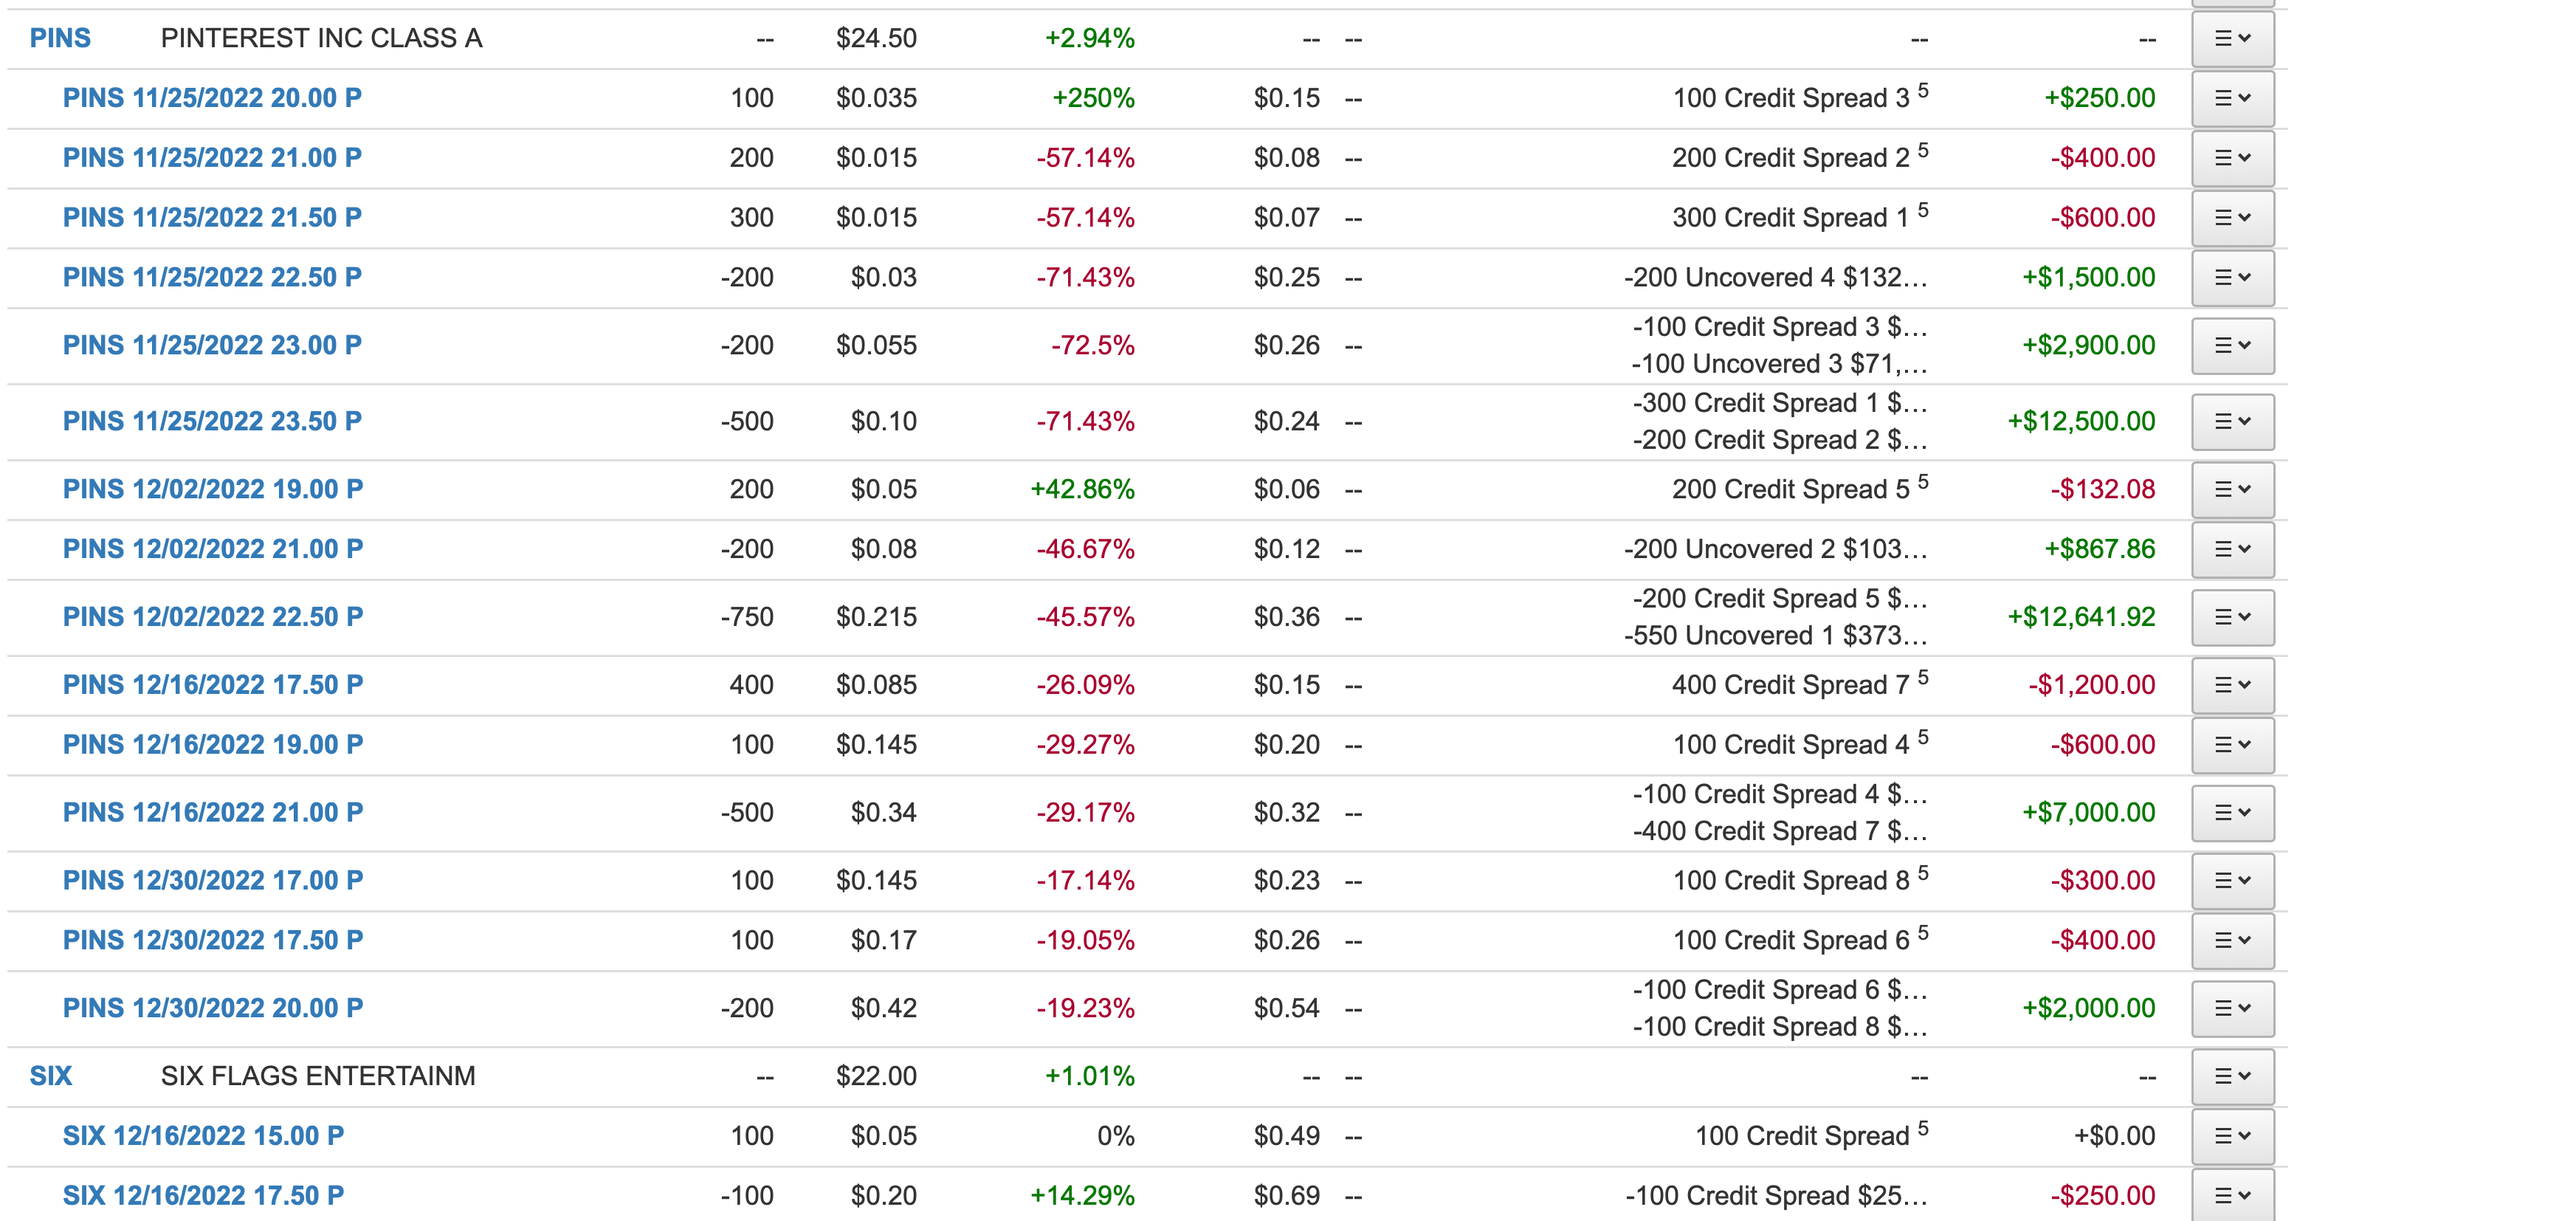
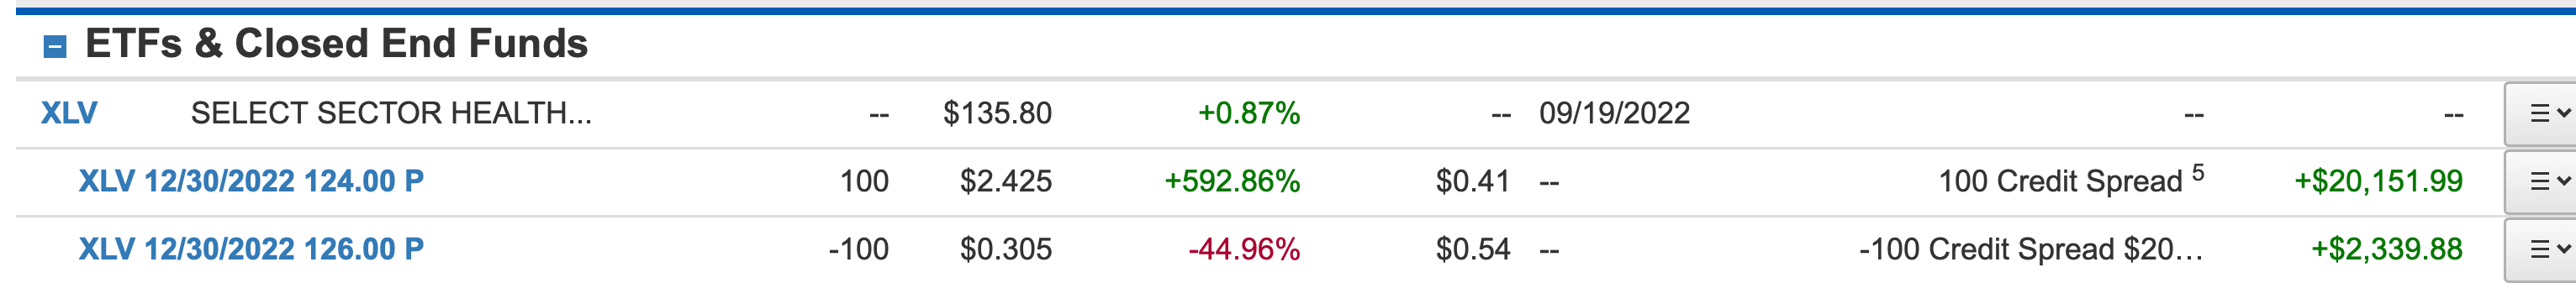
I didn’t add much today. I sold some XLV 12/30 126/124 put spreads for .13 into what looks like the strongest sector for now. I sold some BMY puts for 12/30 at .28, another XLV component. I sold 12/2 PINS 21/19 put spreads for .09 into a chart/name that I still love. That’s it. I still have alot of PINS short puts expiring this week at 23.50, maybe I still get shares there, I don’t know. I do know volume will be very light whatever happens the next 2 days so don’t get too worked up over it.
I will be getting short soon, heavily, just being patient. When I get short heavily, I tend to use common and sell puts well beneath it to reduce my basis, but the idea is at the red trendline I’ve mentioned for weeks on the SPY chart above, the risk/reward is minimal because should the SPY breakout we would close the short. We’d be risking minimal money with alot of upside if it works out.
Anyways I hope you all have a great thanksgiving with your families, and we will be back at this over the weekend when I post next week’s best ideas. Enjoy the holiday.
As El said, thanks, as always, for your update. WRT the oil chart, what strikes me about it are the long wicks. Looks more like a reversal than a collapse..
You asked what might be left out of your daily reports. The one thing I virtually never look at is the image with "Unusual Activity and What stood out." Far too much information for me to spend much time on it.
Happy Thanksgiving to you and your family.
Thanks as always for your post! :) I’ve a question: if you ever intend on selling puts against Amazon, what would be a good strike price in terms of fib or moving average supports? I plan on selling either $90/95 puts for Dec 30 expiration on the basis that $85/90 is a strong support level.