1/17 Recap
We got a big gap down overnight. China continues to be a trainwreck with another selloff overnight. Tesla also cut prices on their best selling model Y in Europe and the market did not like that just one day after Elon’s comments. Apple, the largest component in our markets, broke below the 200 day for the first time in a long time today, but so far it has recovered. I don’t want to say we’re in a recession, but something isn’t right. In 2022, they completely changed the definition of a recession to keep us out of a recession, and I do feel they will do that again here as we head into an election. Small caps are breaking down, oil is very weak, yesterday’s Empire manufacturing number was many standard deviations off, yields are ticking higher and the VIX is finally catching a bid. Something is brewing under the surface.
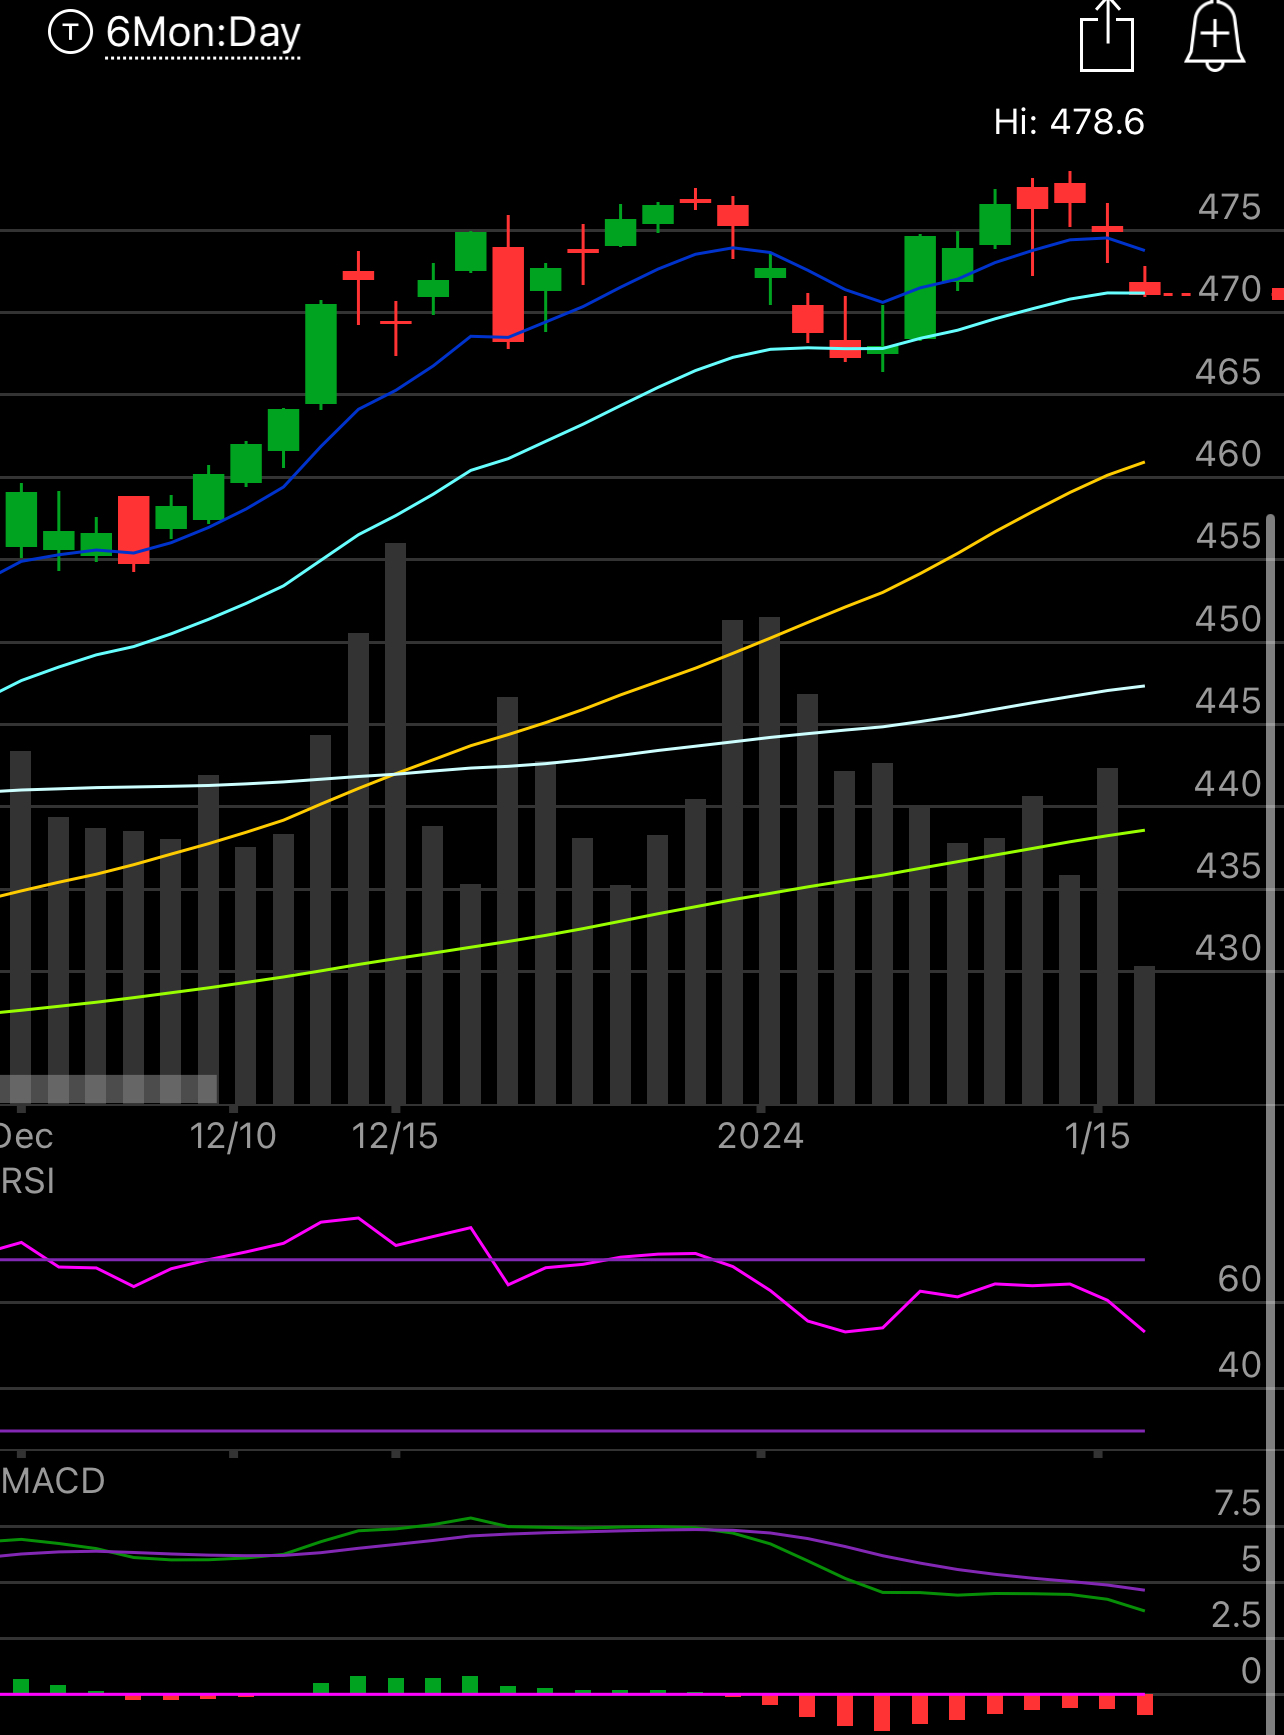
For me, I just look at the charts, that is the true story, never in the history of markets have we broken down without breaking below these key moving averages. The SPY as you can see below is sitting right on the 21 ema, we were right there 8 sessions ago and bounced. In an uptrend, you should bounce here. If we break down here today or tomorrow that yellow line, the 50 sma, is our next support. Again you should have these 5 key averages on your charts: 8 ema, 21 ema, 50 sma, 100 sma, 200 sma. Those are your 5 most important ones in my book on daily or longer timeframes.
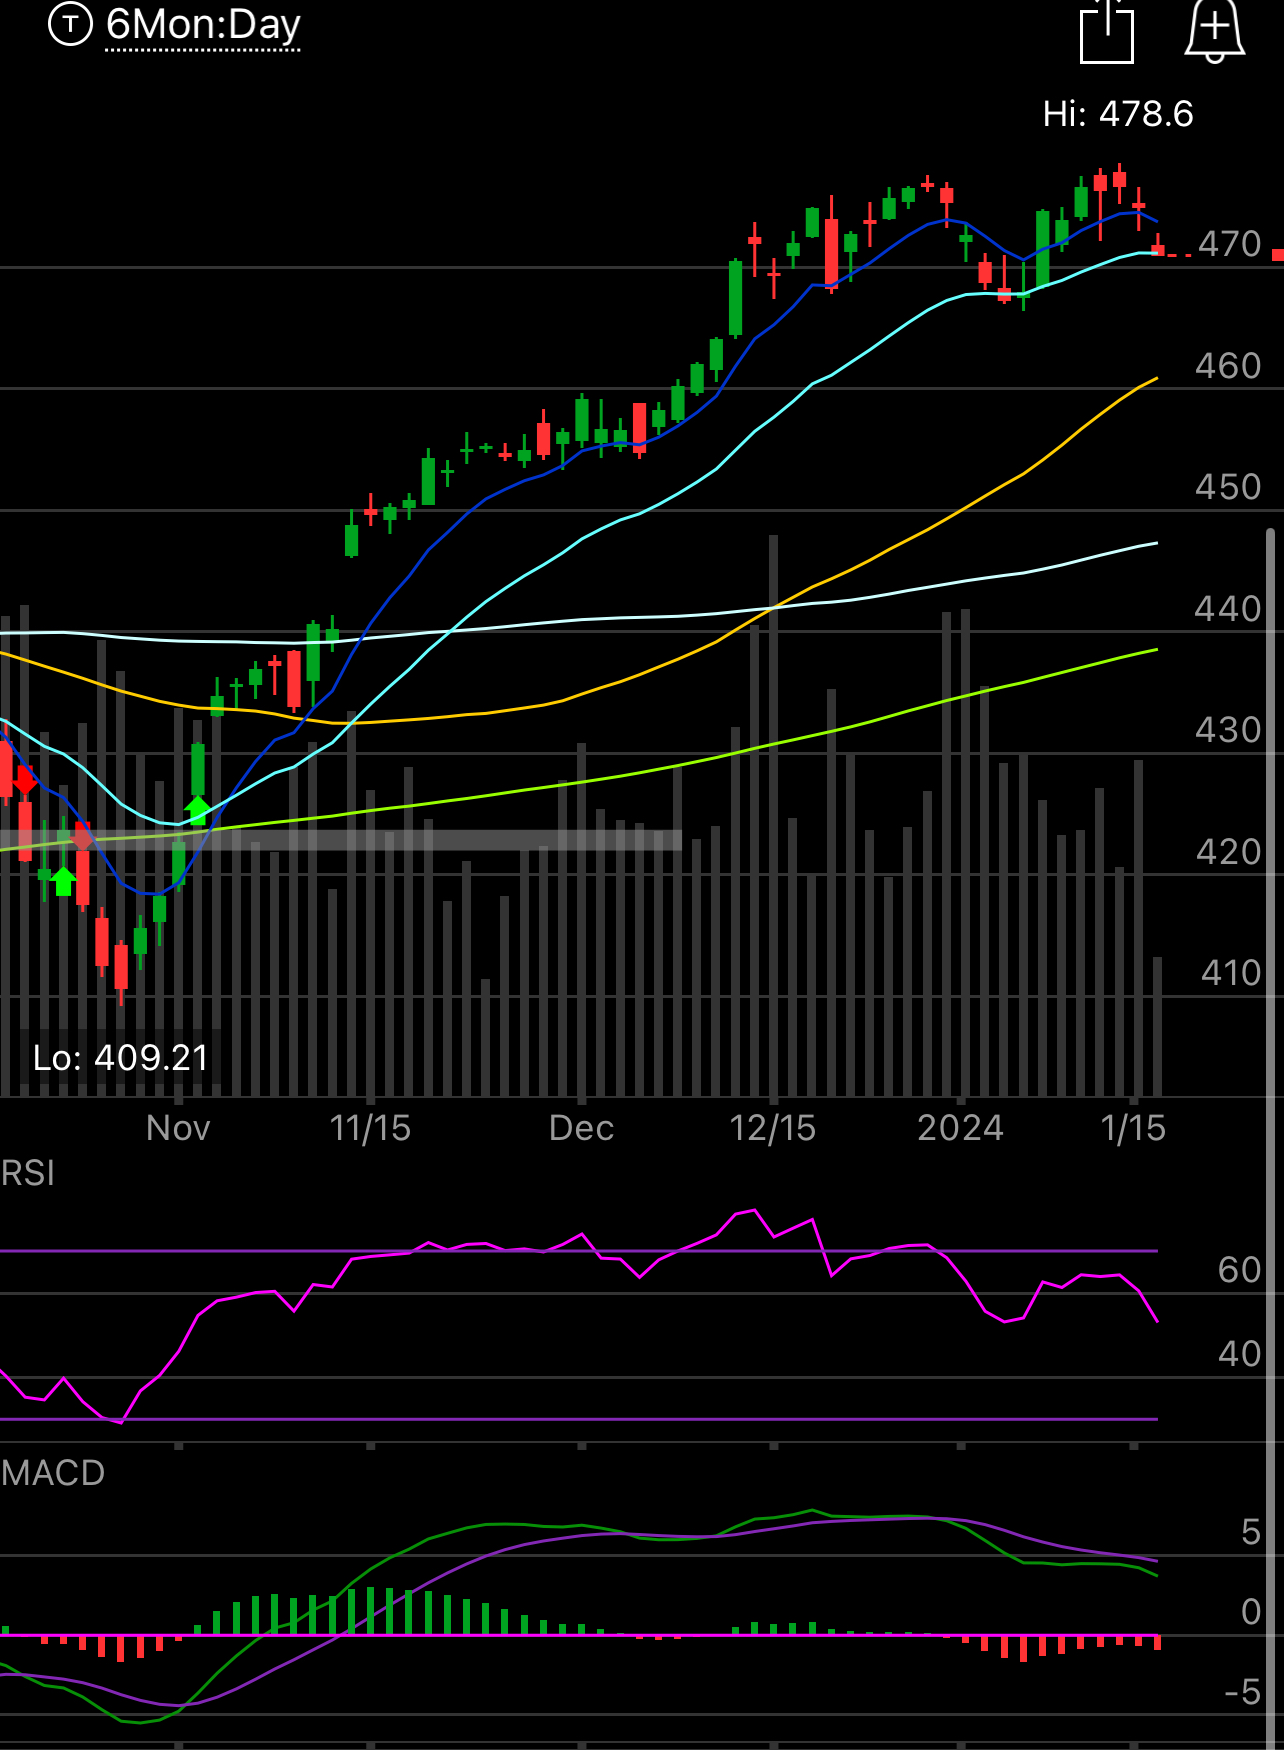
If you zoom out further ,below, you will notice that since this rally in the market began in late October, we have not broken down below the 21 ema one time. So it would be notable and a trend change if that were to occur and it seems to be happening right now.
Now this doesn’t mean panic, that doesn’t mean crash, it means if you have leverage you should remove it as we go through a period of weakness, they don’t usually last forever and you should start selling calls against longs that you have for downside protection. So don’t panic and rush out and sell everything, stocks don’t go up in a straight line, well they have for almost 3 months, but sometimes they go down too, the good thing is you’re learning that you can see it in the charts and adjust your positioning. Again I wouldn’t do any of this until we get a confirmed close below the 21 ema, we have not yet, but we’re very close so caution is warranted.
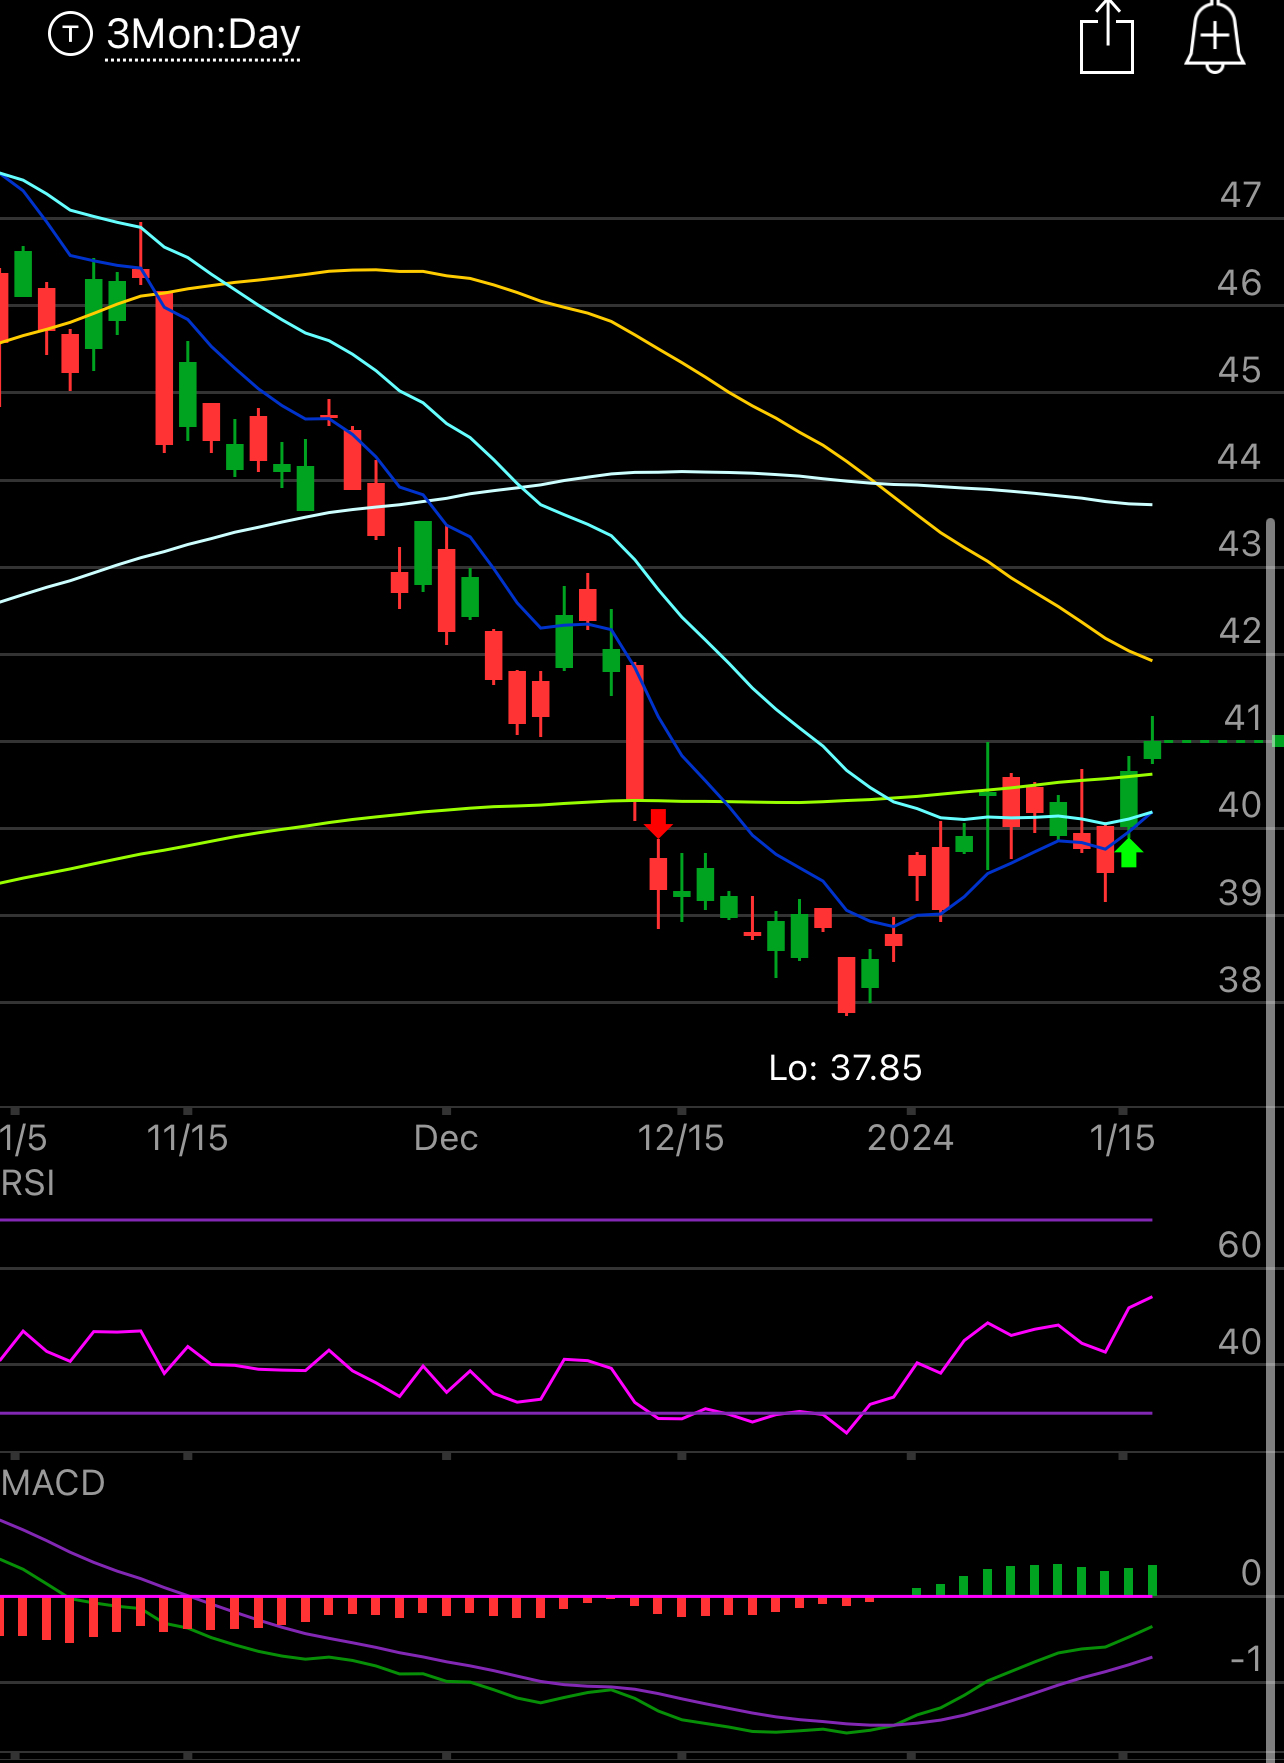
Look at the TNX below, just pretend this was any other chart, yes or no, would you buy that? For me the answer is YES. That is a nice setup, breaking the downtrend, breaking up out of a flag and it looks like it wants higher. The problem is, this is yields, and if yields are breaking out, it puts pressure on equities. This together with the VIX up close to 10% today and the dollar green is the pressure you’re seeing on the market. So this is another warning sign.
If you’re a longer term investor, none of this stuff matters, stocks have been up and to the right historically over time, this is all shorter term stuff if you’re an active trader which many of you are. So again, do not panic, this is all very normal as we ebb and flow. Who knows maybe the market bounces right of the 21 ema and we go straight to the moon, nobody knows, but if/when we break below that 21 ema, you have to be cautious, that’s just how the market works. The algos do over 80% of the trading and they’re programmed to buy/sell on these triggers and you have to think how they think.
Trends
1 Week
2 Week
Today’s Link
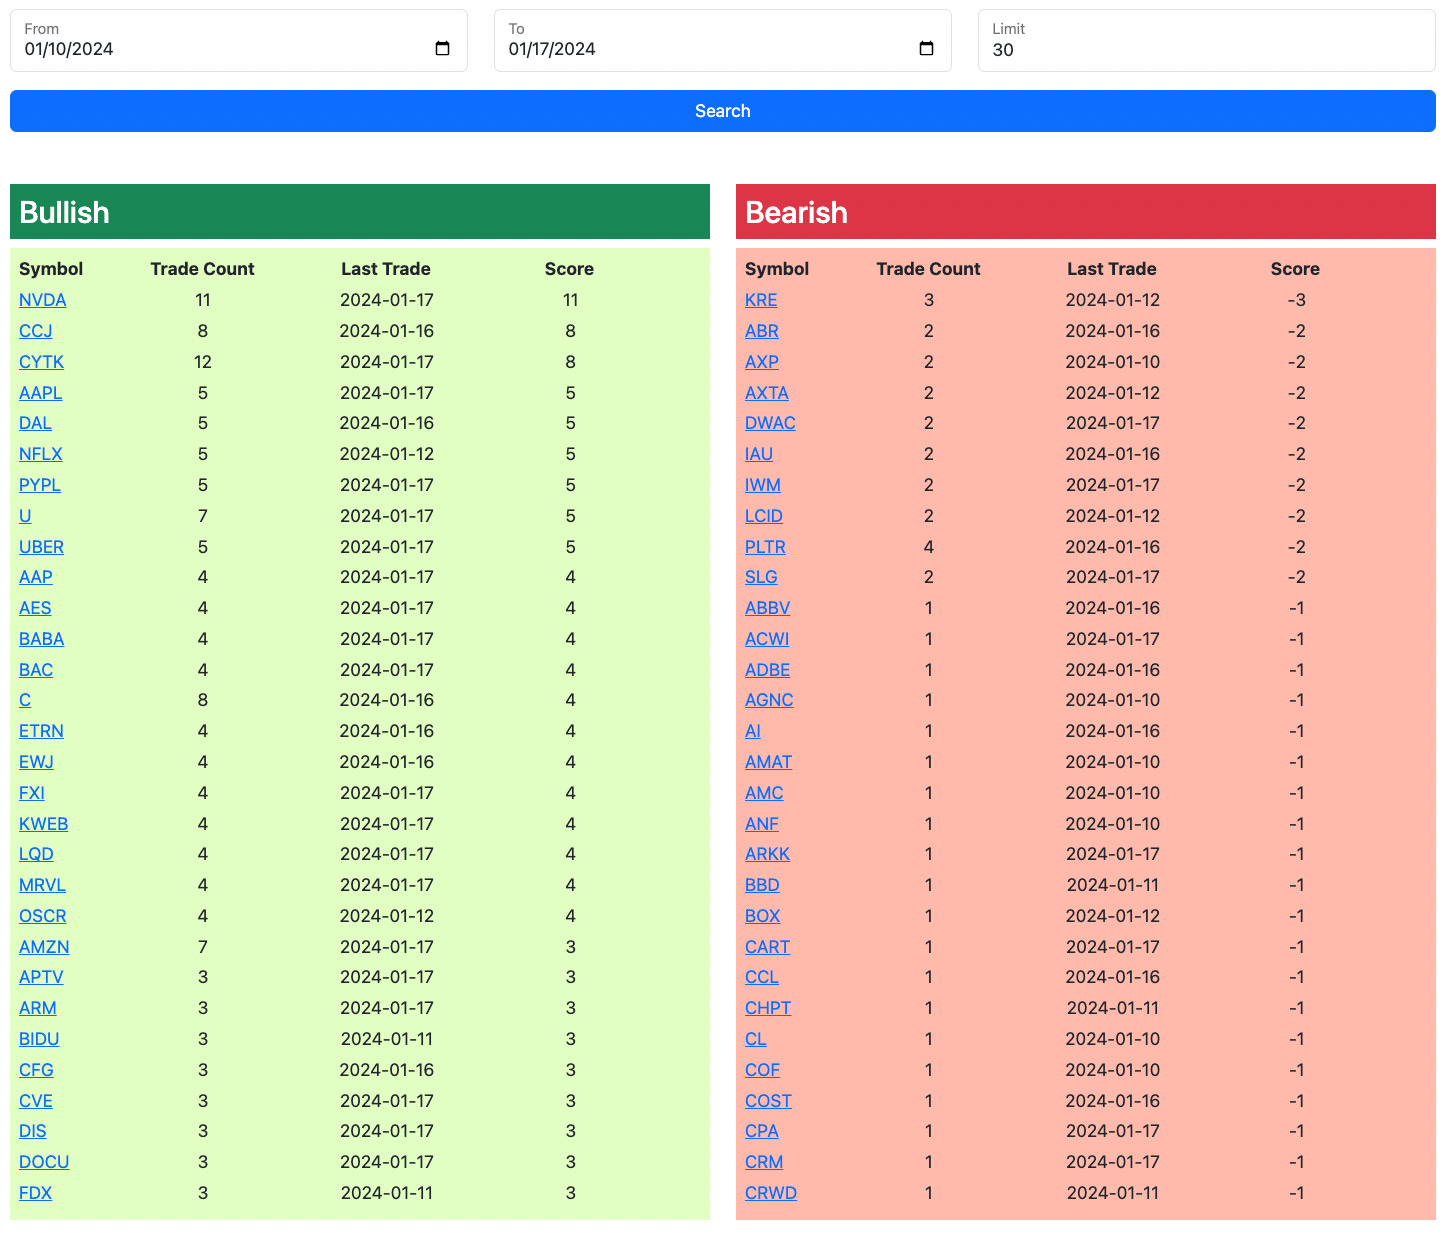
Here is today’s link to the database and as always it expires at 9:30 AM EST tomorrow. The rest of today’s action will be added to the database by this evening. Again please remember the trends table below is just up to when I cutoff, there will be many more trades in the database by this evening and even right after I post this as I continue to log trades until I leave my desk.


