
12/10 Best Ideas For The Week Ahead

What a week lies ahead. We have CPI on tuesday, FOMC wednesday, followed with a speech from Powell on wdnesday afternoon. These weeks are not fun, the entire market basically has earnings like moves and chaos usually ensues in both directions. I would say if you have anything long or if you have any puts shortly expiring, be careful, honestly, with how well we’ve done the last 6 months, even contemplate closing most of it up and going into cash until we have more clarity on direction after Powell, here is why.
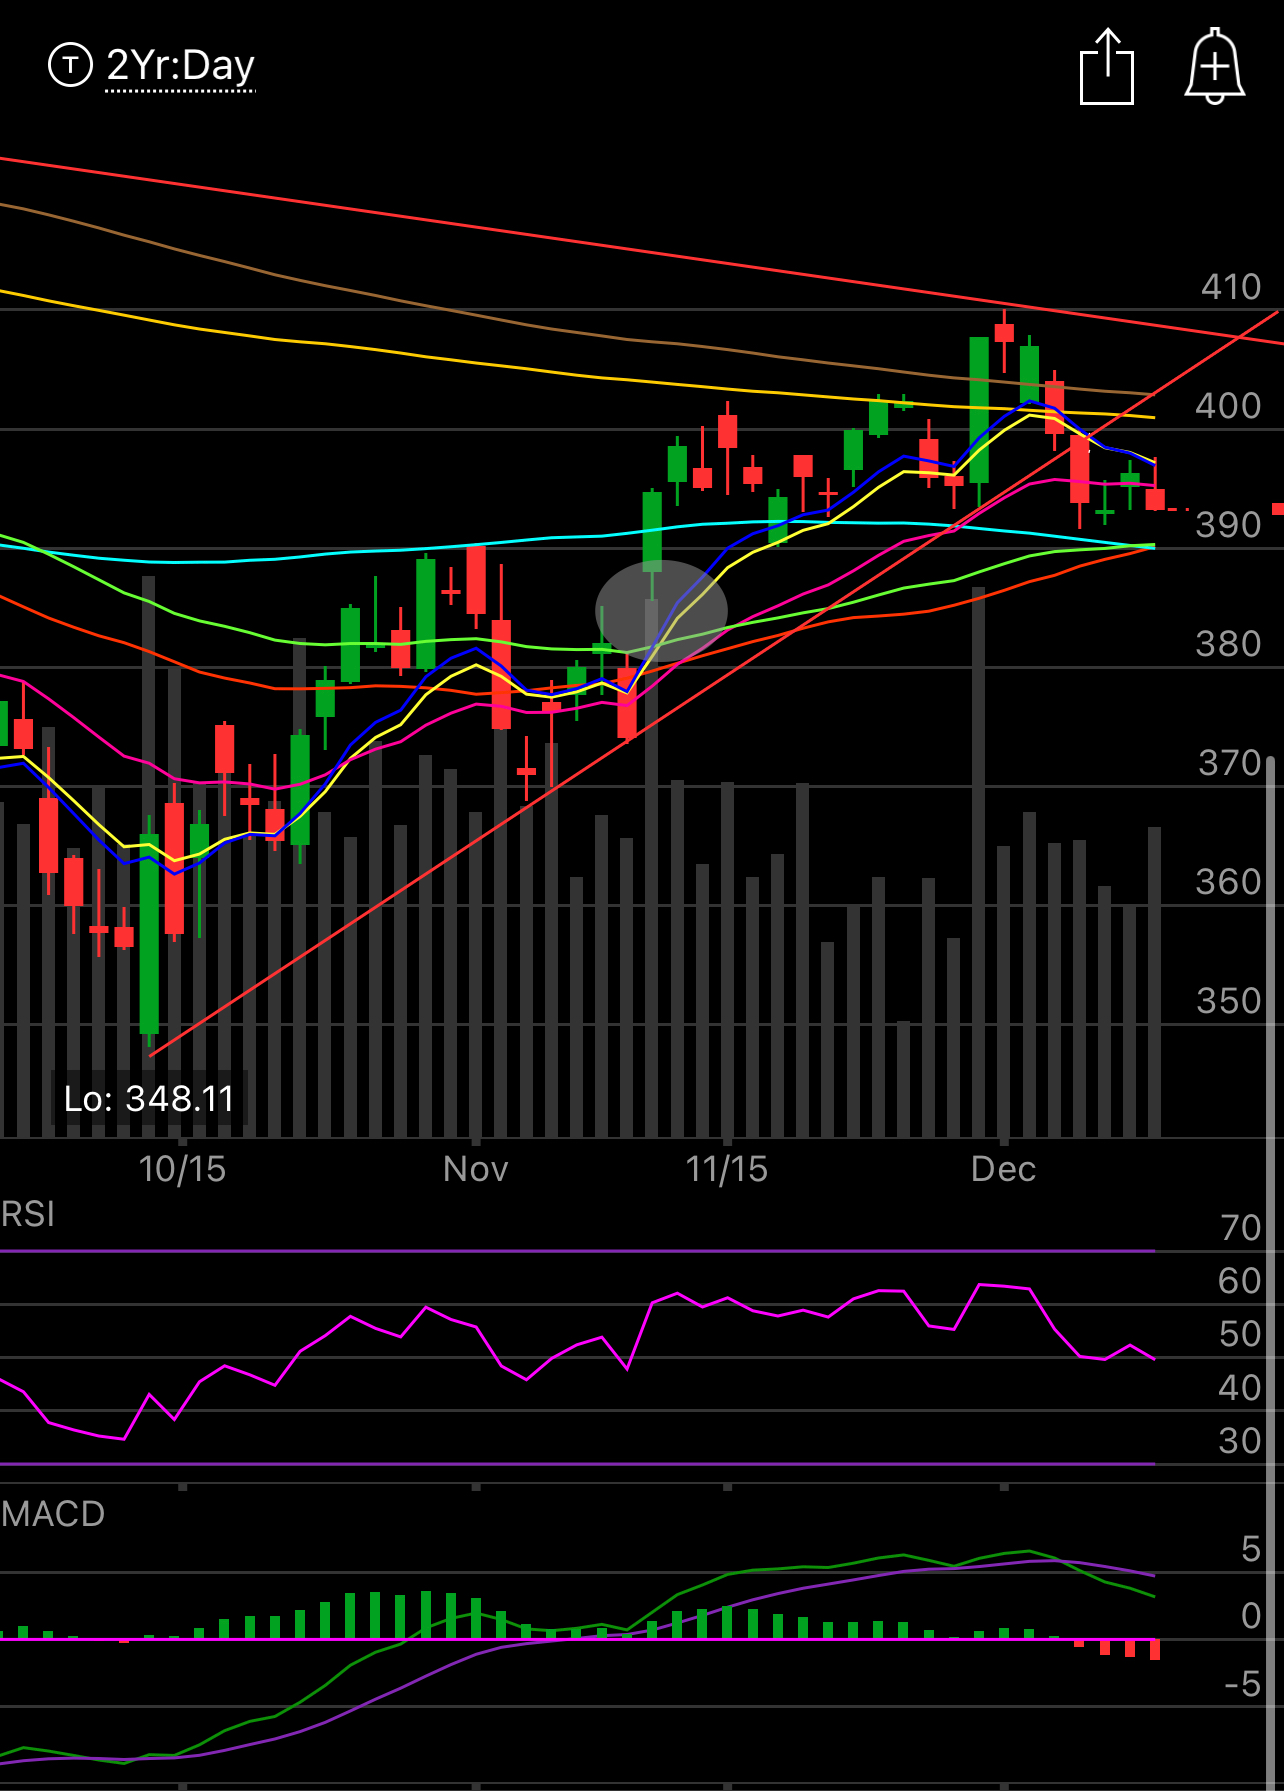
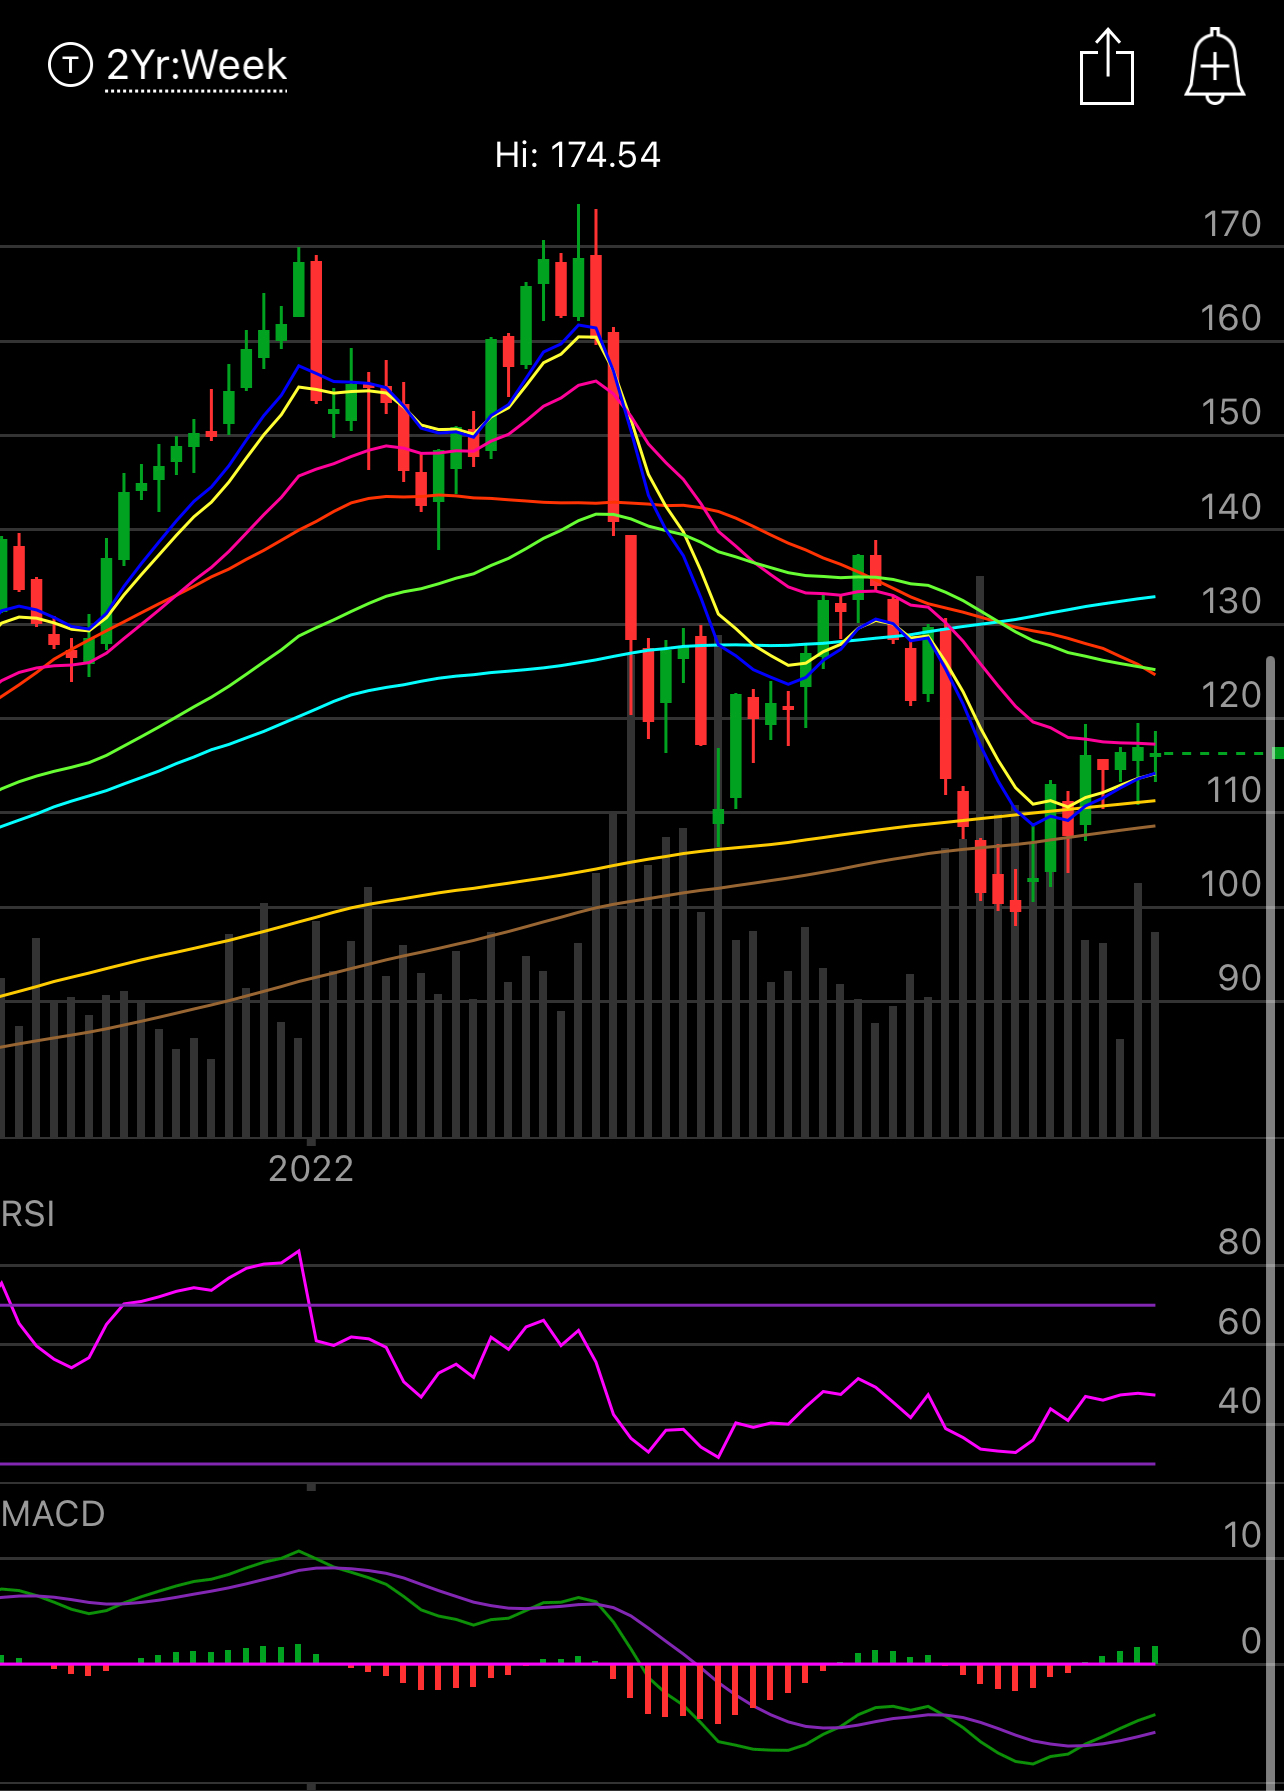
The uptrend in the SPY from October is clearly broken, there is no debating that. The SPY closed with an ugly inverted hammer candle on friday. The RSI is pointing down and the MACD is negative all signs telling you this isn’t where you are long. The downtrend above is somewhere around SPY 405, you basically are taking on all this risk of the Powell speech and CPI being great for maybe a 3% upside. The reason I say that is because until we close on the other side of that downtrend line on a weekly candle, the downtrend will continue to be a point of stiff resistance. Maybe tomorrow we get one more test higher, but for now, we are in this no man’s land over 390 and below the downtrend. CPI brought the worst day of the year in September, it’s just an event, in this environment, which is akin to earnings, whether you like it or not. I will be lightening up a few positions tomorrow, I’m not even long anything, just short puts, but some of the ones at risk potentially, I will be closing and freeing up margin to attack whatever comes our way AFTER Powell. That gap at 380 still is the first natural spot that I am looking for. Make no mistake, regardless of your bias, there is not a thing in the chart below that says it is to be bullish. Remember charts don’t lie, they just show you the movement of money.
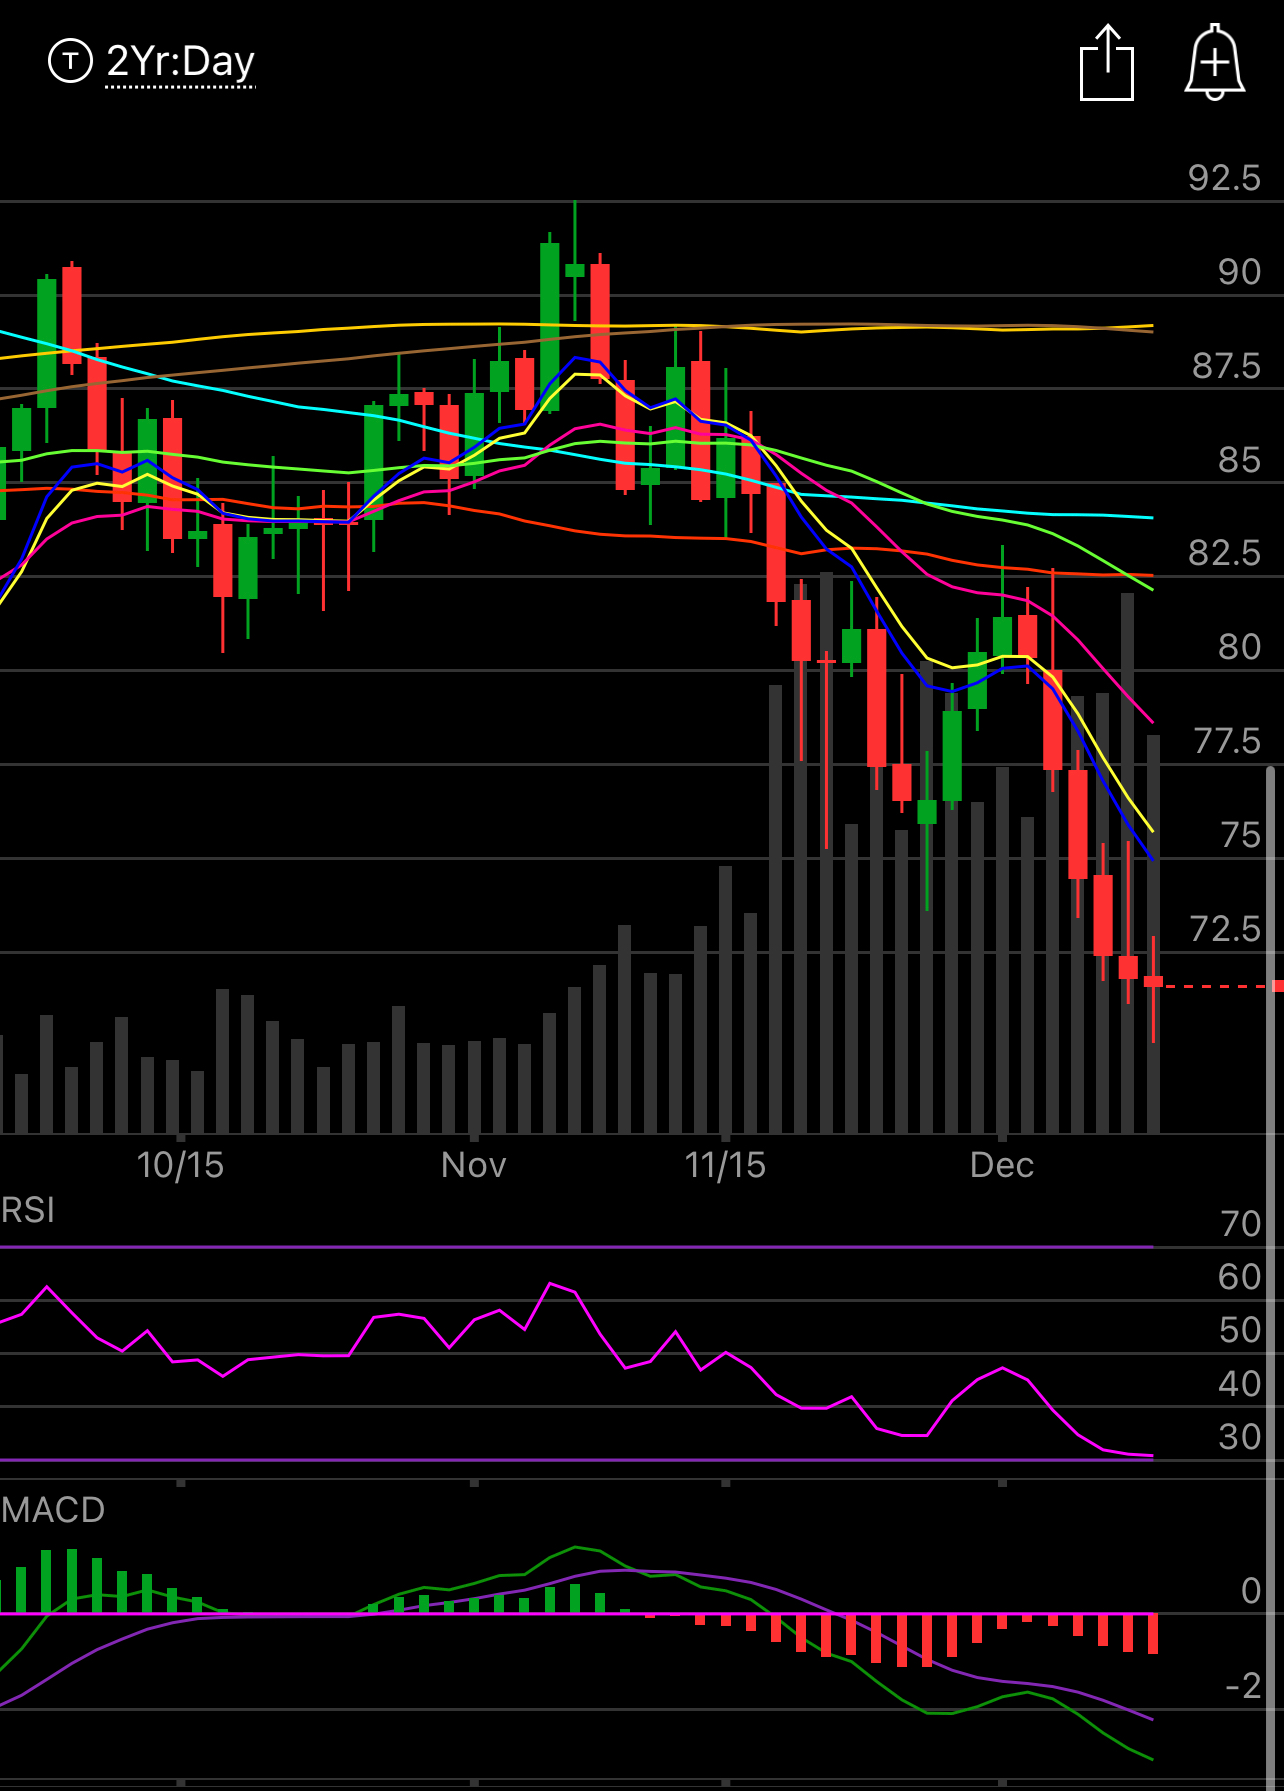
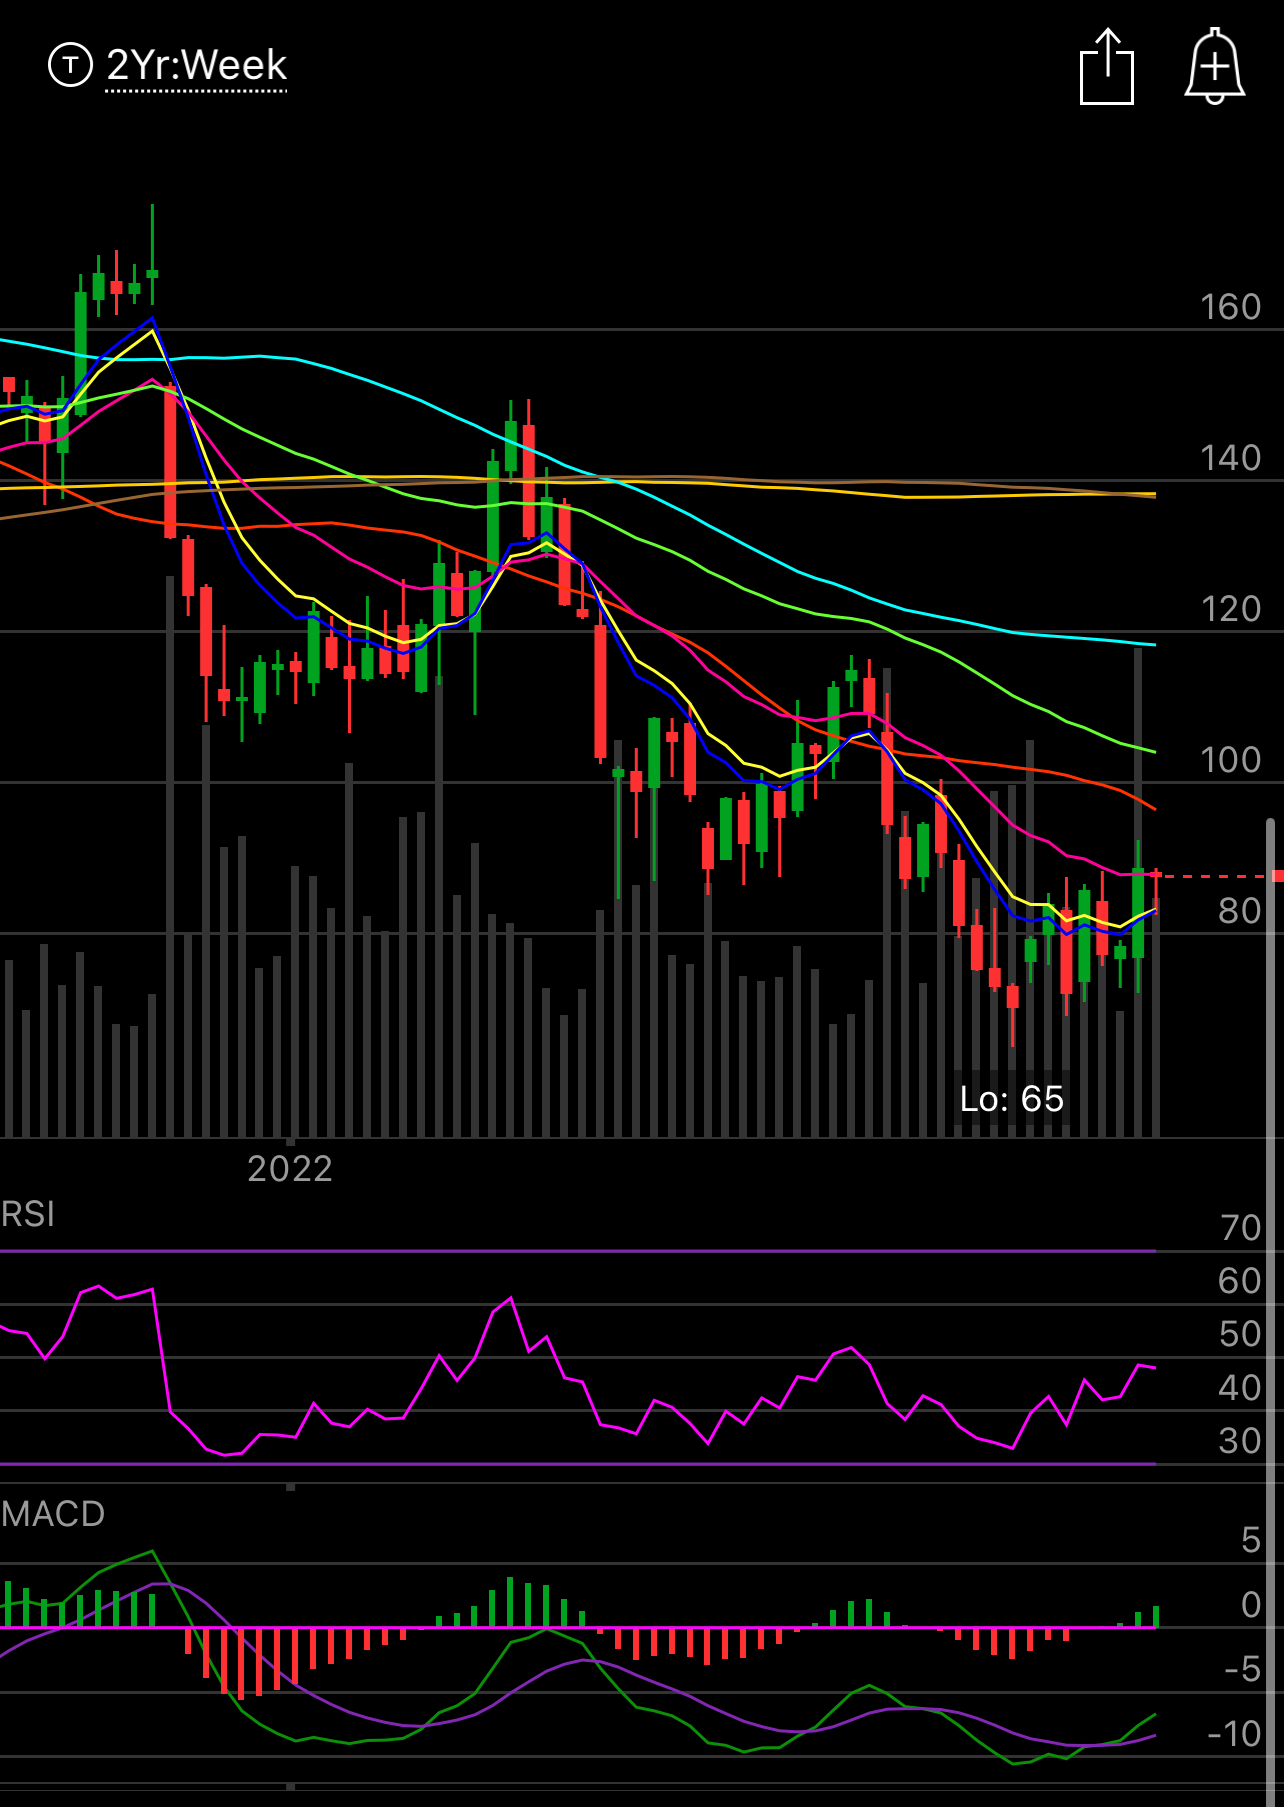
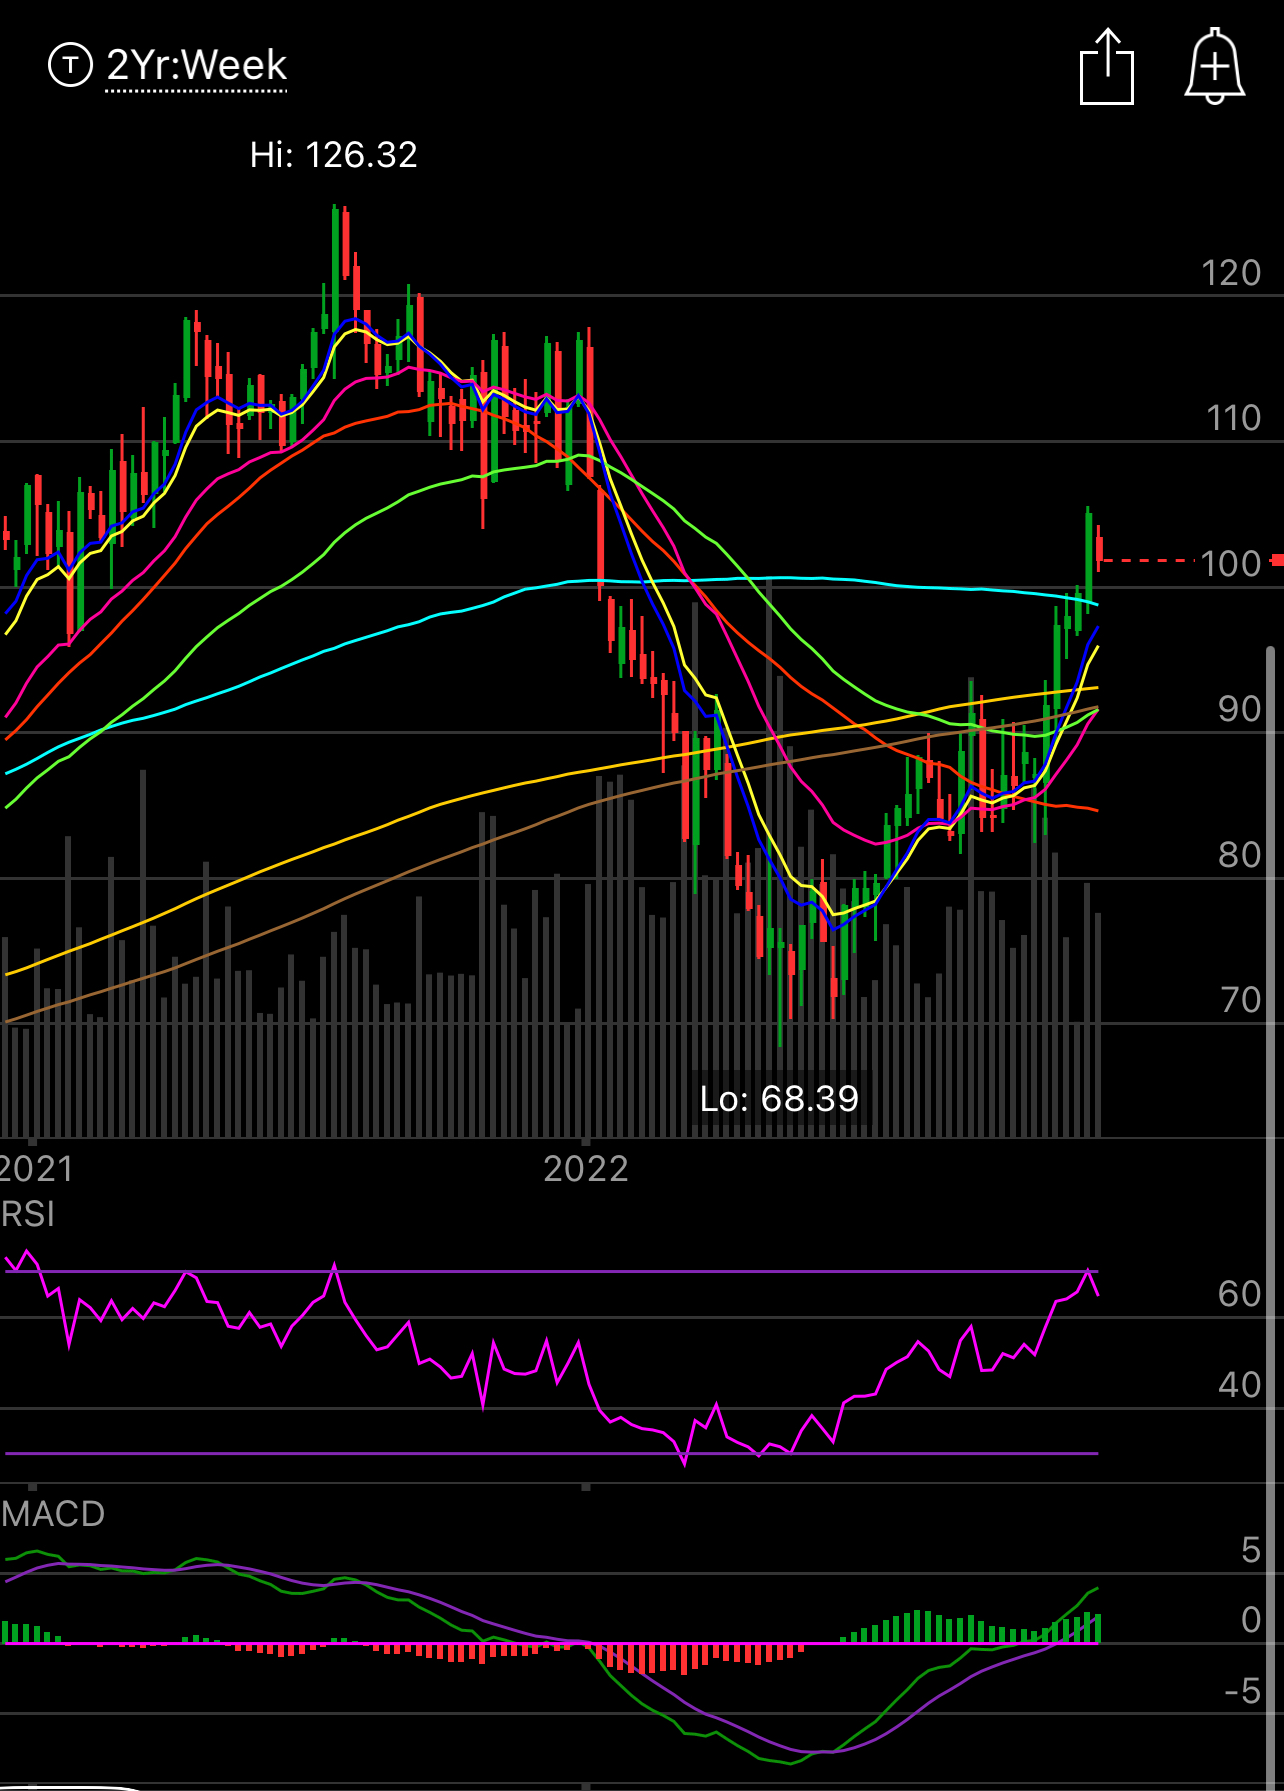
The oil chart is busted beyond belief. Look how far below all the moving averages this is now. Last week we got a bullish oil headline every single day and every single day we reversed lower. I still do believe we are in a multi year energy bull market, politicians globally have seriously underinvested for years due to ESG regulations and oil is still very much necessary for everything basically, but the chart is the chart, and until this turns around and reclaims a few moving averages, why try to be a hero? Every algo on earth is going to be on the otherside selling what you’re buying till then. The RSI is at max oversold levels, so a bottom should be near, but bottoming is a multi day/week process.
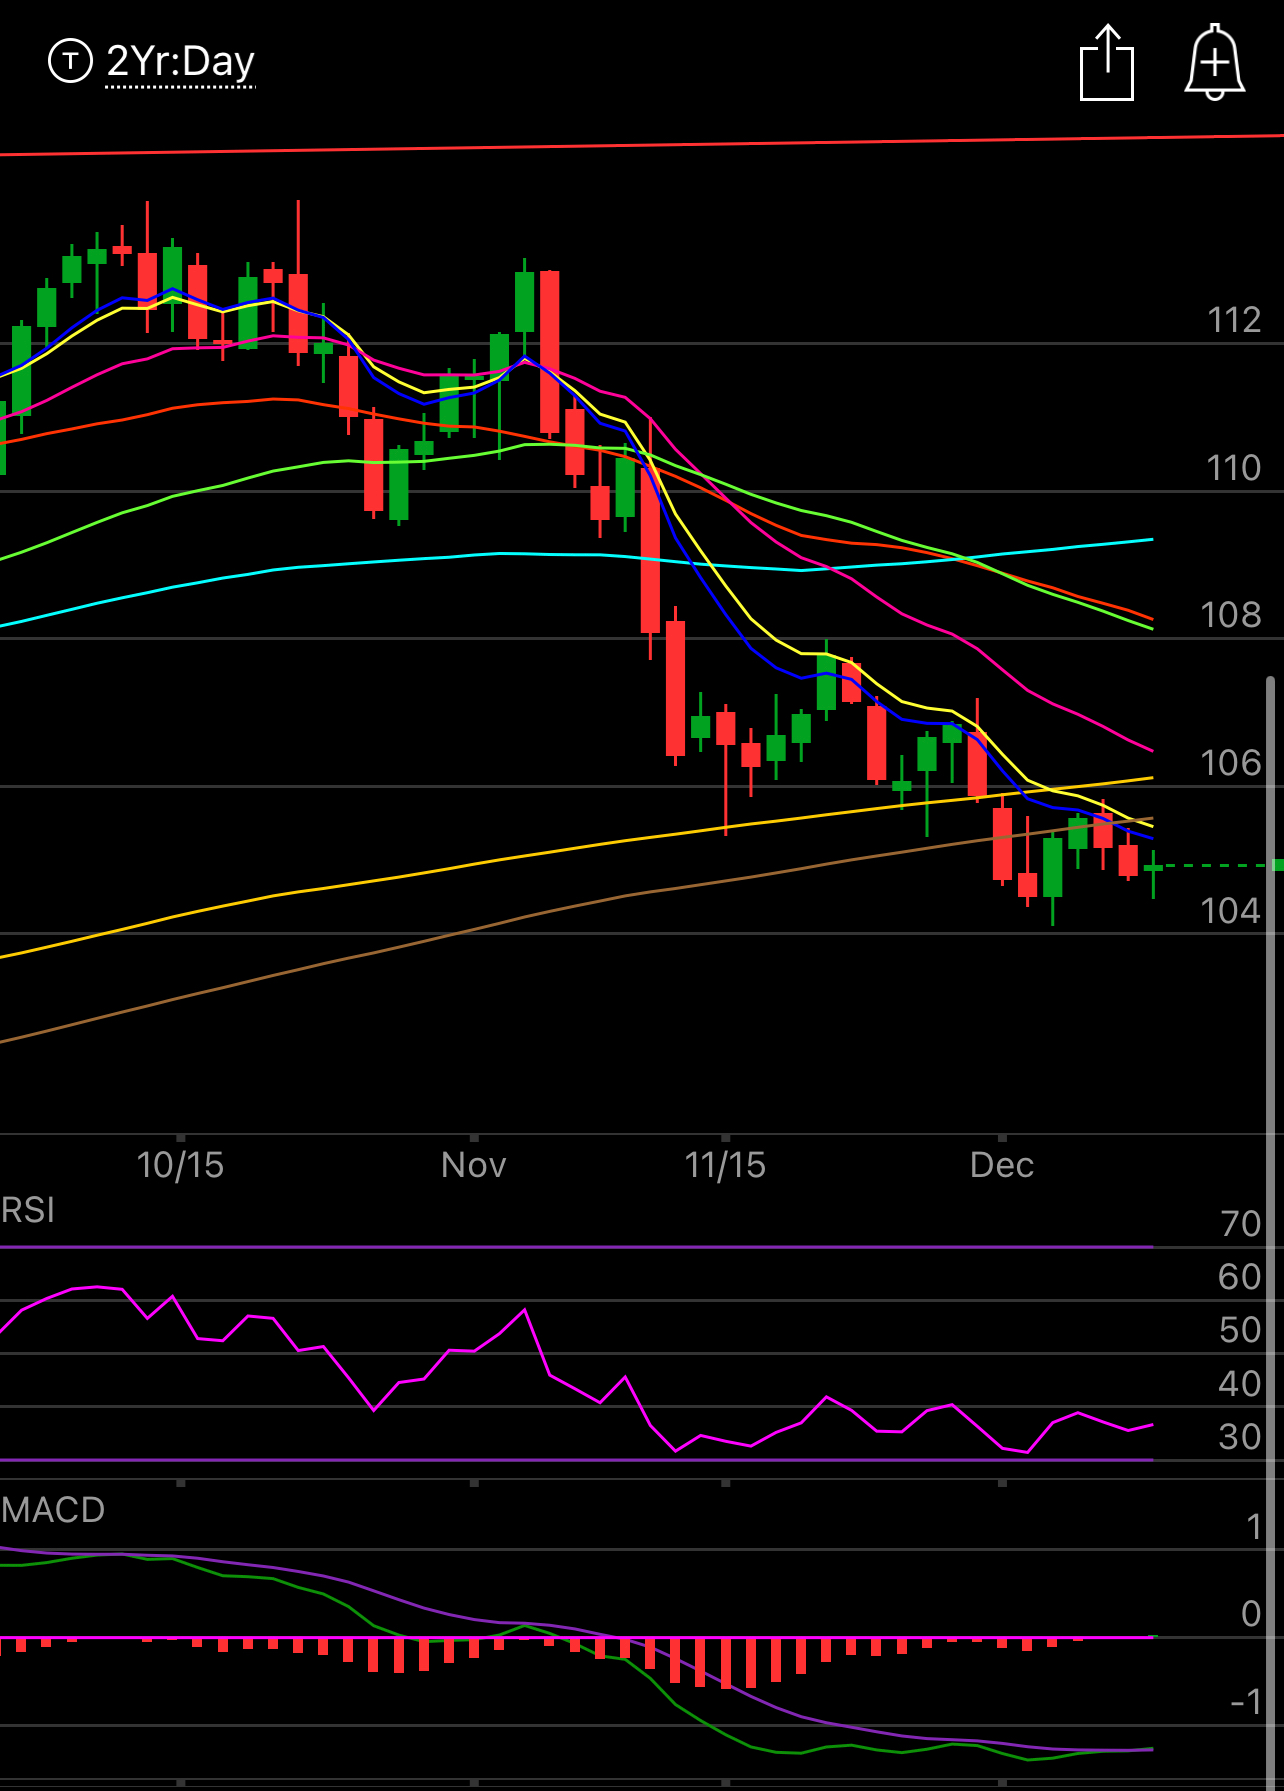
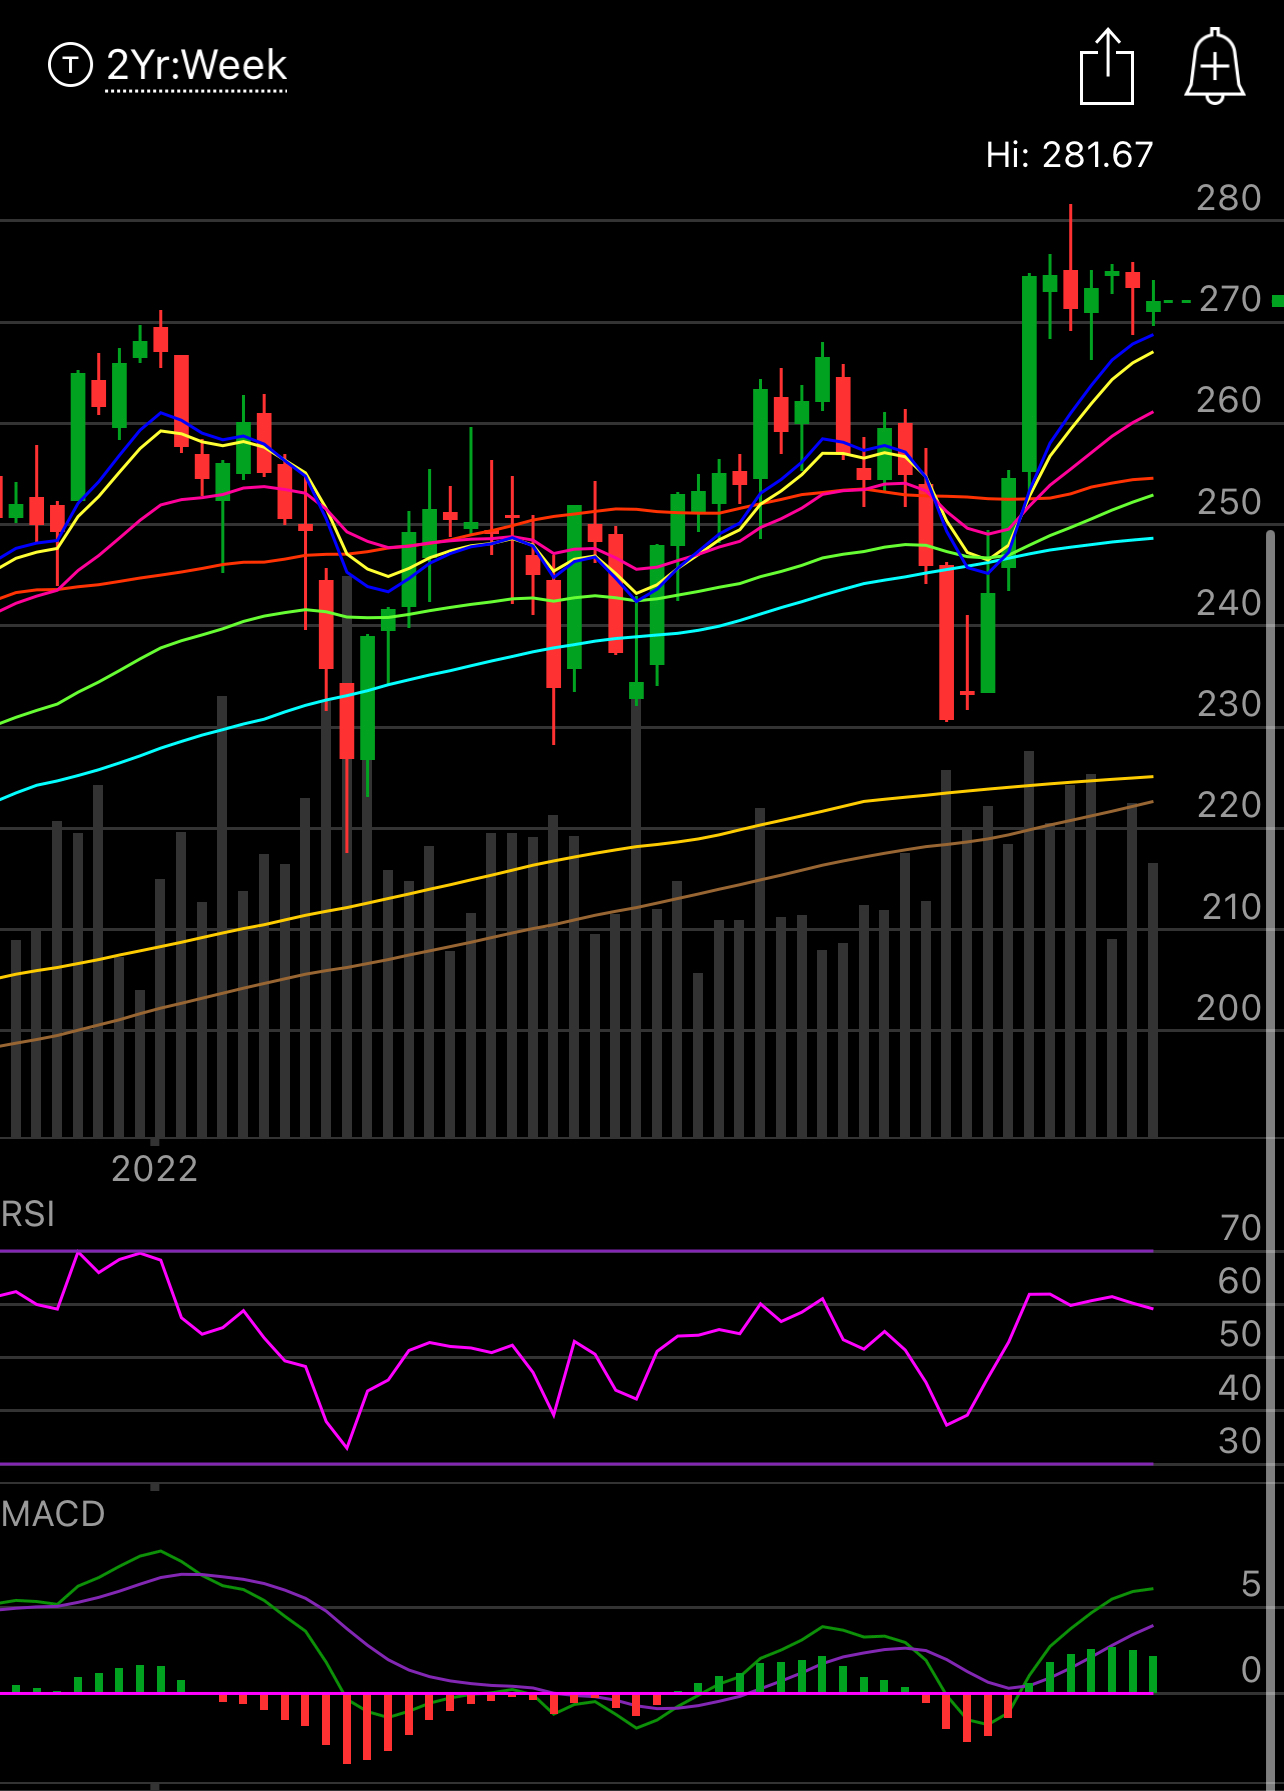
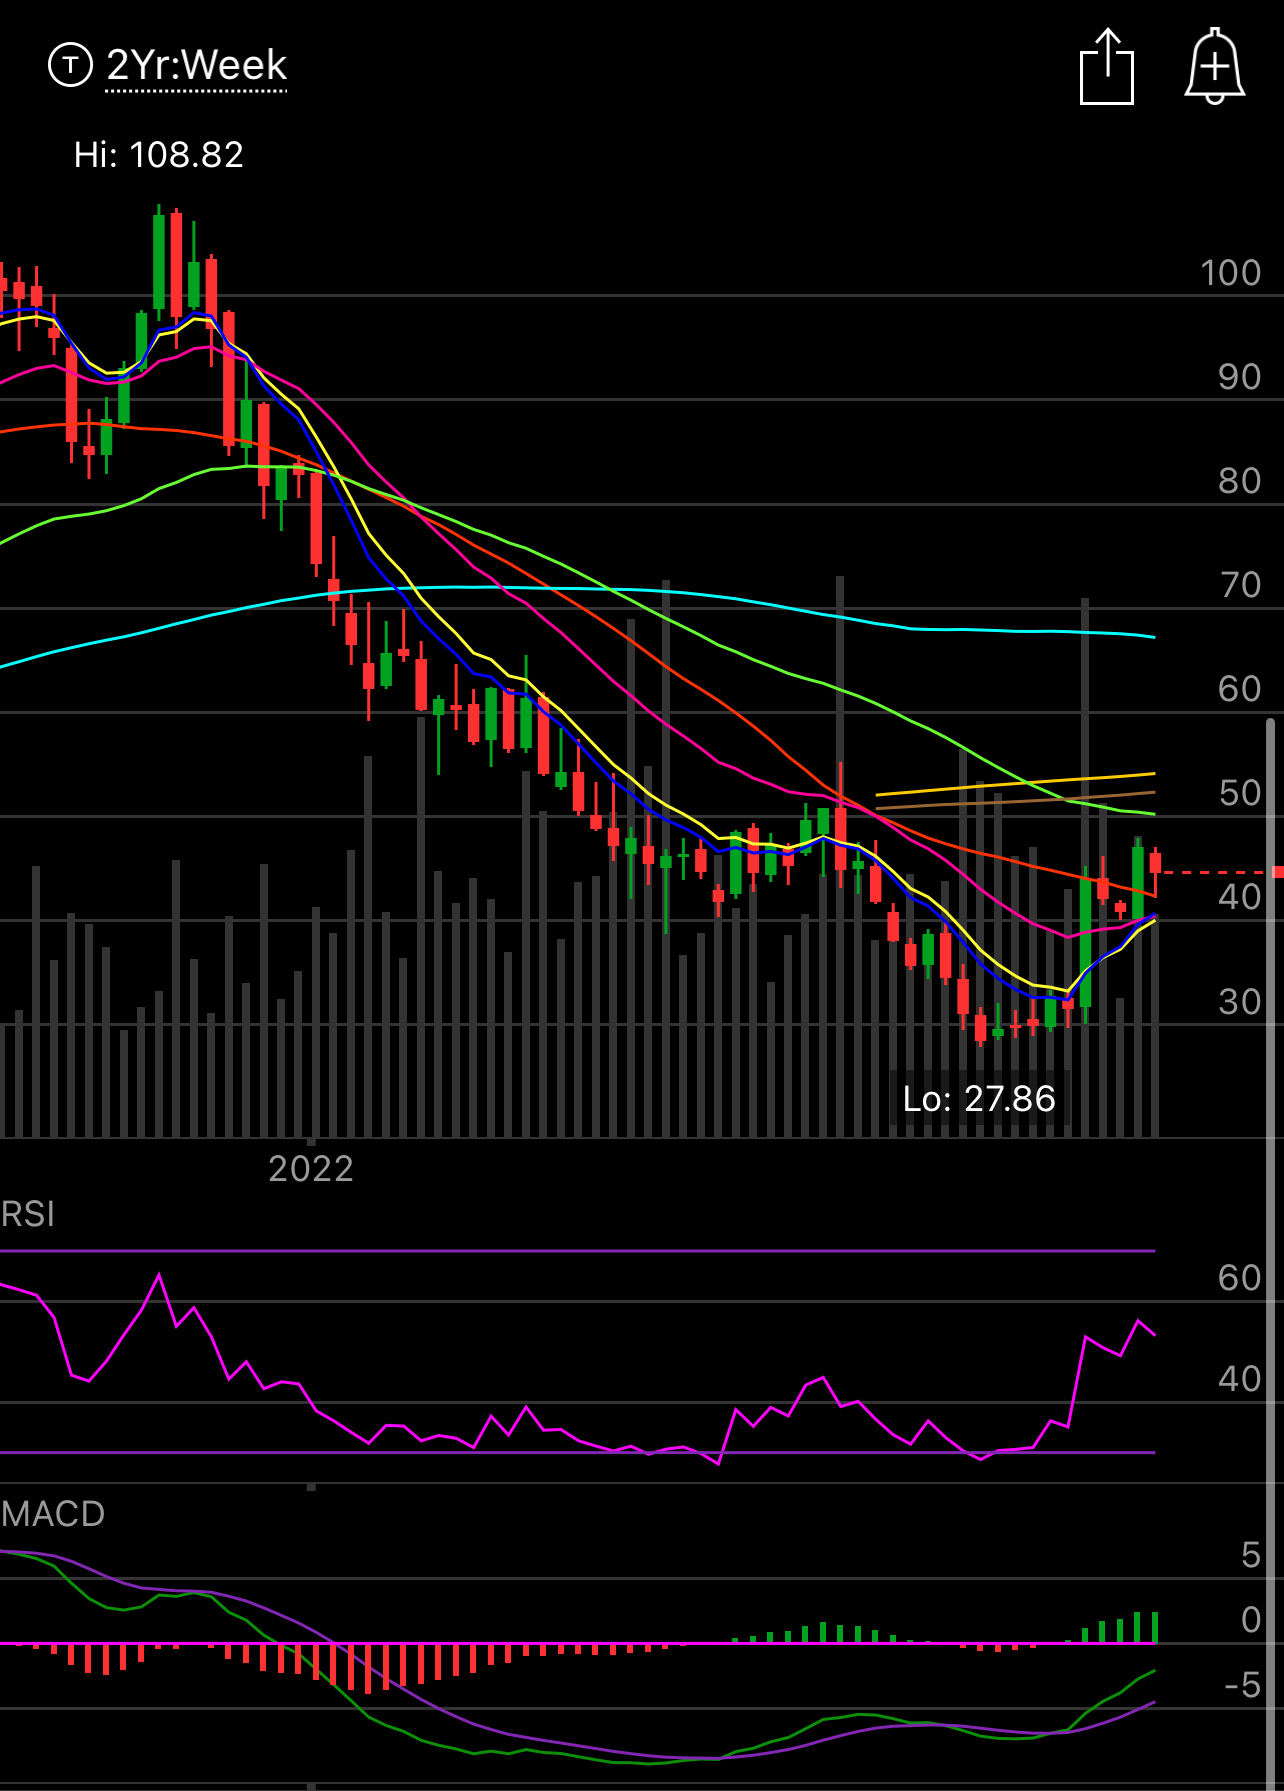
The dollar is a good example of what I meant above for oil, look how many days flat/down the dollar has gone through recently. You will note the bullish divergence in the dollar on the MACD, its about to flip green, maybe tomorrow or tuesday, once the dollar reclaims the 200 DMA and the 8/10 EMA it will be quite bullish which lines up with that bearish SPY chart, a strengthening dollar isn’t bullish for equities. The RSI on the dollar is looking quite bullish, pointing up, as well. UUP is a great symbol if you’d like to go long the dollar as a trade. Remember people rush to dollars when there is uncertainty, which Powell will almost certainly try to create.
My Best Idea For This Week
I really did not even want to post one, I just don’t like where this market is from a value standpoint along with a chart standpoint. We’ve had an incredible 2 months and not everyday has to be time to buy stocks. With that said, I will a nice setup I see that should do well regardless of market conditions.
SPLUNK
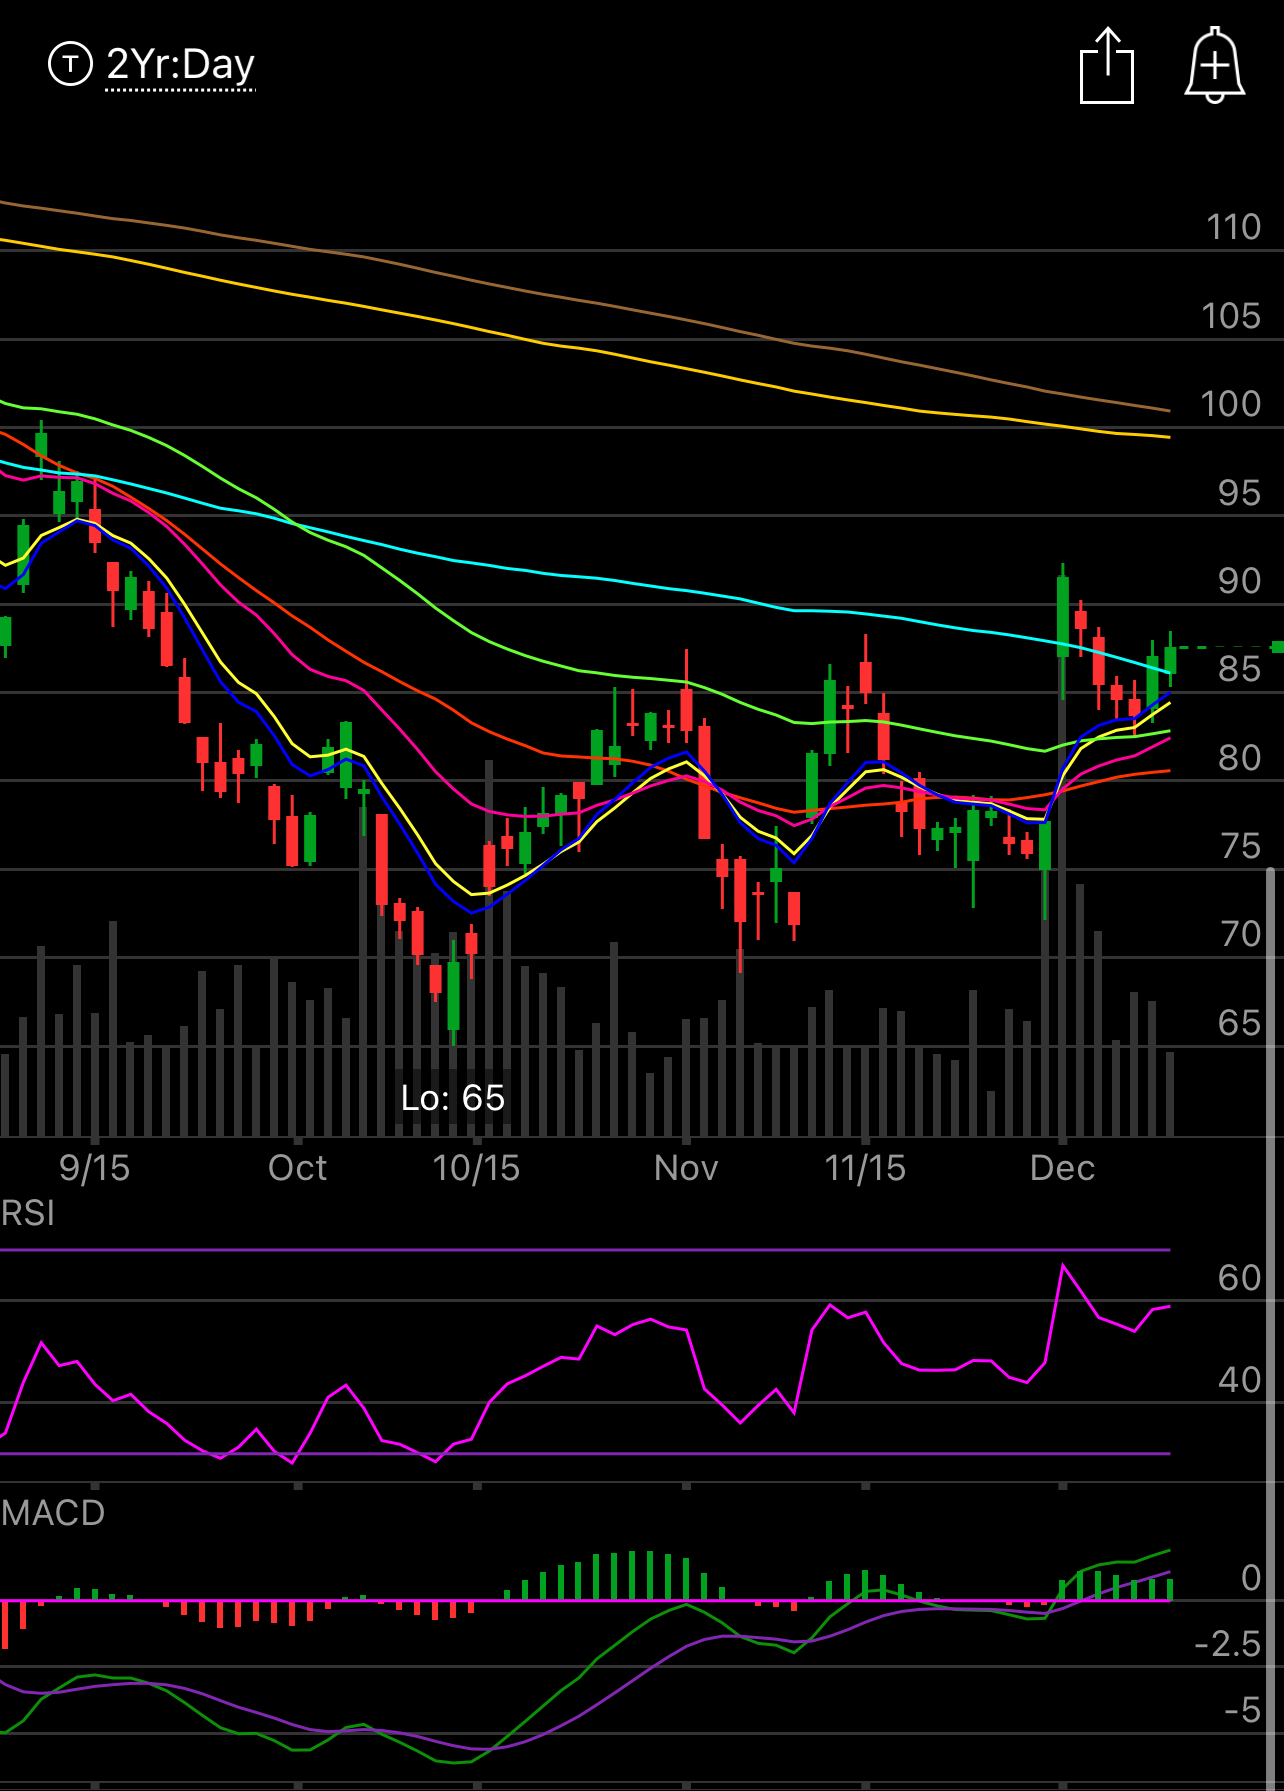
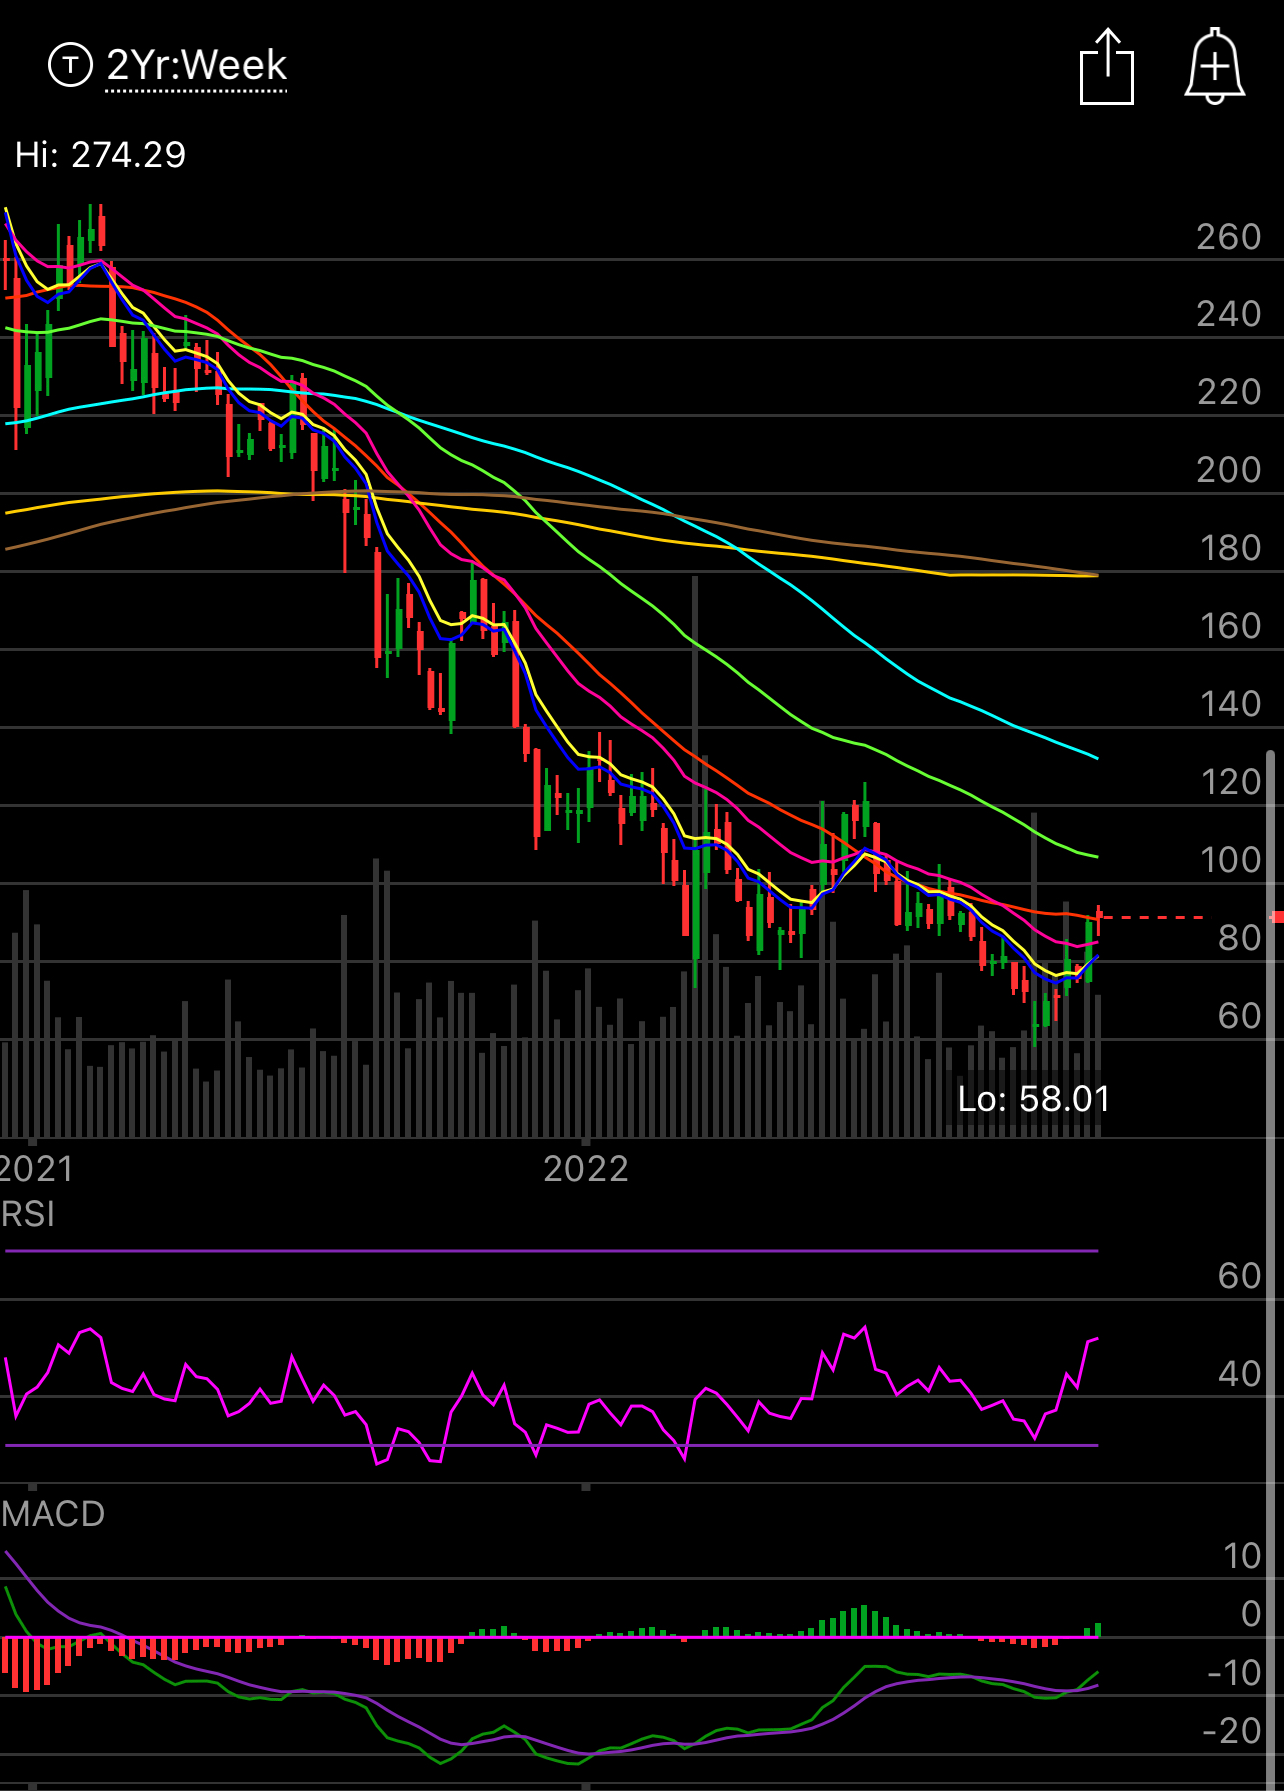
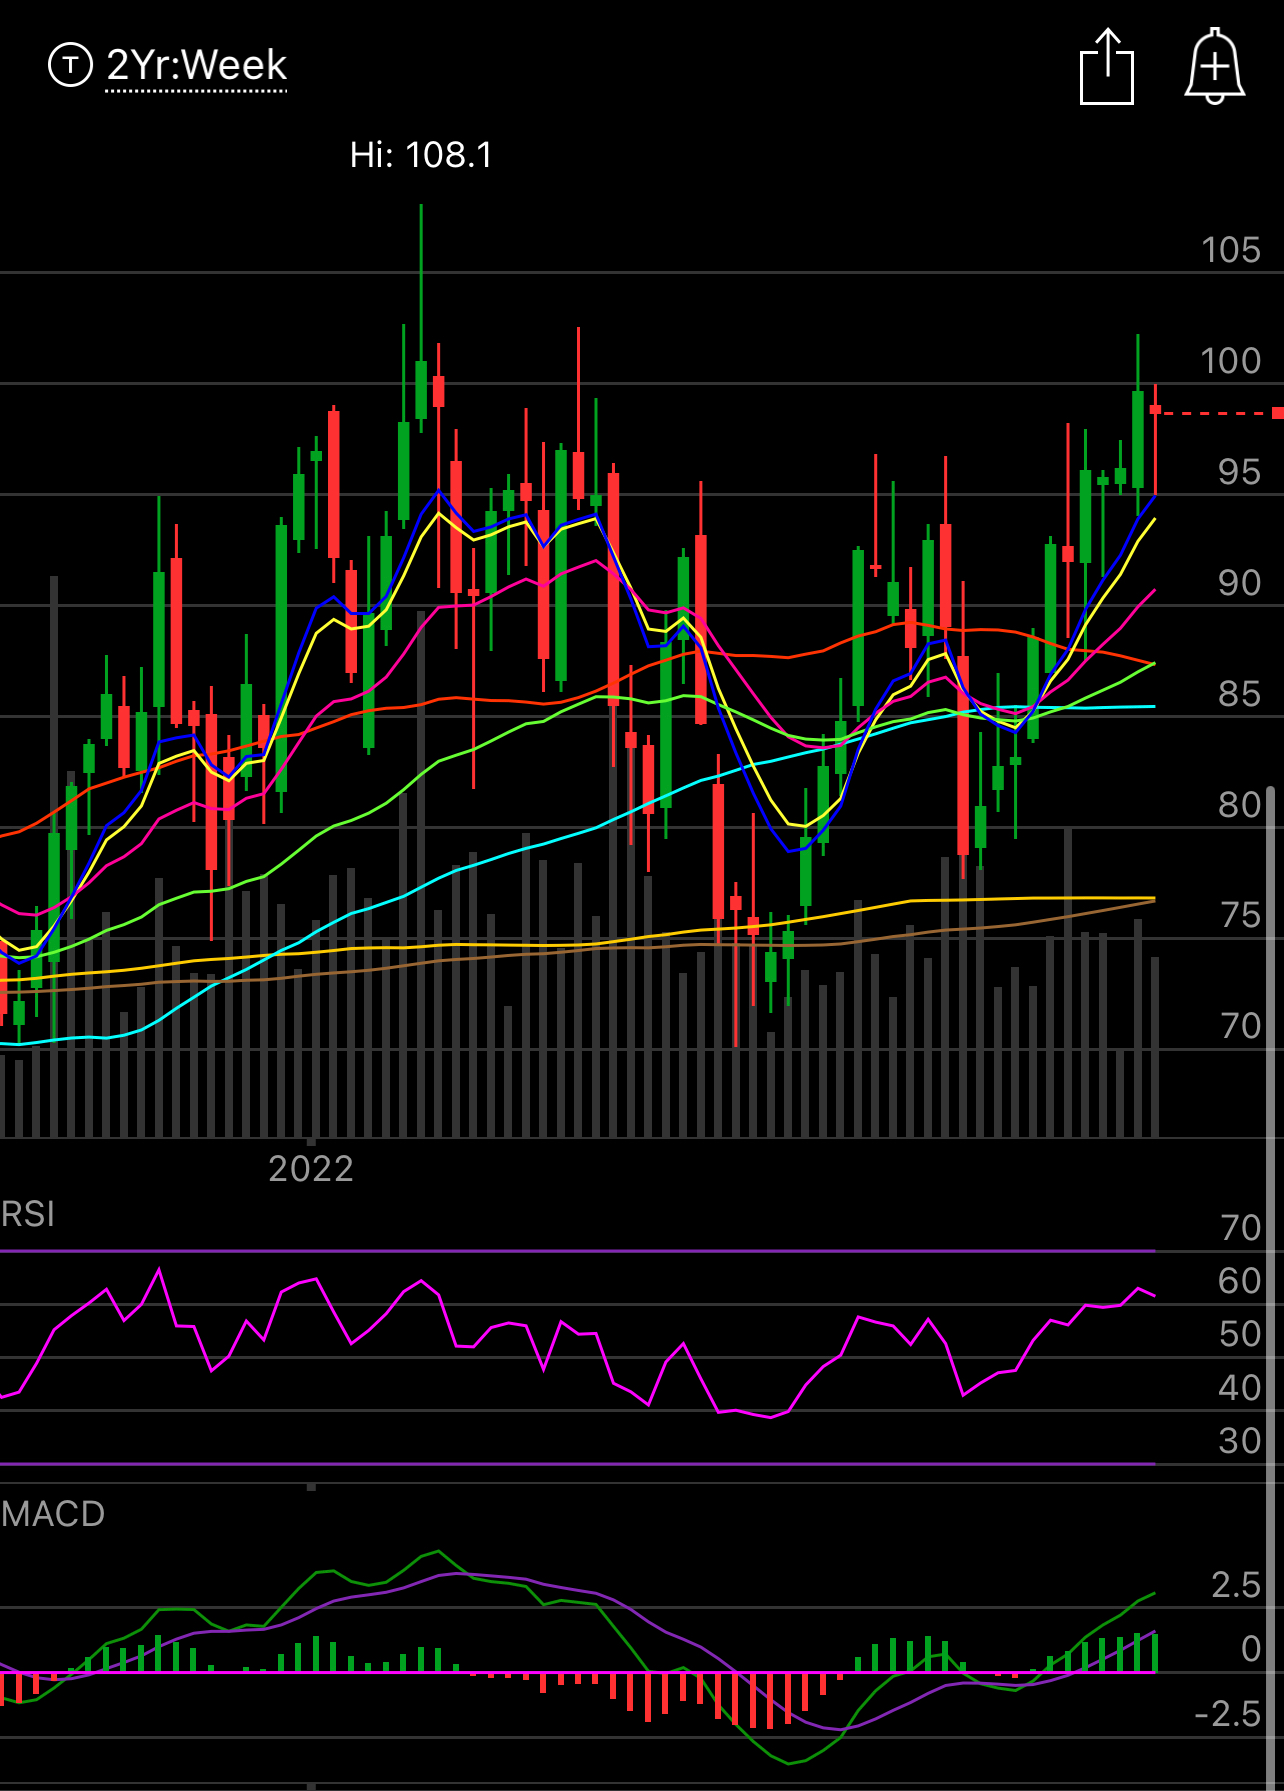
So I’ve noted this name for the last few months. Ever since Starboard took their activist stake here, it has performed quite well, even the last 2 days in the weak market it posted green candles. The relative strength is there. You can see the RSI with a series of higher highs, this is what a bullish chart looks like. That gap below does concern me and I would only focus on selling puts below it. It is around $77.
The weekly did not put in the best candle last week but you can see the RSI closing at multi week highs, the strength is there and beginning to unfold and why not, they just reported an amazing quarter. You know I’m a believer in the concept of post earnings drift and aside from the activist involvement Splunk had a remarkable Q, they posted:
40% yoy revenue growth
Guided up on Revenue,Free Cash Flow, and Profits
The option flows in Splunk have been particularly bullish, but 2 trades caught my eye this week as they were looking for a buyout in February using a complex option setup called a backspread where you sell 1 shorter call to finance the purchase of 2 longer calls to put on a cheaper trade that explodes in your favor on a sharp move higher.
12/09 a backspread was put on in Feb 95/105 call spreads, they sold 1300 95 calls to buy 2600 105 calls.
12/08 a backspread was put on in Feb 95/105 call spreads, they sold 750 95 calls to buy 1500 105 calls.
Now what is a backspread? I will link below for a more detailed explanation
Basically if SPLK moves over 105 or is bought out for over 105 in the next 3 months, that trade will pay out a fortune. At the moment the 95’s are $5.30 and the 105’s are $2.65 so by selling 1 $95 and buying 2 105’s you’re nearly putting on that trade for free. If you’re wrong, you’re not out much, but if you’re right, its a huge win because you have twice as many calls long as you do short. Like I said this isn’t a trade put on by a novice at home, so I made sure to note it. You can see all the volume friday and Splunk doesn’t see much, ever.
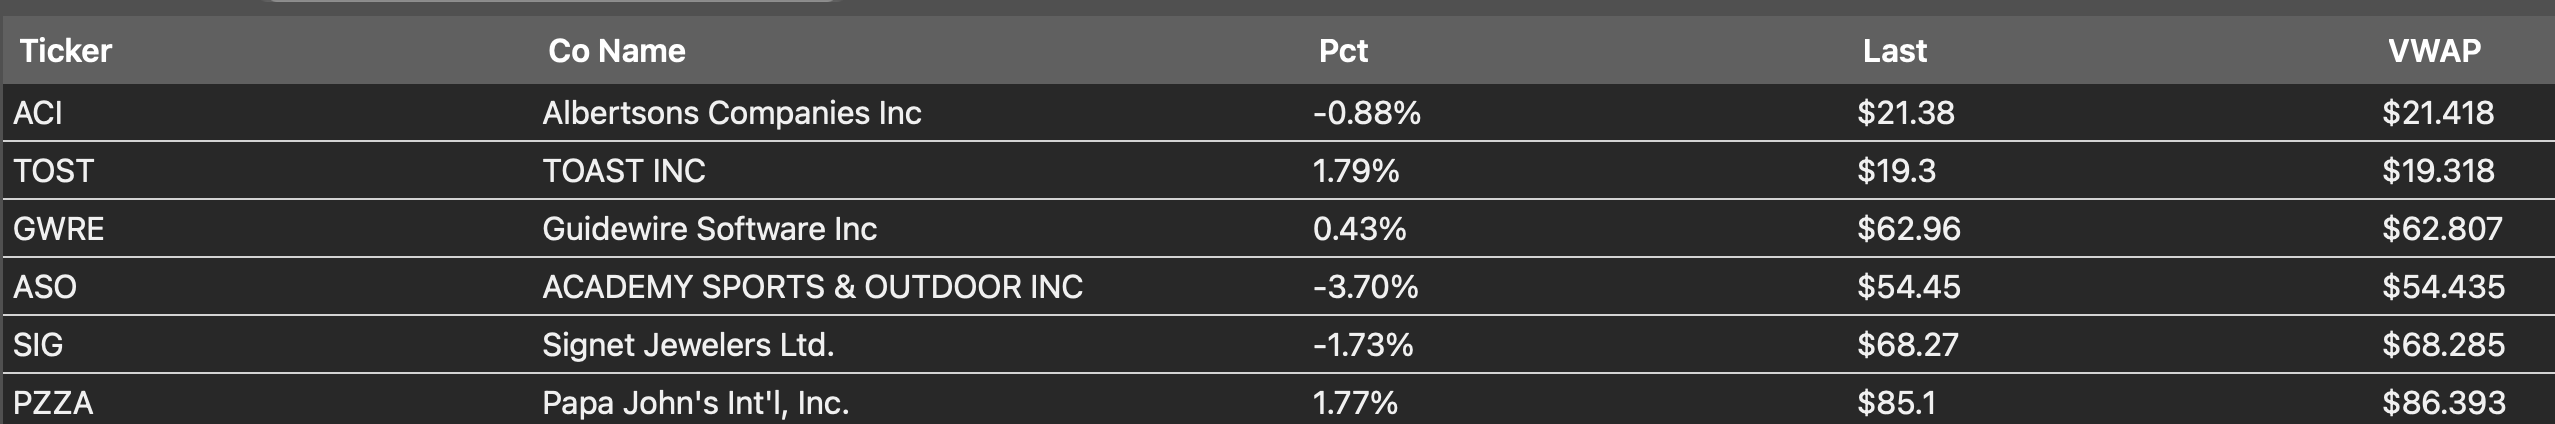
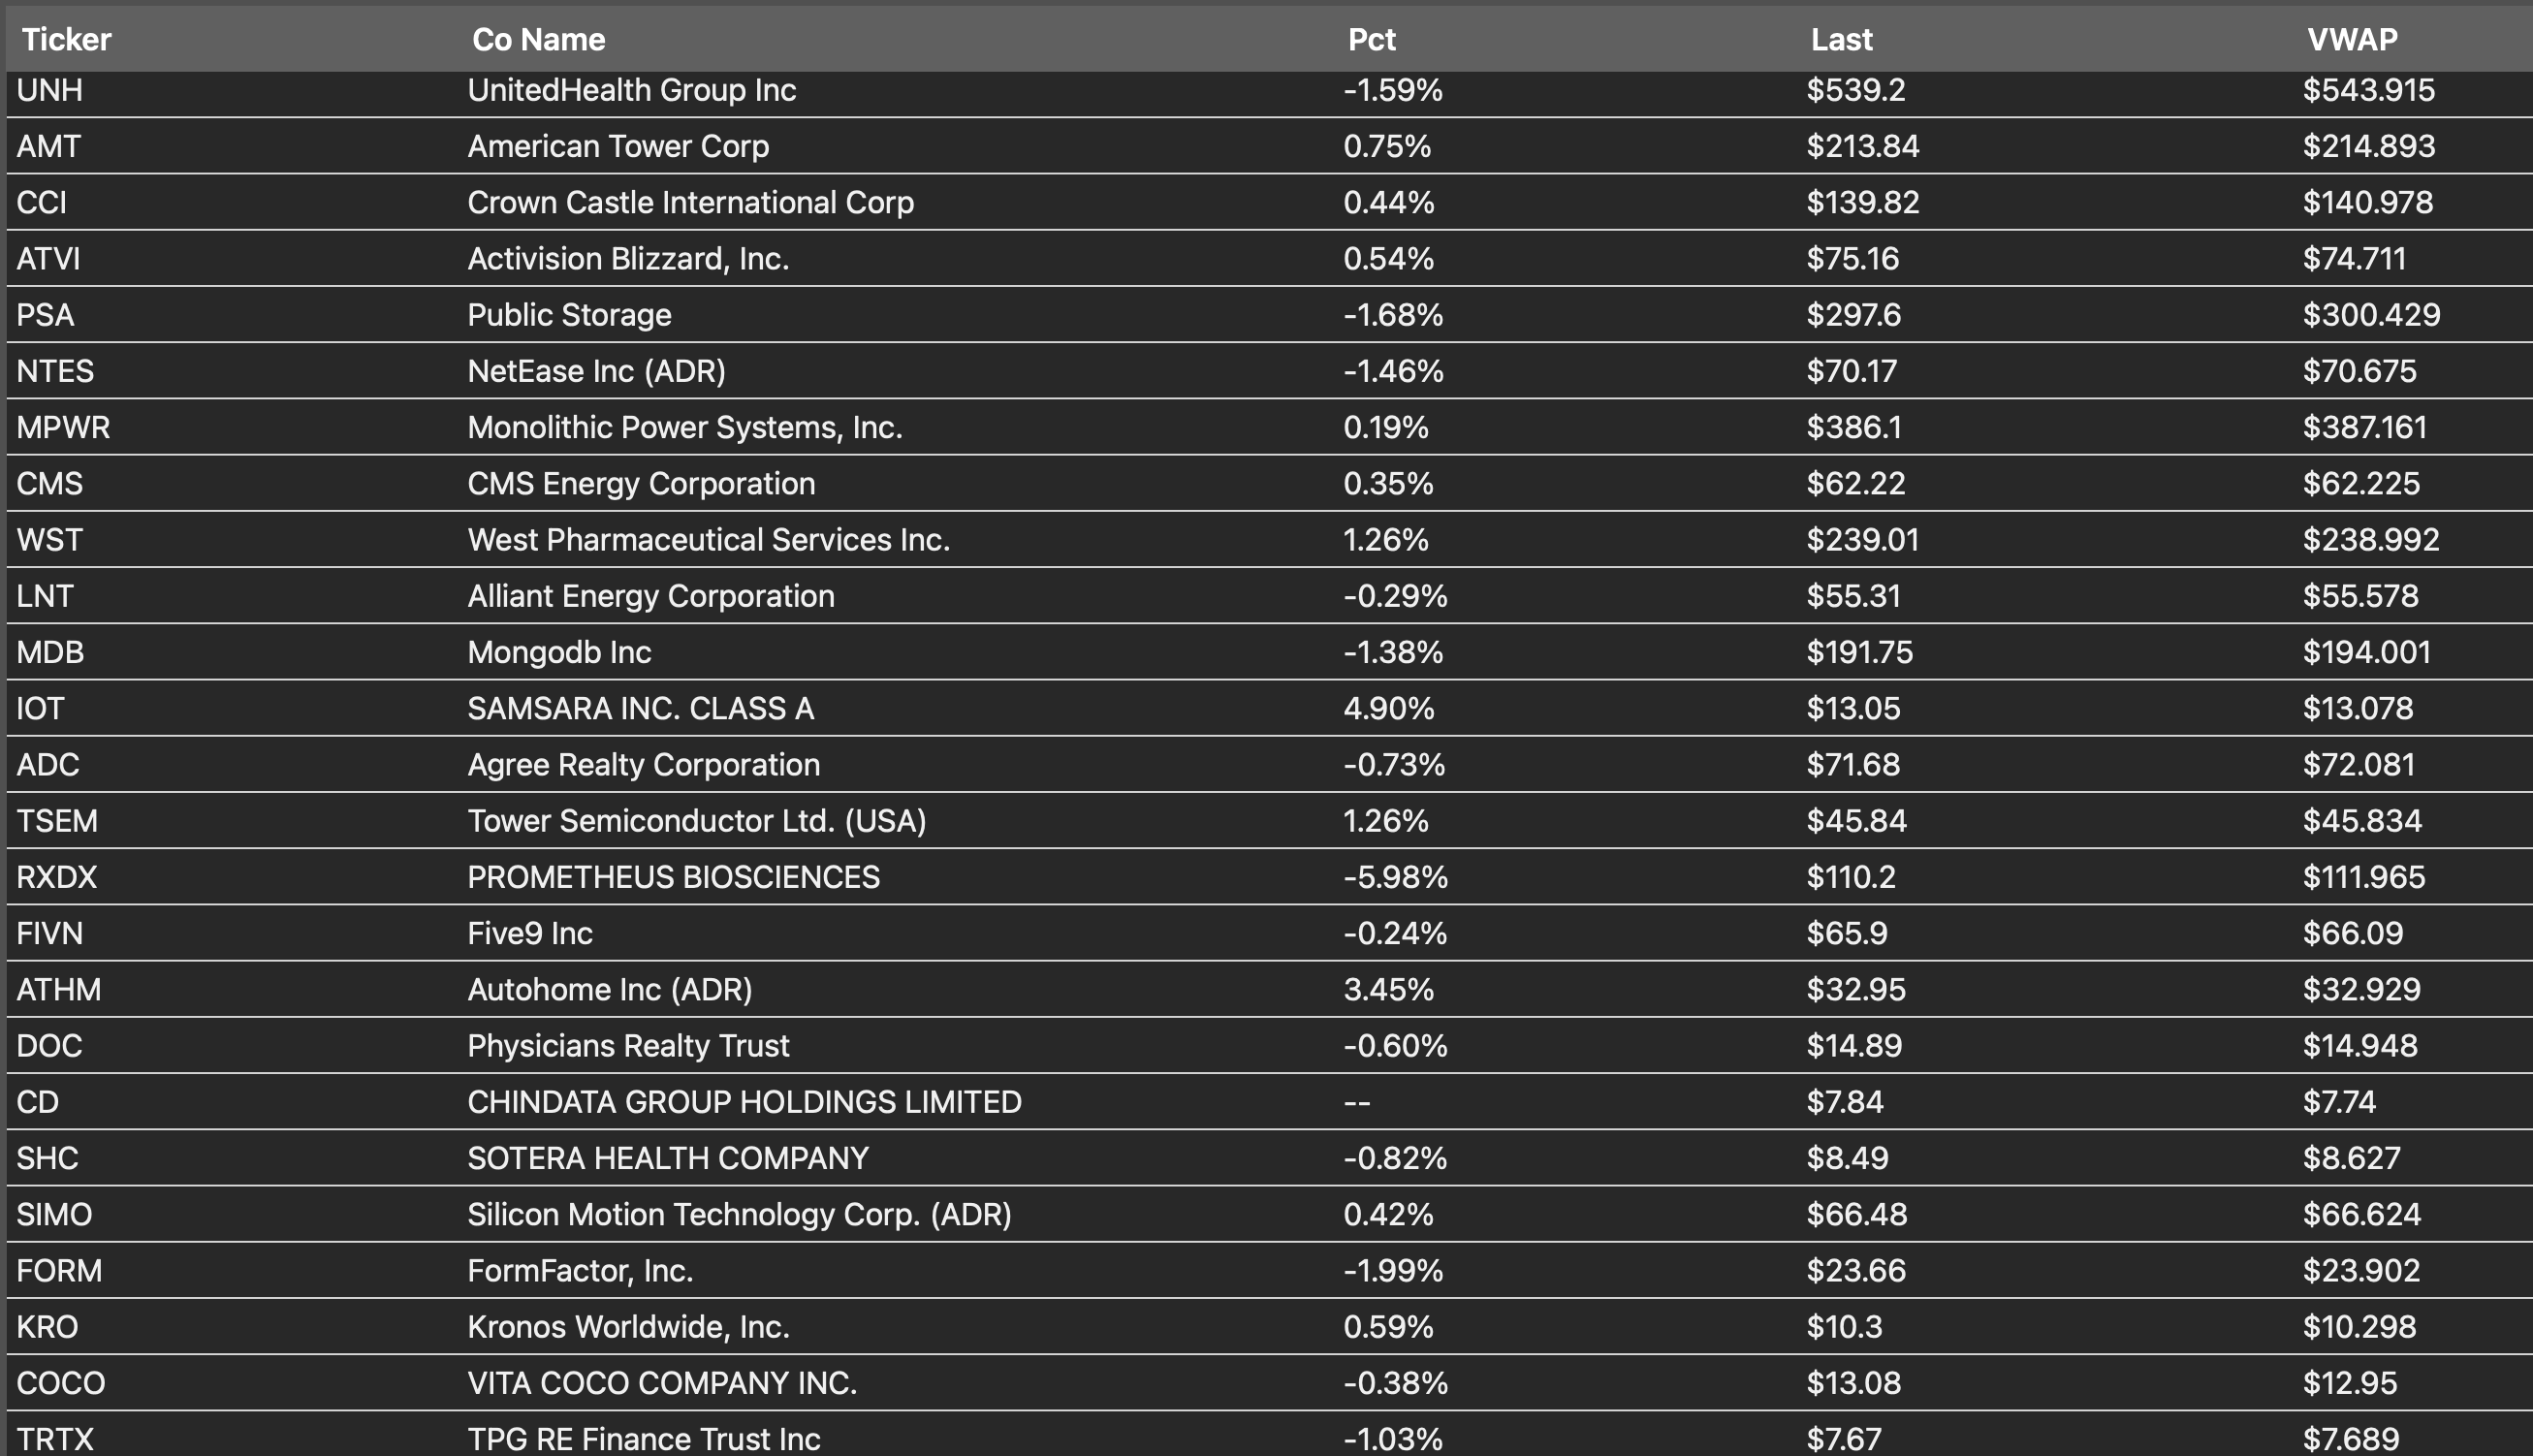
Charts That Interest Me For Put Selling
I always try to find names that look like a strong setup to sell premium into and here are the names that caught my eye for this week, I’m not sure if I will do much with them just because of all the events this week but nonetheless, here are some names for you to put atop your watchlist for the time being.
MCD
BABA
NKE
SBUX
YETI
H
PLD
Some Chart Scans For Your Consideration
Weekly Bullish Engulfing Candles - there weren’t many last week
Weekly Bullish MACD Cross
All I want to say in closing is I’m not bearish or bullish, I’m open minded to whatever develops in the charts. At the current moment we continue to trade below that year long downtrend, give me one close on the other side of that downtrend and I will be bullish, we all know the stock market is not the economy. The people who constantly try to lump the 2 together amuse me. We were shutdown as a country during covid and stocks kept rallying everyday. The economy can be terrible and stocks can go up, the two aren’t correlated as people like to believe. Powell would like to see stocks lower because it makes his life easier in terms of controlling inflation via a reverse wealth effect. Other than that, we can breakout and go to new highs and it not make sense but the only way that happens is a break above the trend, which is just 3% higher, so my question to you is simple, would you risk money for a 3% upside and 10%+ downside or would you rather wait for a confirmation of a bullish continuation first? Me personally, I would rather wait and make sure this move is real before I commit to being long things. All my current positions are short puts at much lower levels and I’m 100% cash. So I’m not bearish with that, just saying I’d like to be long these names at these lower prices, that’s all.
As always I will post all my positioning tomorrow in the monday recap but with CPI tuesday just make sure you lighten up what you want tomorrow just in case the next 2 days don’t go well. If I’m wrong and stocks want to rip to new highs, we will know within the next 3% of the markets upside. So it’s not like if stocks go up they’re just going to fly away in 1 week. Hence my stance on the risk/reward not being there for the moment.