12/19 Recap. The Selloff Continues.
Another horrible day in the markets as all the technicals rollover. We are in a horrible position going into year end. So many names are breaking to new 52 week lows daily, there is absolutely nothing to be bullish about for the moment. Just be patient, the RSI is nearing oversold levels on the daily on the SPY and that is where you can slowly begin to poke at some longs. I will show go over all my positions as I do every monday at the end and you can see what new stuff I added, but overall the sell off I’ve been looking for continues to play out.
The SPY daily shows an RSI below 40 nearing that oversold level of 30. That was very quick, 5 horrific days in a row will do that. The problem now is with all the moving averages sloping down, every rally will be sold. This is going to take some time to untangle. The gap is now filled and the next natural spot would be the white box below as a demand zone for us to potentially bottom.
The dollar is now working on it’s 3rd straight week of basing. This isn’t good for equities. The dollar looks like it wants to pop higher and soon. It does have a good bit of resistance above and that may help, but look where equities are right now with a weak dollar, imagine if this strengthened?
Oil also now has a green MACD and is trying to find it’s footing. It should base somewhere around here, I don’t see much lower than that 70 and it finally reclaimed the 8/10 ema today. Semi bullish oil for the moment.
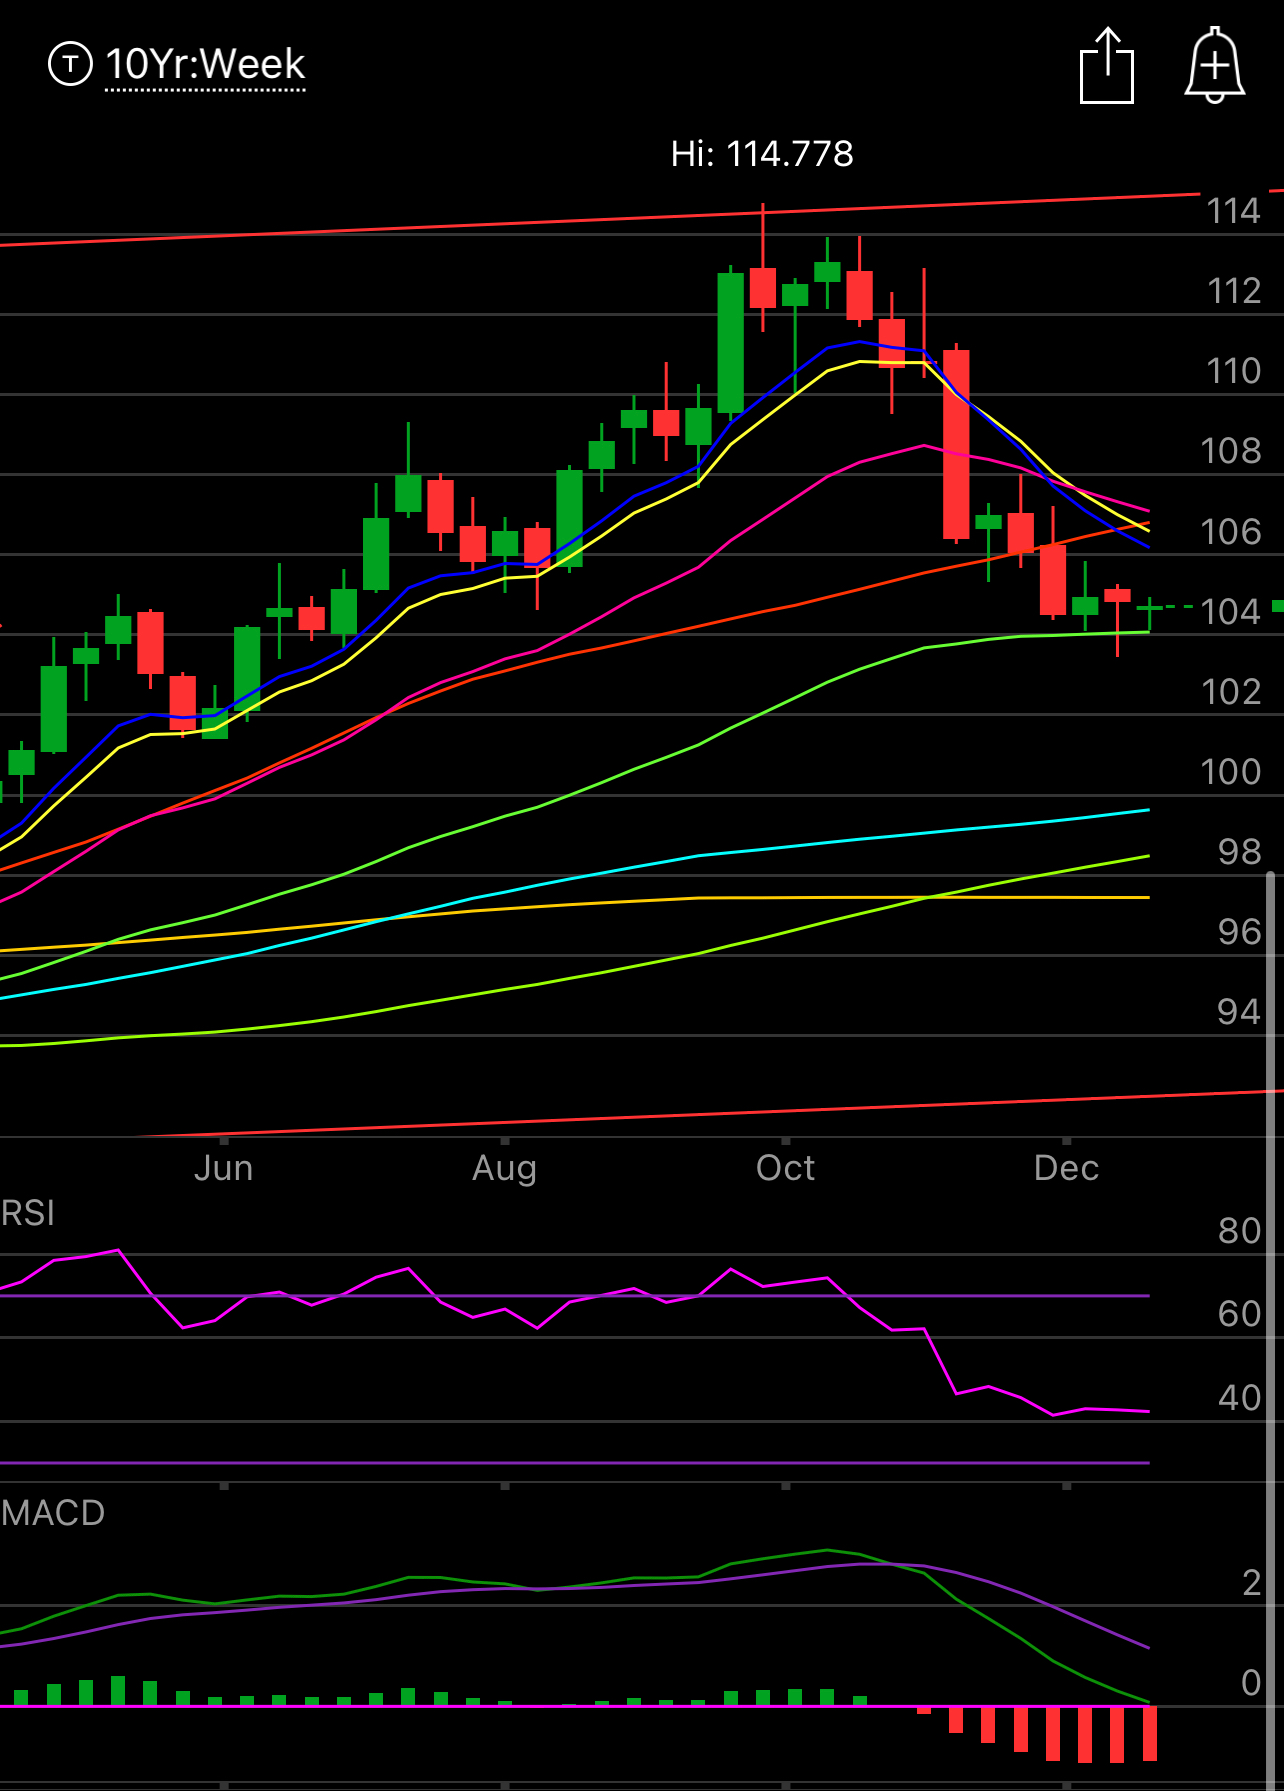
A chart that stood out to me today was Amazon. Over the weekend I mentioned Apple was breaking down and it had a follow through today, I won’t bore you with that one again but Amazon, it broke to new 52 week lows. That isn’t bullish at all and signals continuation lower. This is where I always joke about lines mattering more than fundamentals. Once Amazon broke that horizonatal line, you could throw everything out the window, it doesn’t matter. All that matters now is it will be sold. Now I’m short puts on Amazon, and I added more today but significantly lower. I would not try to catch this anywhere around here.
Todays Unusual Options Flows & What Stood Out
Before I get into the unusual action, there were alot of new people who joined over the weekend. I want to say a couple things. This table below is the most important part of the recap everyday. It contains all the trades I found to be unusual. Other services will just give you tons of trades and leave you to guess. For me, these are the oddest based on historical volume in names I scan. So take note of the positioning and utilize it how you will. I personally am a put seller, but you can use this data however you’d like.
Secondly, I just added a very cool bot to the discord that can basically do whatever you want it to ask within the market. You just hit the backslash button, “/”, and you can see all the prompts from technical analysis, fibonacci levels, insider buying, fundamentals, whatever you want, for any ticker, it’s there at your fingerprints. So utilize it however you like.
Also if you haven’t joined the discord, the invite is in your welcome email when you subscribed. If you can’t find it just DM me on twitter and I will send you one. The table below is broken into calls bought and puts sold(bullish) along with puts bought(bearish). The risk reversals and spreads bought I put what the trades were and if you have any questions you can always ask.


