1/3 Recap
The SPY remains weak after yesterday’s gap below the 8 ema. That’s just the short term trend change I mentioned yesterday, nothing material, just a little weakness. The 21 ema is right below where we are right now and ideally we’d hold that, if we don’t we have quite a ways down, perhaps even to fill that gap down right over 440. With the 8 ema sloping down now, we’re going to need some catalyst to gap up higher, maybe jobs number on Friday. Until that happens I would count on constant rejection on attempts over the 8 ema.
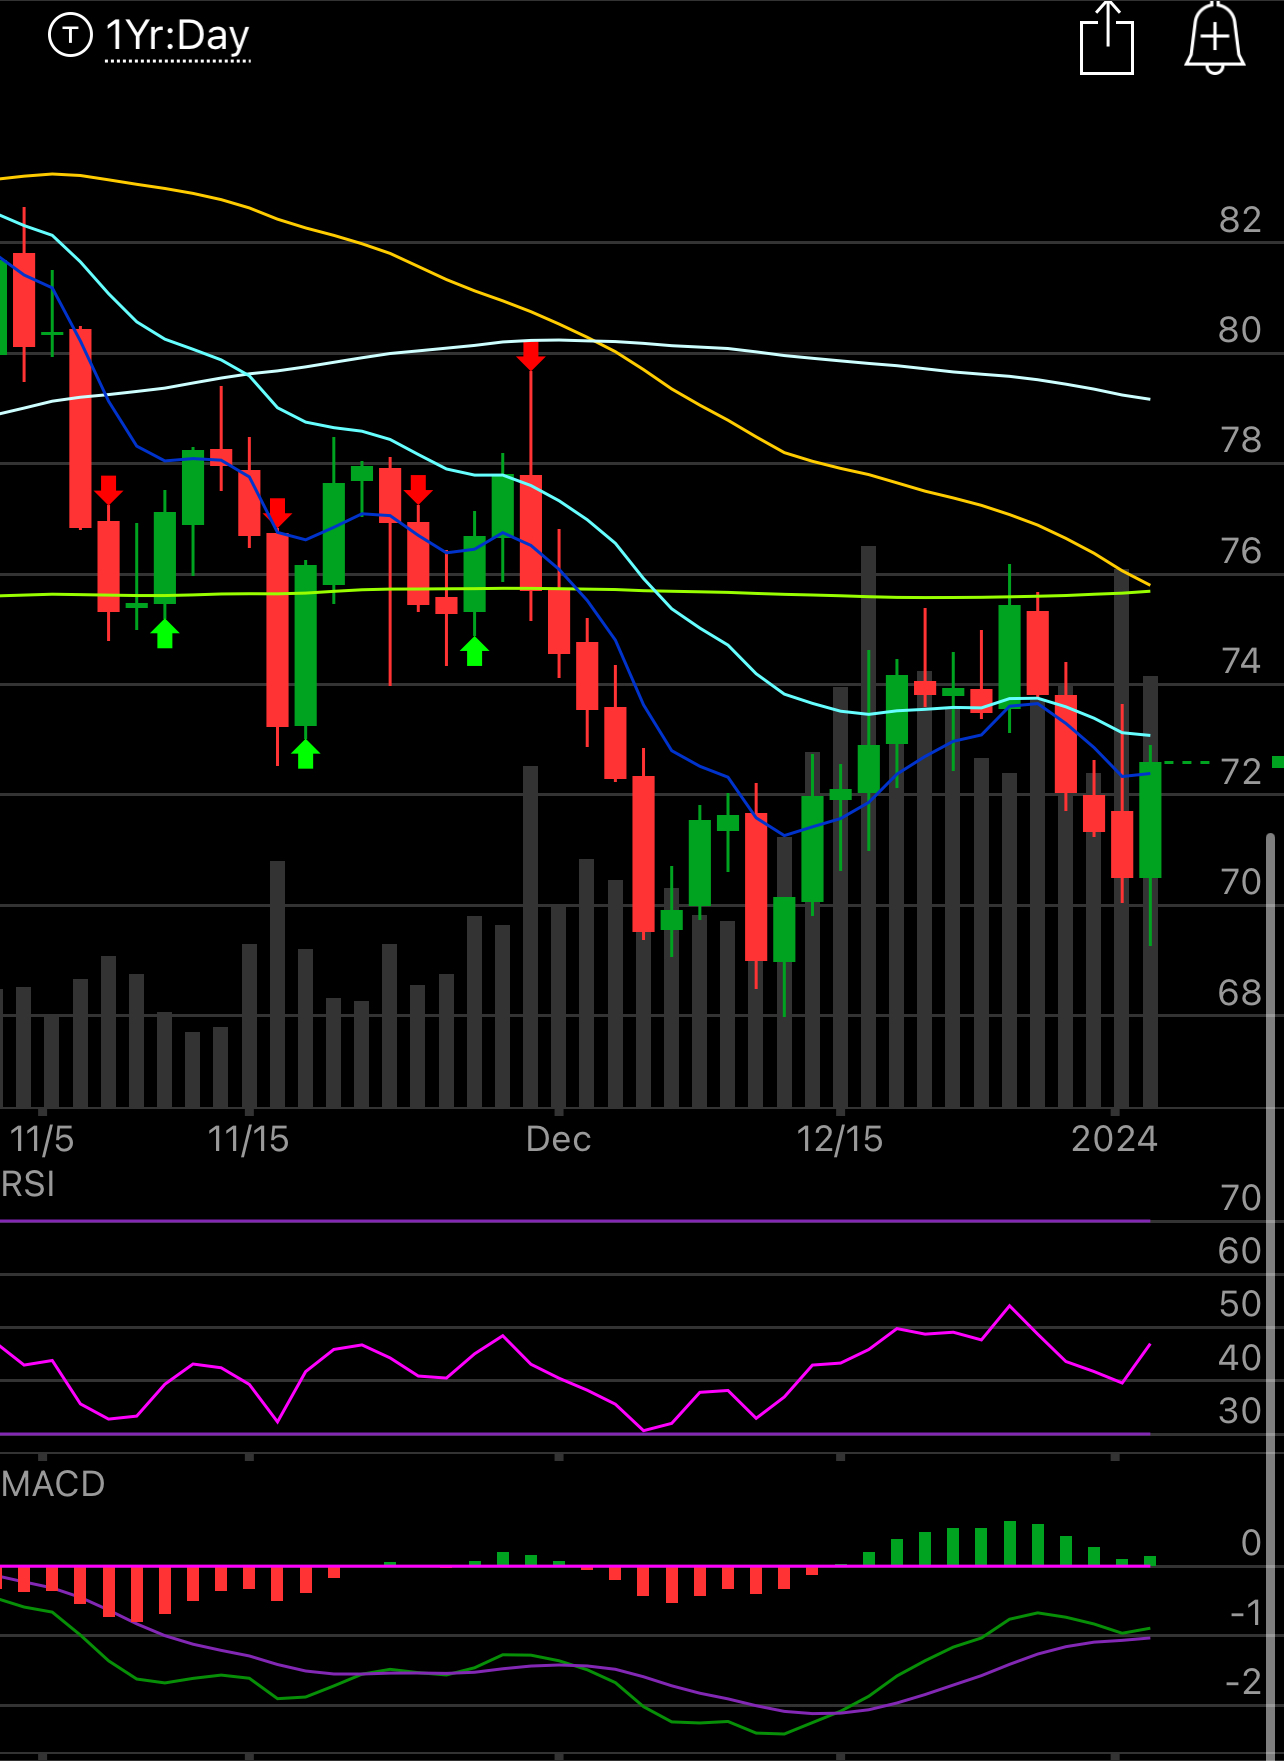
Oil continues the back and forth, its almost like we live in a Matrix, every time oil looks terrible and wants to go lower we get some bullish catalyst out of nowhere, today it was the attack in Iran one day after the attack in Beirut as grumblings of an expanded war in the region are starting up.
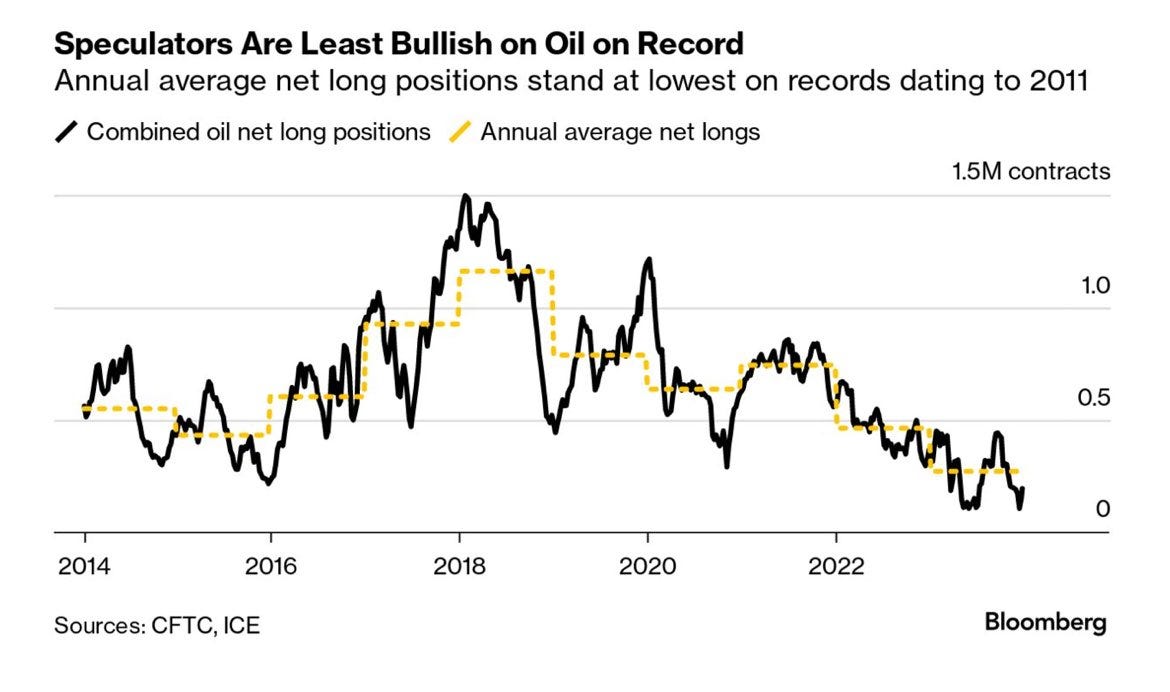
We also had this out from Bloomberg where oil speculators are just non existent at the moment. As usual when everyone forgets about an asset it always manages a small rally, will this continue the trend?
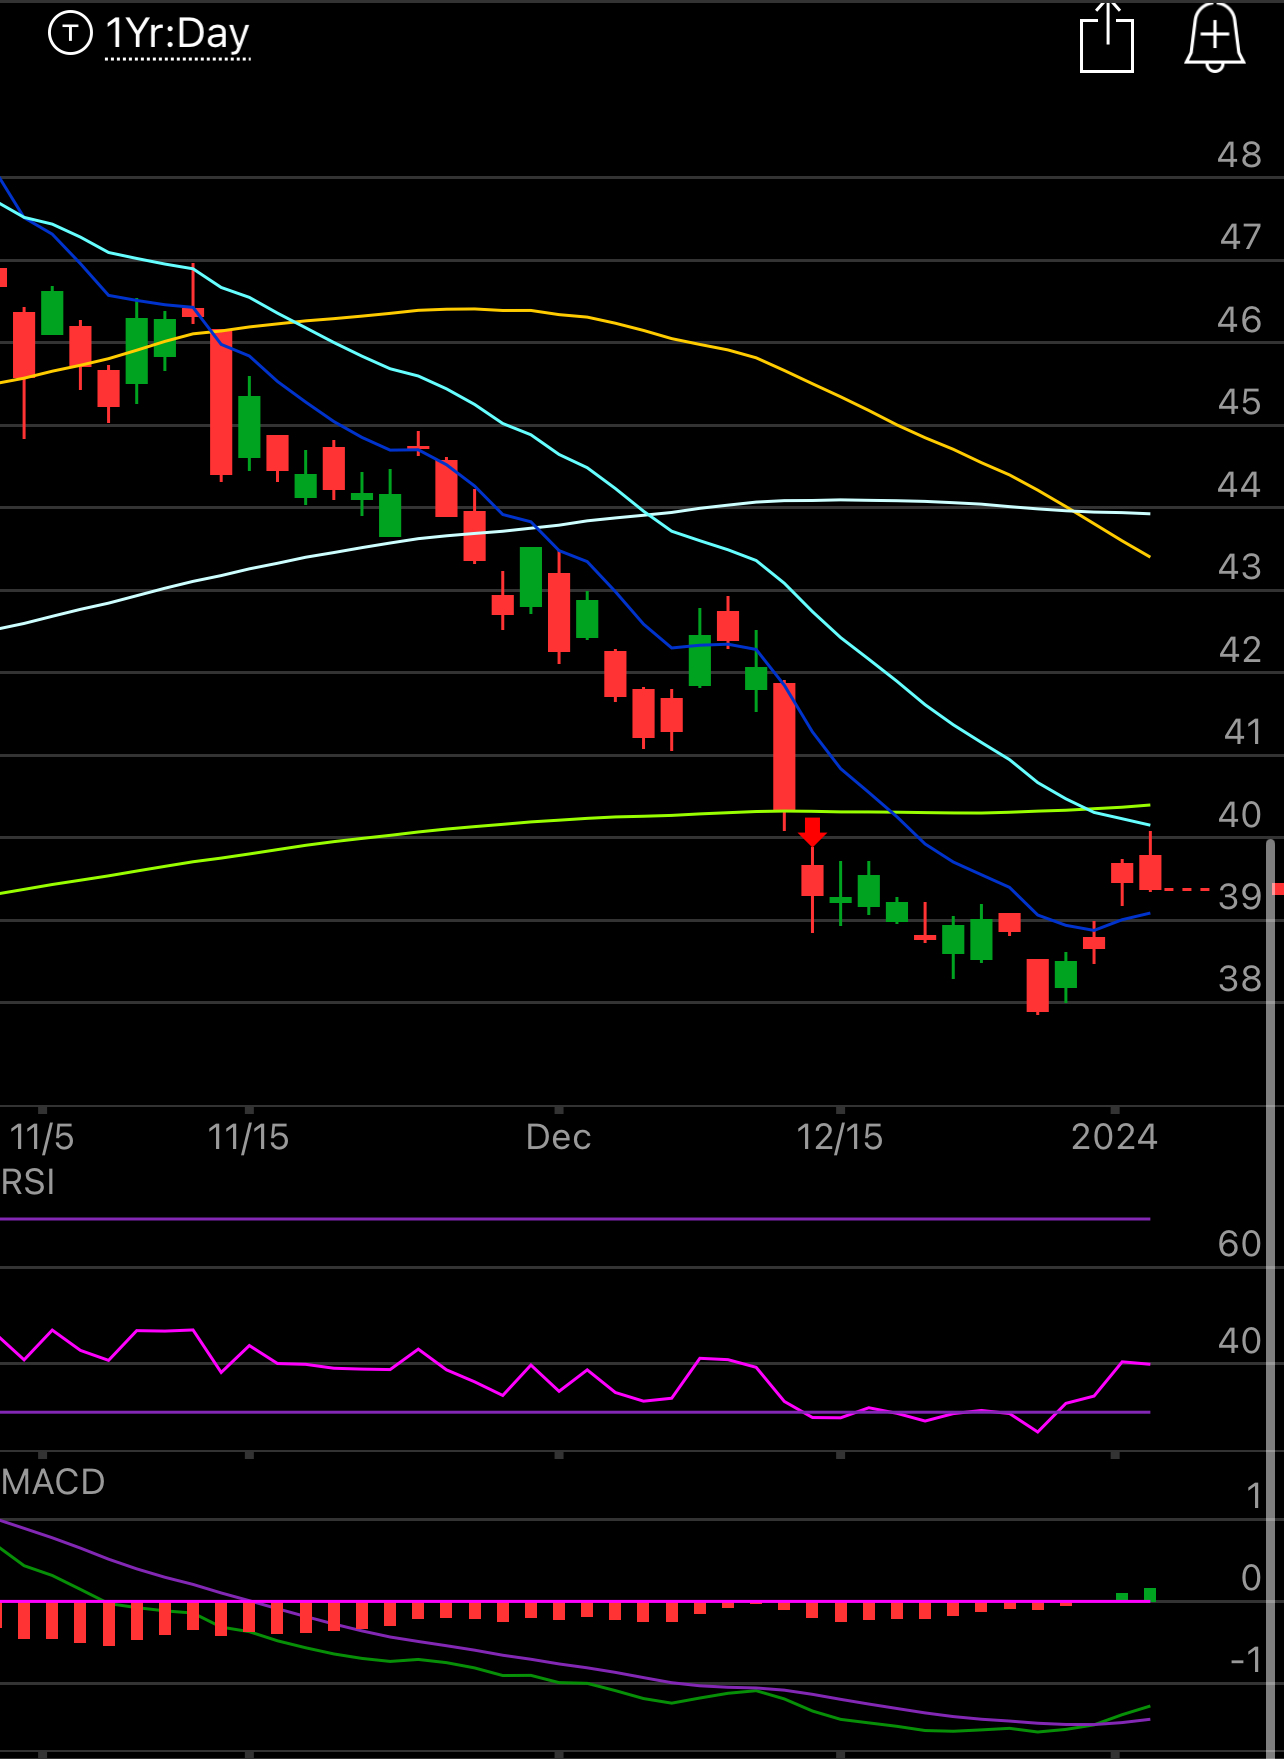
Yields continue to reject higher levels, we went over 4% momentarily today then dumped after that ISM report. The dollar continues to strengthen though and the market is sending mixed signals.
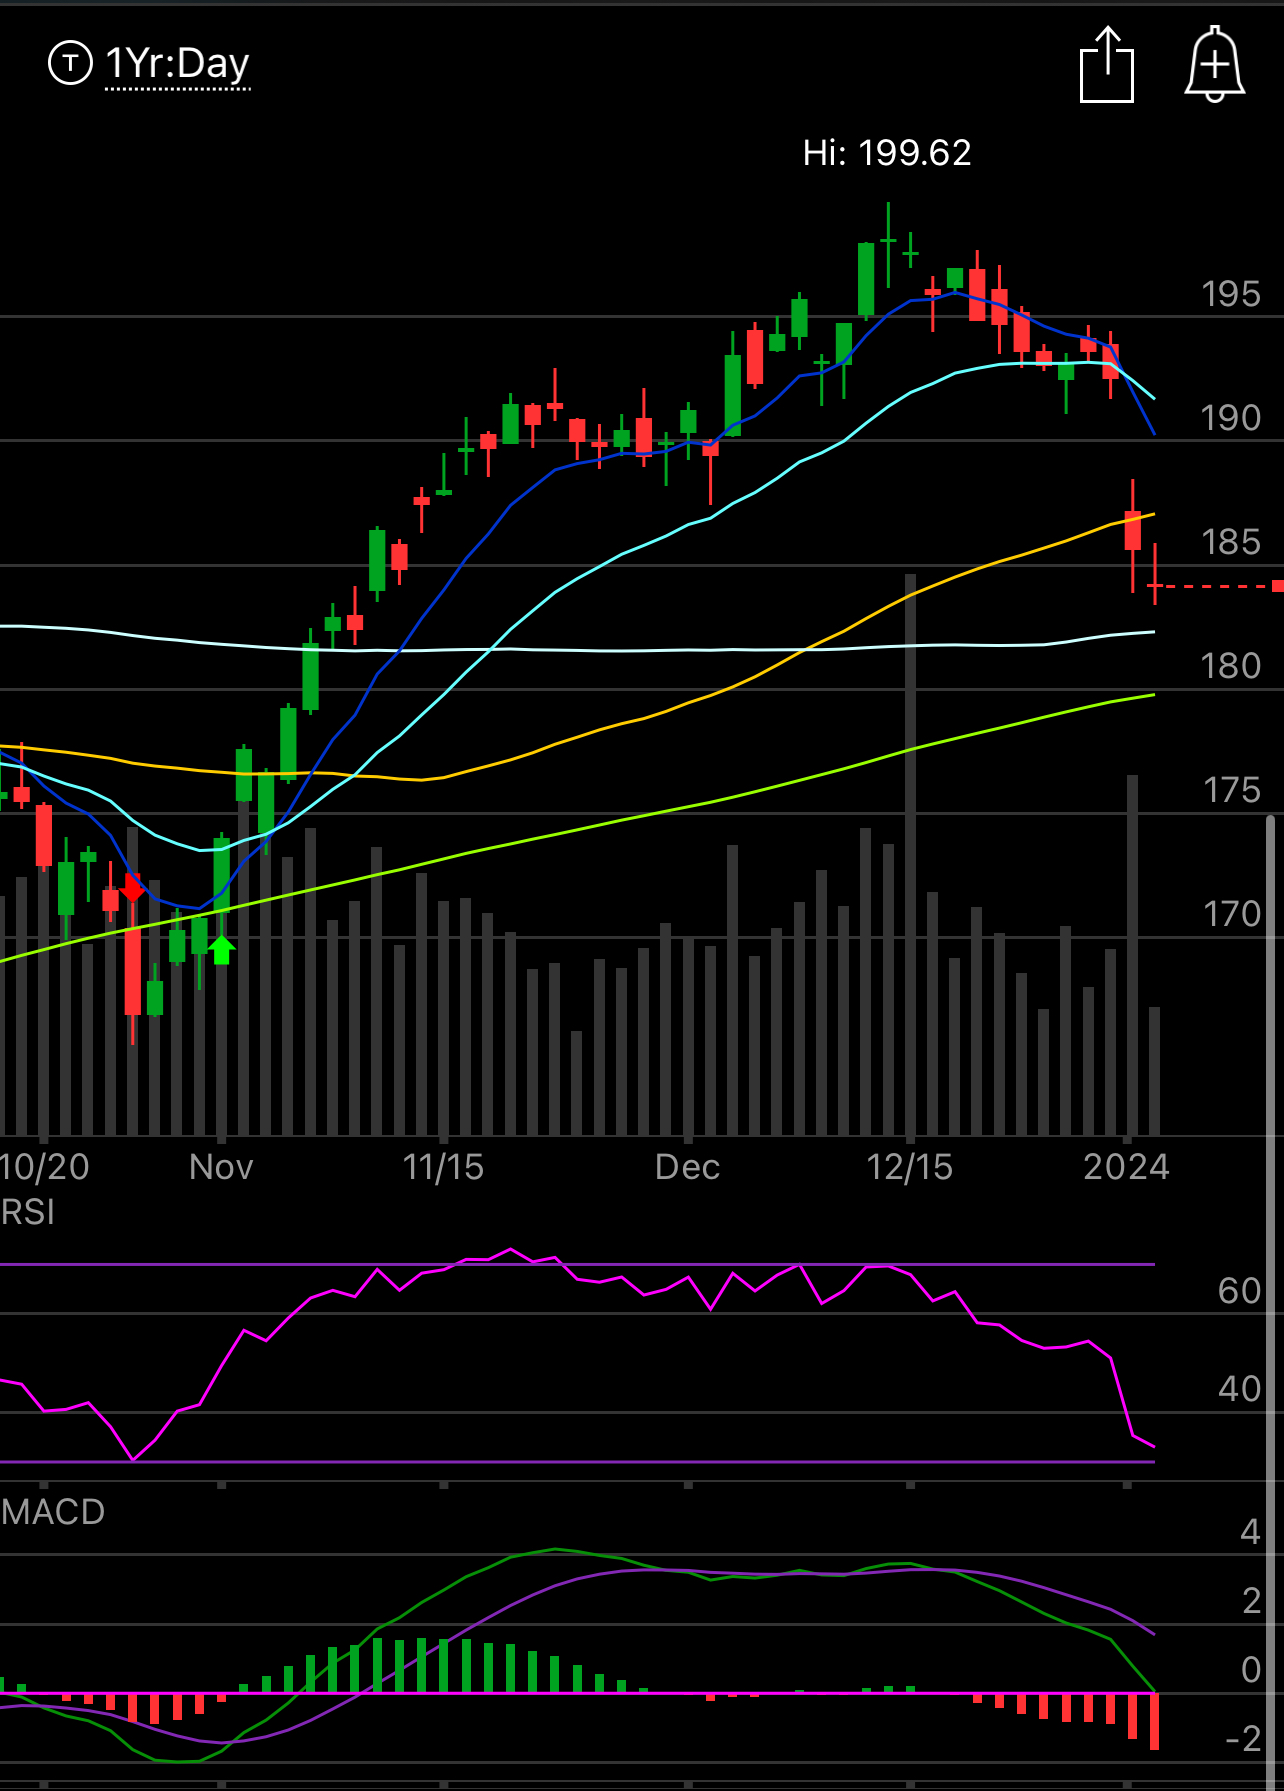
The chart to watch is Apple, below, the biggest component of our market is seeing a massive exodus as it nears max oversold levels. The 8/21 bear cross below is telling you all pops will be sold momentarily. More concerning is it’s the only megacap close to the 200 day, a mere $4 away, what if it breaks below that? It’s never ideal when the biggest name in markets is below the 200 day, but Apple is really struggling to find growth these days. Keep an eye on this.
Recent Trades
Yesterday’s recap had a big put buy in JETS, the airline ETF, I didn’t highlight it but JETS is down 3.5% just 1 day later.
TMUS is up almost 6% in the past week since I sent out the 2024 preview to a high of 164 in today’s session. This was a really nice chart that kept seeing repeated bullish activity the last few weeks and has continued to play out with the short term rotation out of tech.
Trends
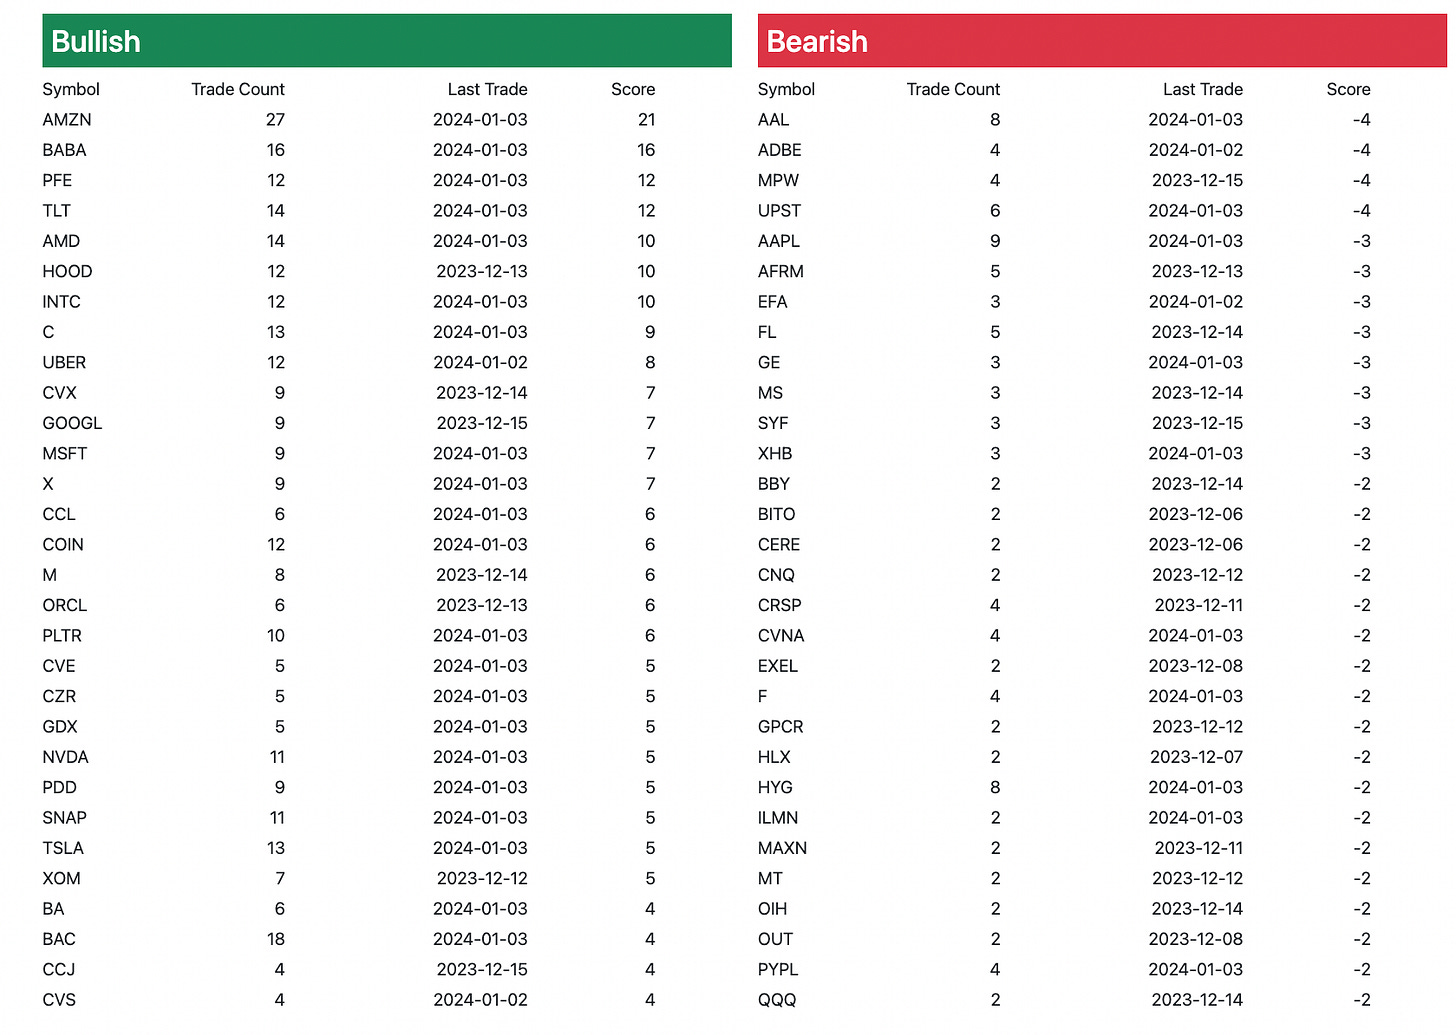
Like I said yesterday, I need a few days here after taking 2 weeks off to build up all the trends again, for now I’m going to include the week to date and 1 month only. As you will notice, there’s a new format. A member in here, Sped, built out a new web based app for me to work with and it cleans up alot of things while overall just looking better. You will see it in the daily tables and individual names data going forward.
Week To Date
1 Month
Today’s Unusual Options Activity
You can see the new format shows you how many trades were placed in each segment ie 49 calls bought, 42 puts bought, and 32 puts sold. If there’s anything else you want added to any of this just let me know.


