
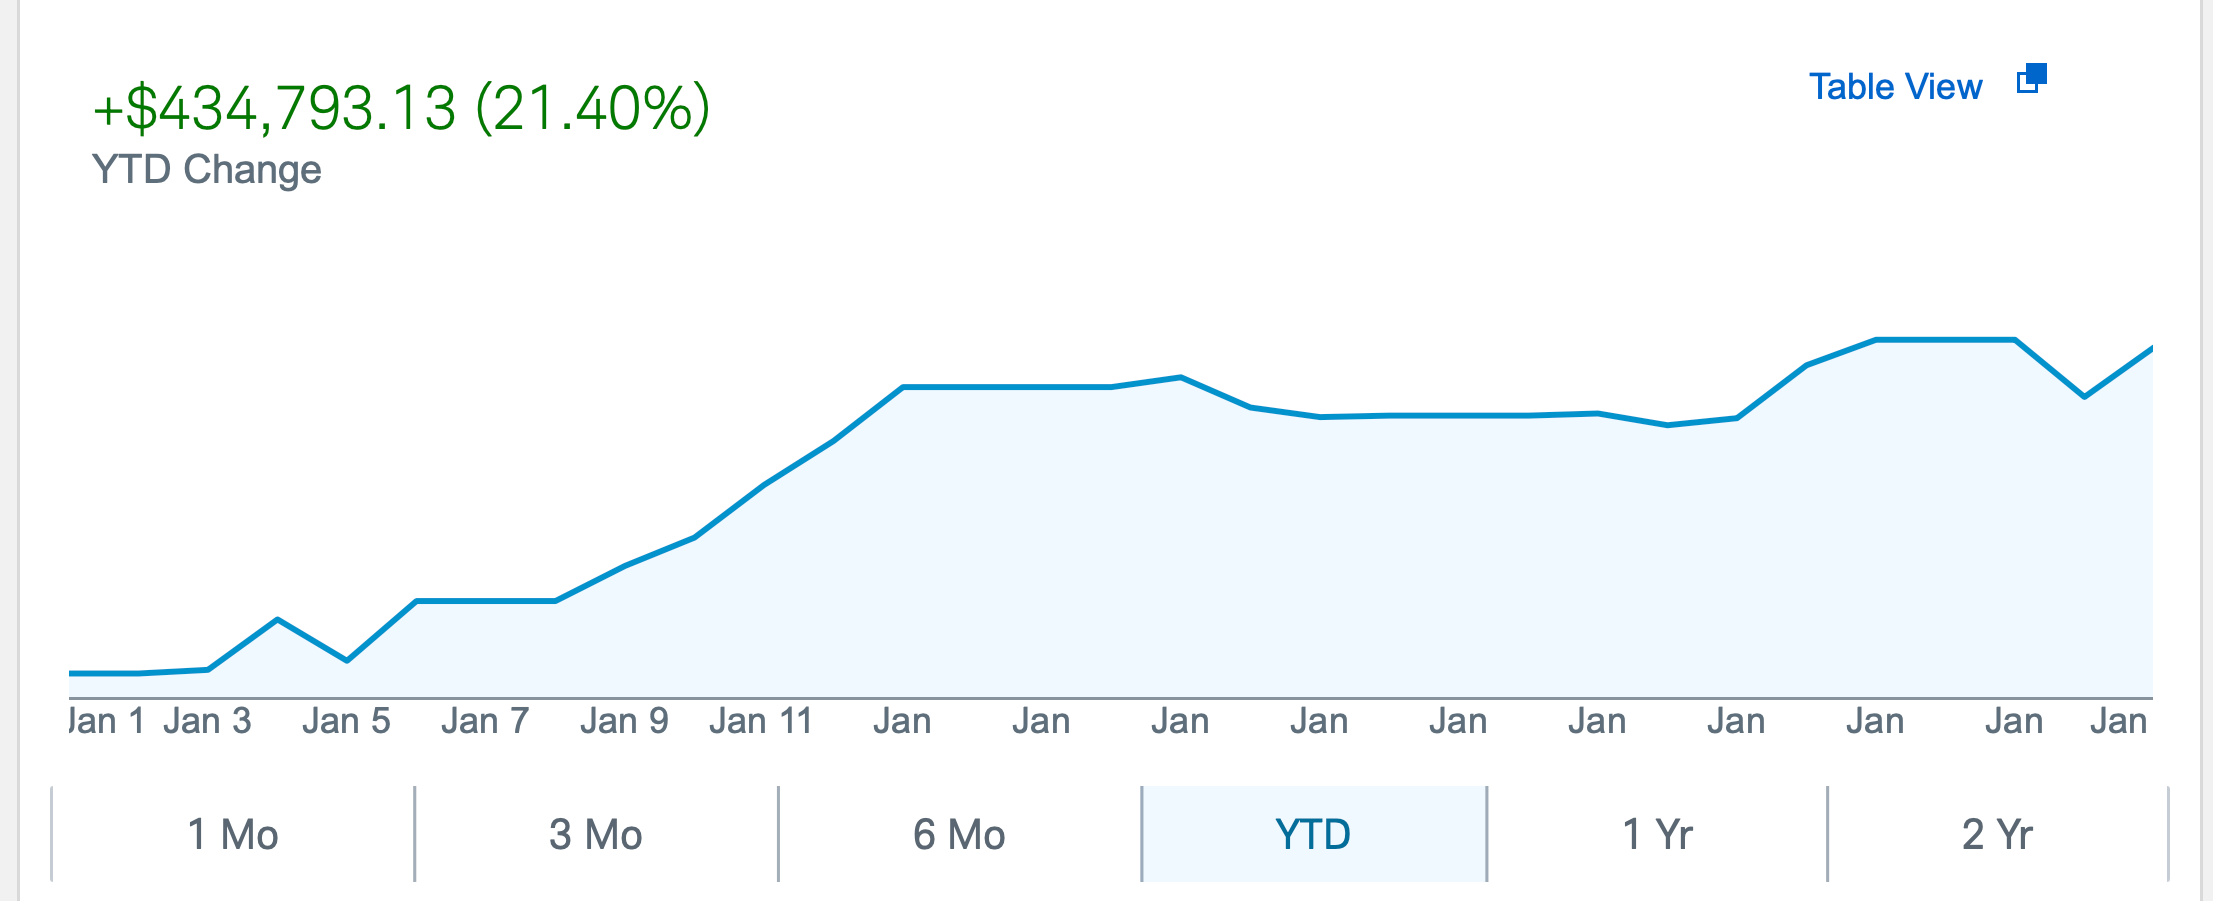
1/31 Recap. We Closed Out The Month Strong

A nice rally to end the month today. We still have alot of things that can go wrong this week with Powell speaking tomorrow and earnings this week from the big boys in Apple,Amazon, and Google. There isn’t really alot to say, the bears aren’t wrong fundamentally, but charts are charts and for the moment, there is alot of strength in this chart for the time being, that can all turn on a dime this week, but for now, this is a bullish setup. Bears would argue we still have not cleared the December high over 410 and if we turn lower here, it is just another lower high in a series of them going back a year. So that is still a possibility. I’m submitting this before SNAP reports its numbers but that has crashed advertising names the last couple time around. Let’s see what Snapchat has in store today.
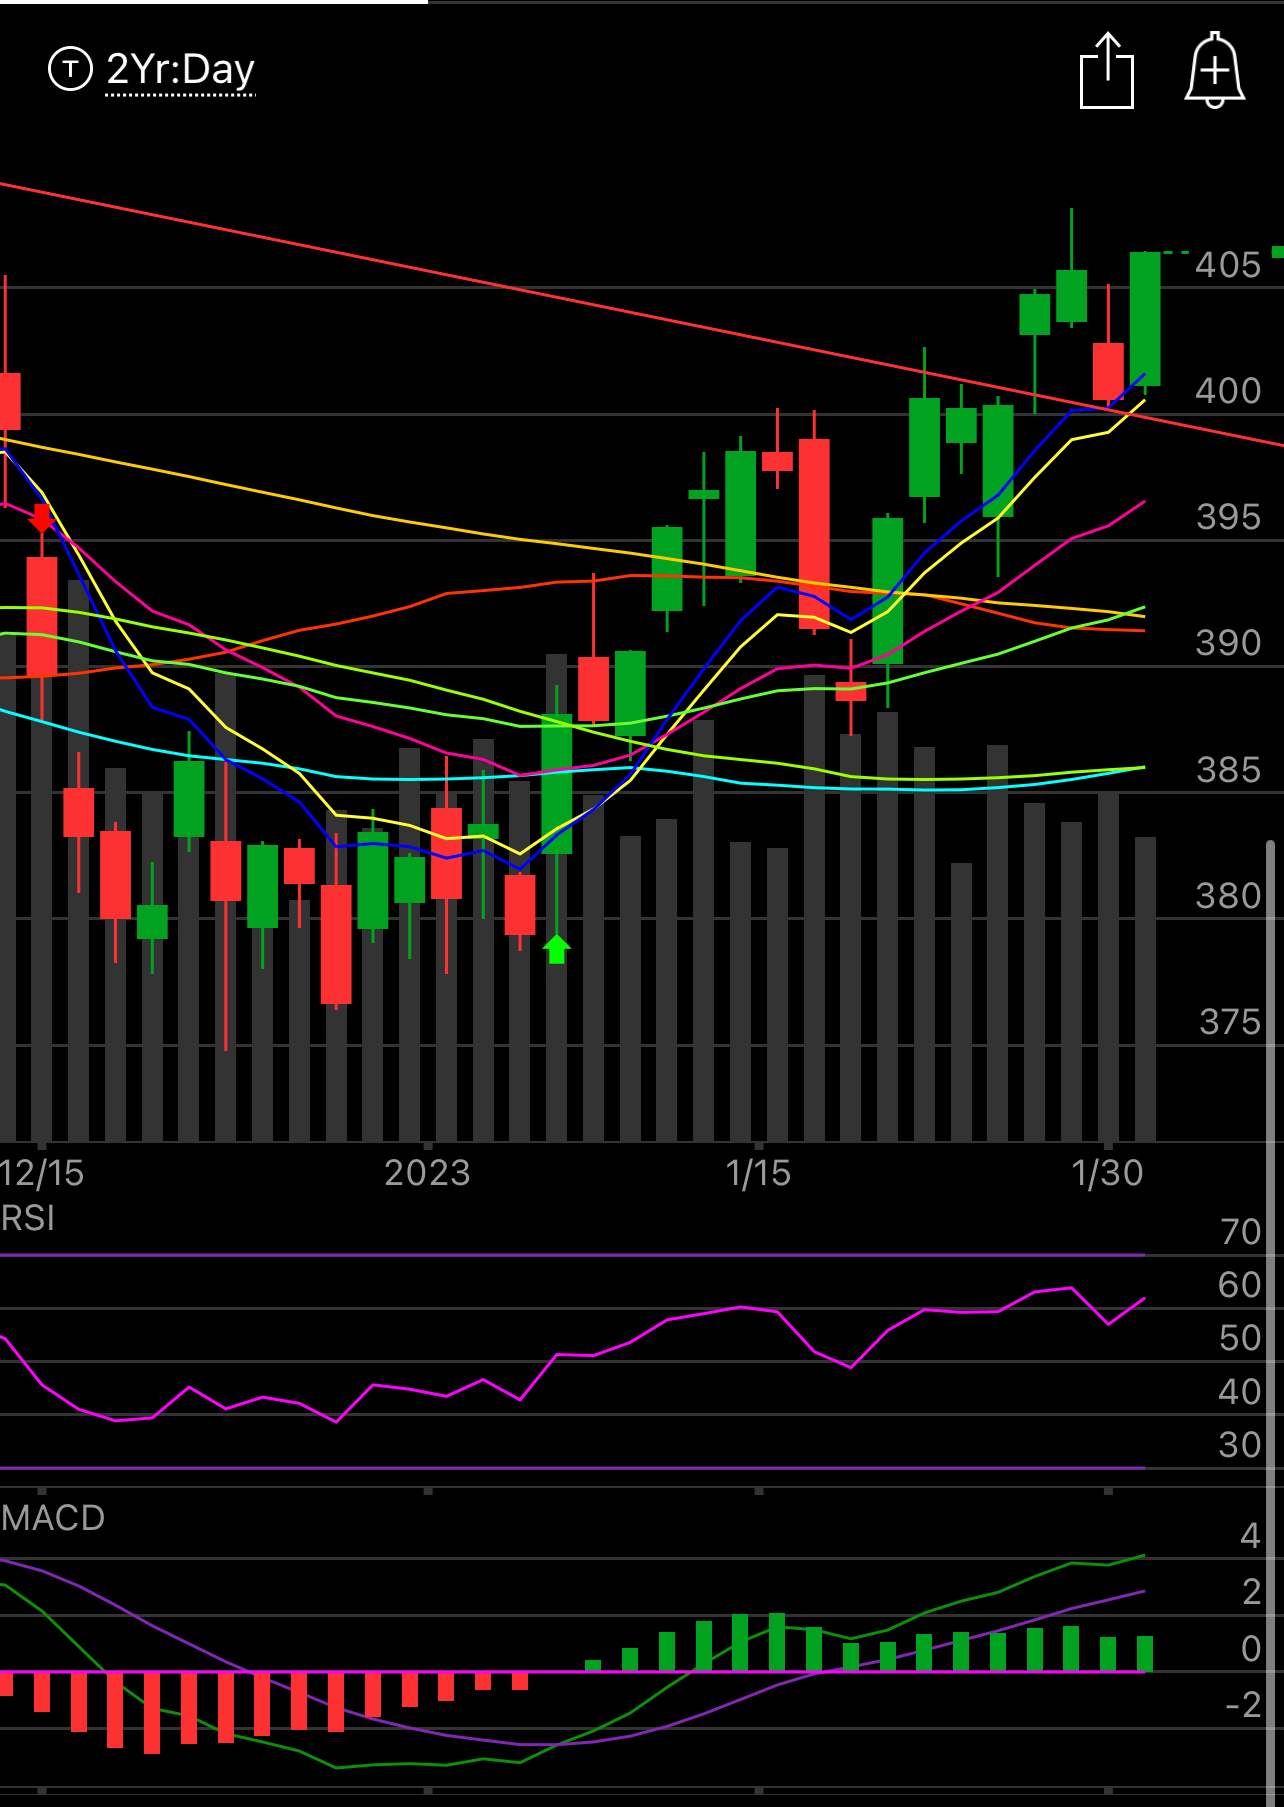
SPY
Closed at the highs of the day, very impressive move up. All meaningless really unless you unload into it before Powell tomorrow. Very strong close, retested the 8/10 EMA and closed at the highs, what can you say if you’re just looking at charts, this is bullish.
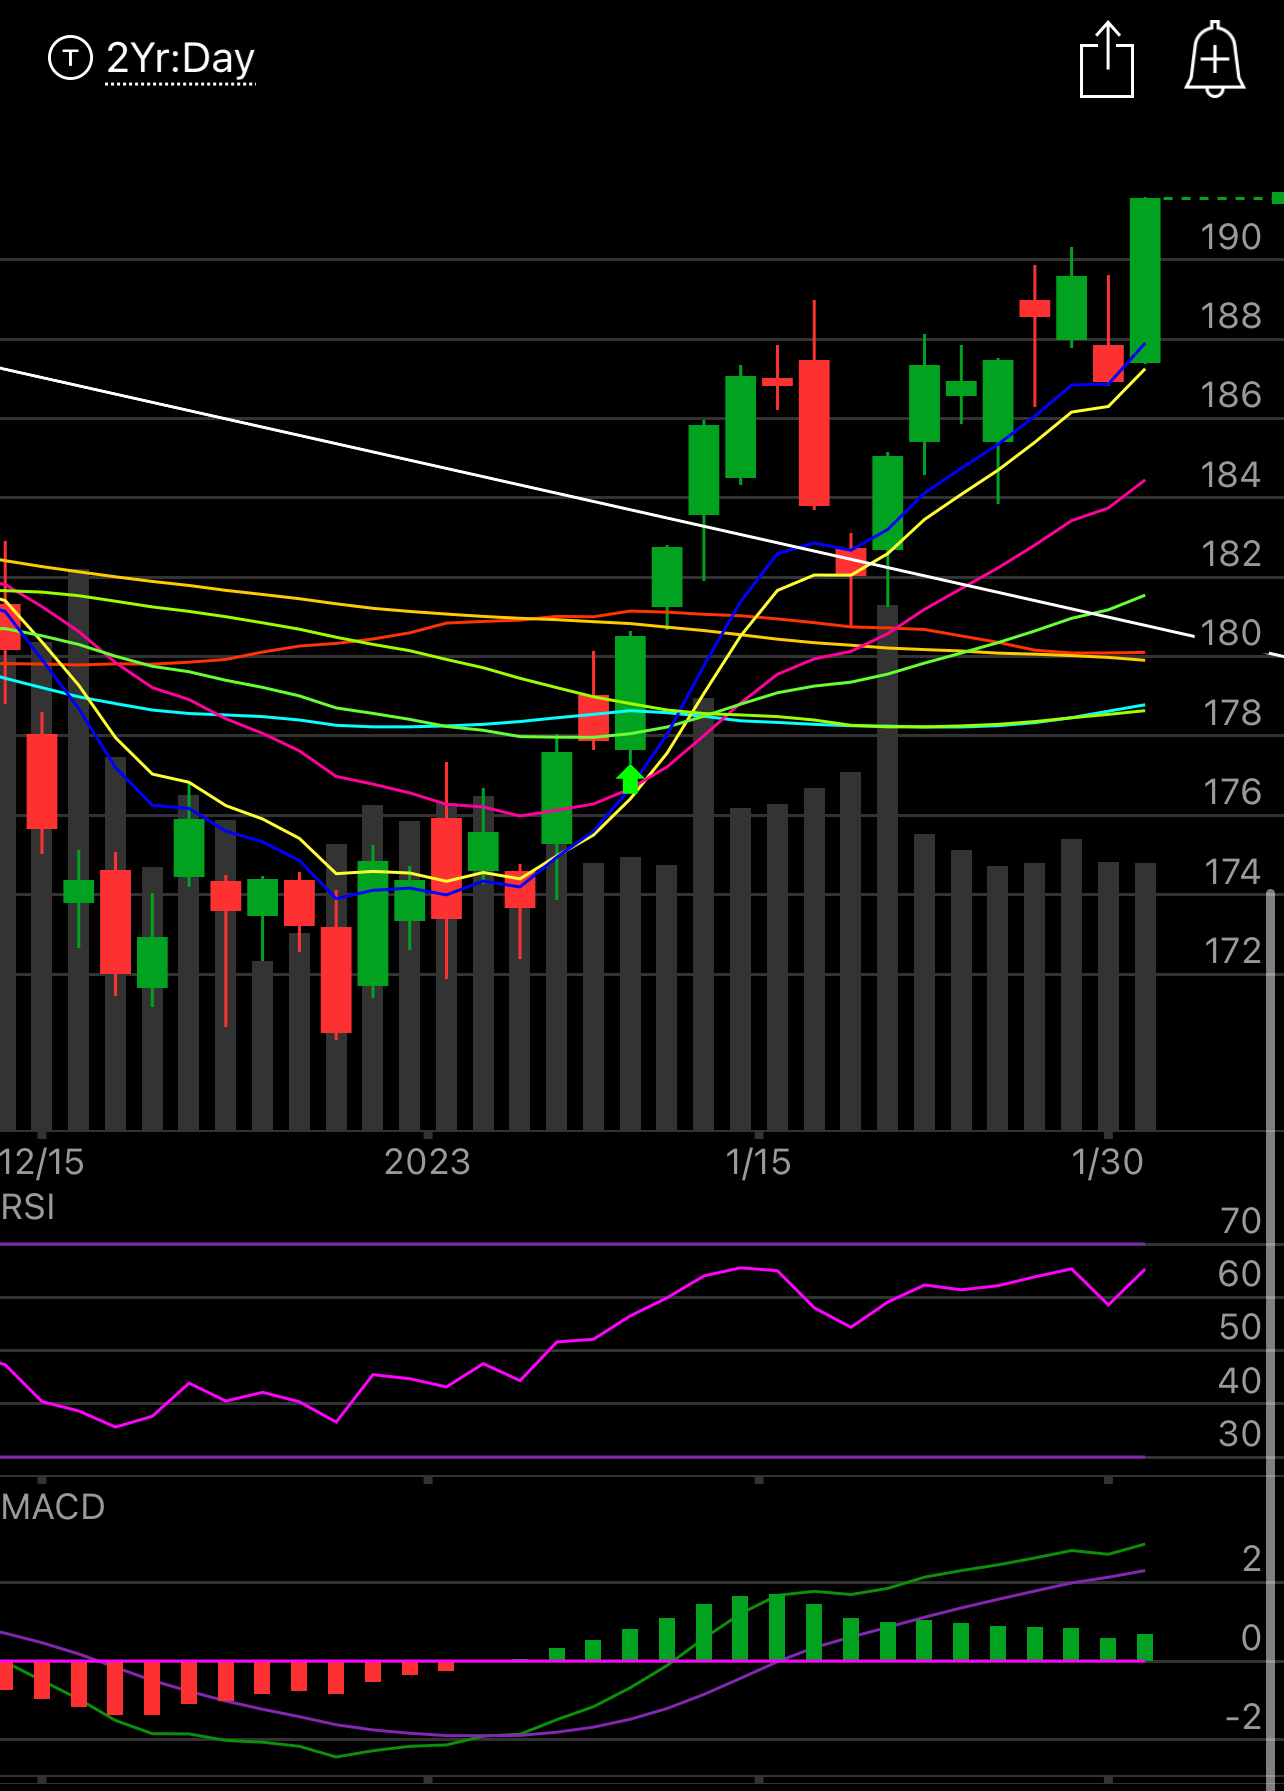
IWM
Similar chart, but you see the breakout is longer in length and the strength is on another level, look at something like ARKK and how hard it has run this year. Small caps remain stronger because they closed over highs from 2 days ago, the SPY did not.
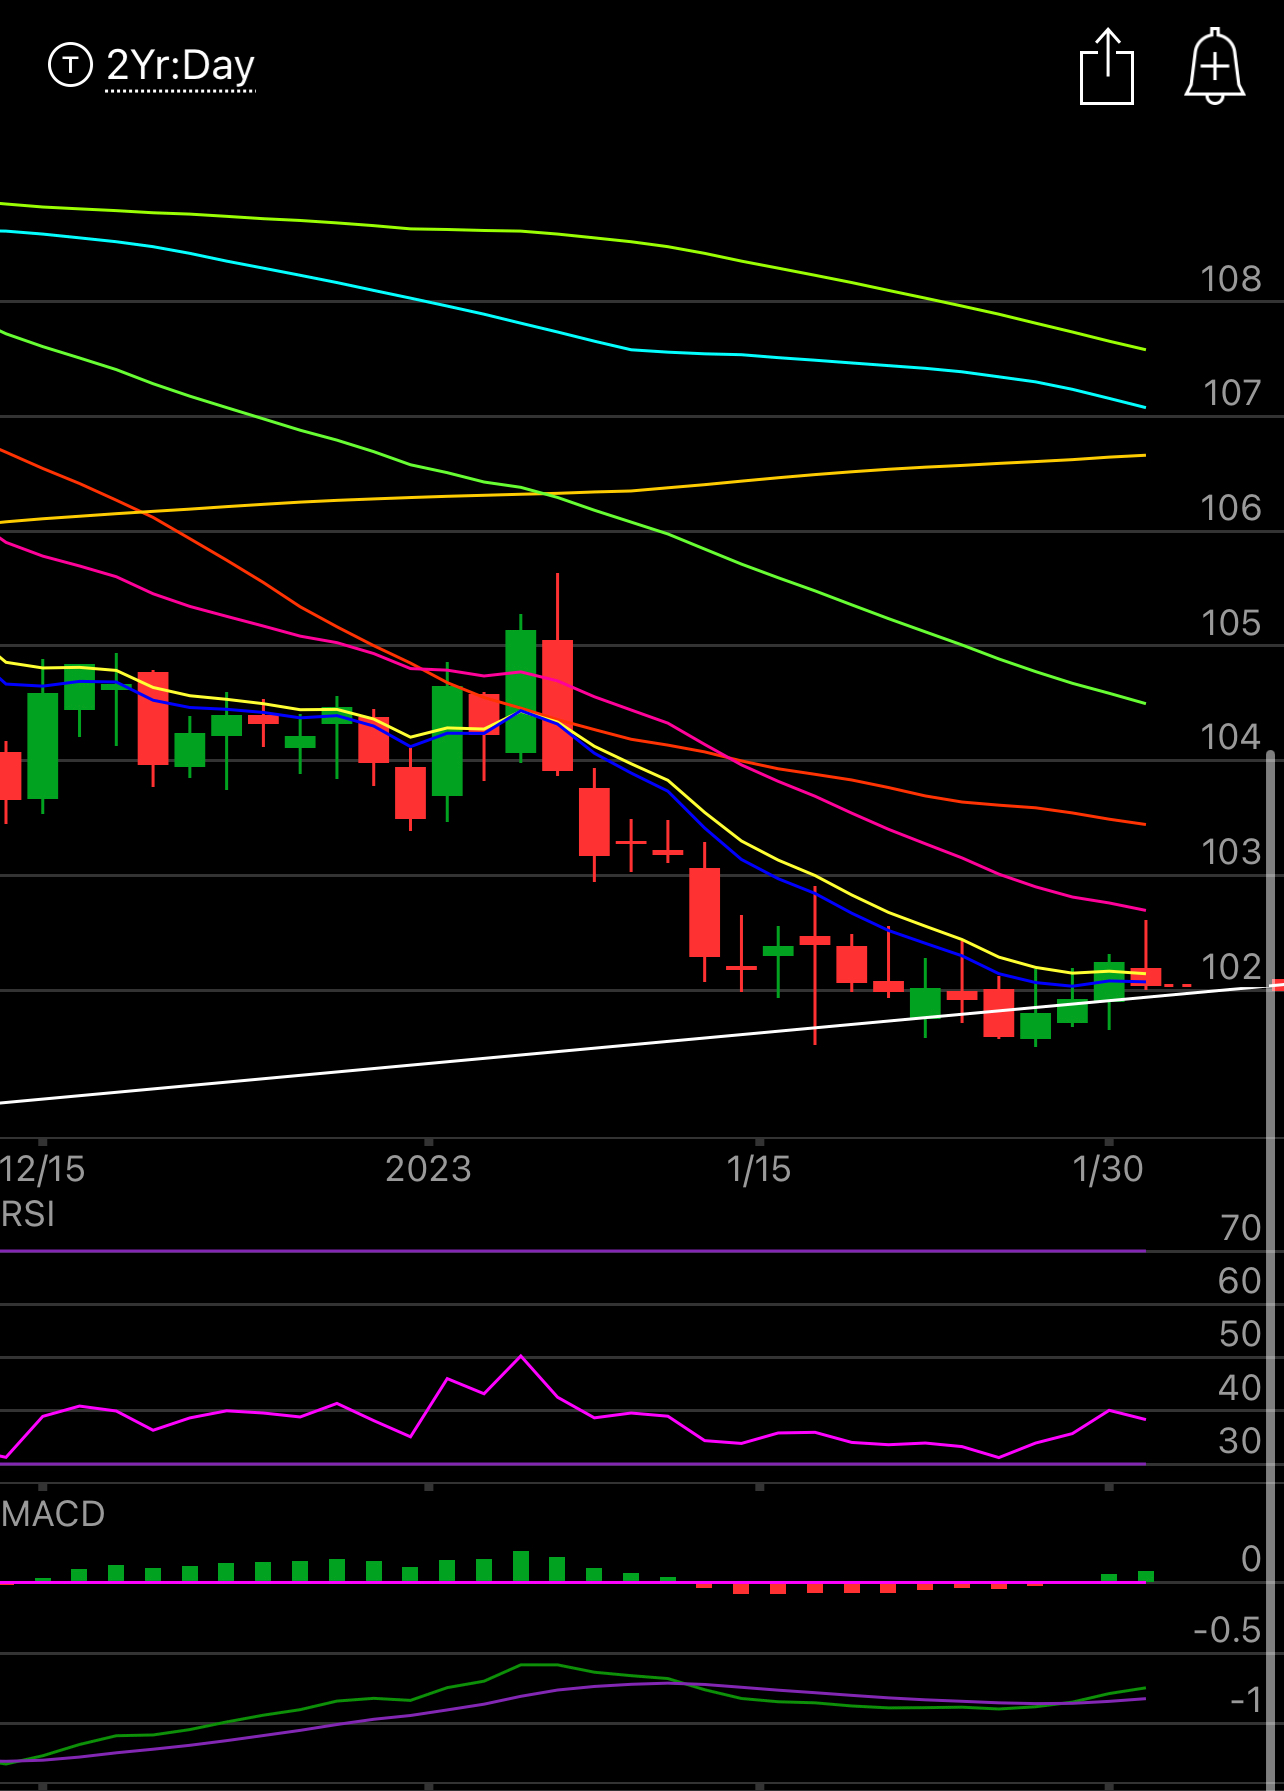
Dollar
What an ugly candle this put in with the inverse hammer. Still over the trendline but surprisingly nobody wanted to run to the safety of the dollar the day before Powell….
Today’s Unusual Options Activity
So the new spreadsheet I began using is pretty cool because it is going to accumulate data and in a few weeks we will be able to see better trends of where things are happening across all tickers. Like the tweet I just fired off about Target. That has seen bearish flows near daily for the last few sessions. As the chart below collects all the flows I post, we should be able to see more clarity on all the names and what is happening inside each in terms of “unusual” activity. That is a big deal because although one could look at something generic like the put/call ratio that won’t show the truly unusual size trades and what direction those are looking for, and that’s what I’m hoping to capture here, so big things going forward. This will be an incredible resource in time, maybe the best around in all honesty, where you can ask me specific tickers and I will be able to give you figures like this below. Of course, this is only 2 days worth of data but you get the point…….
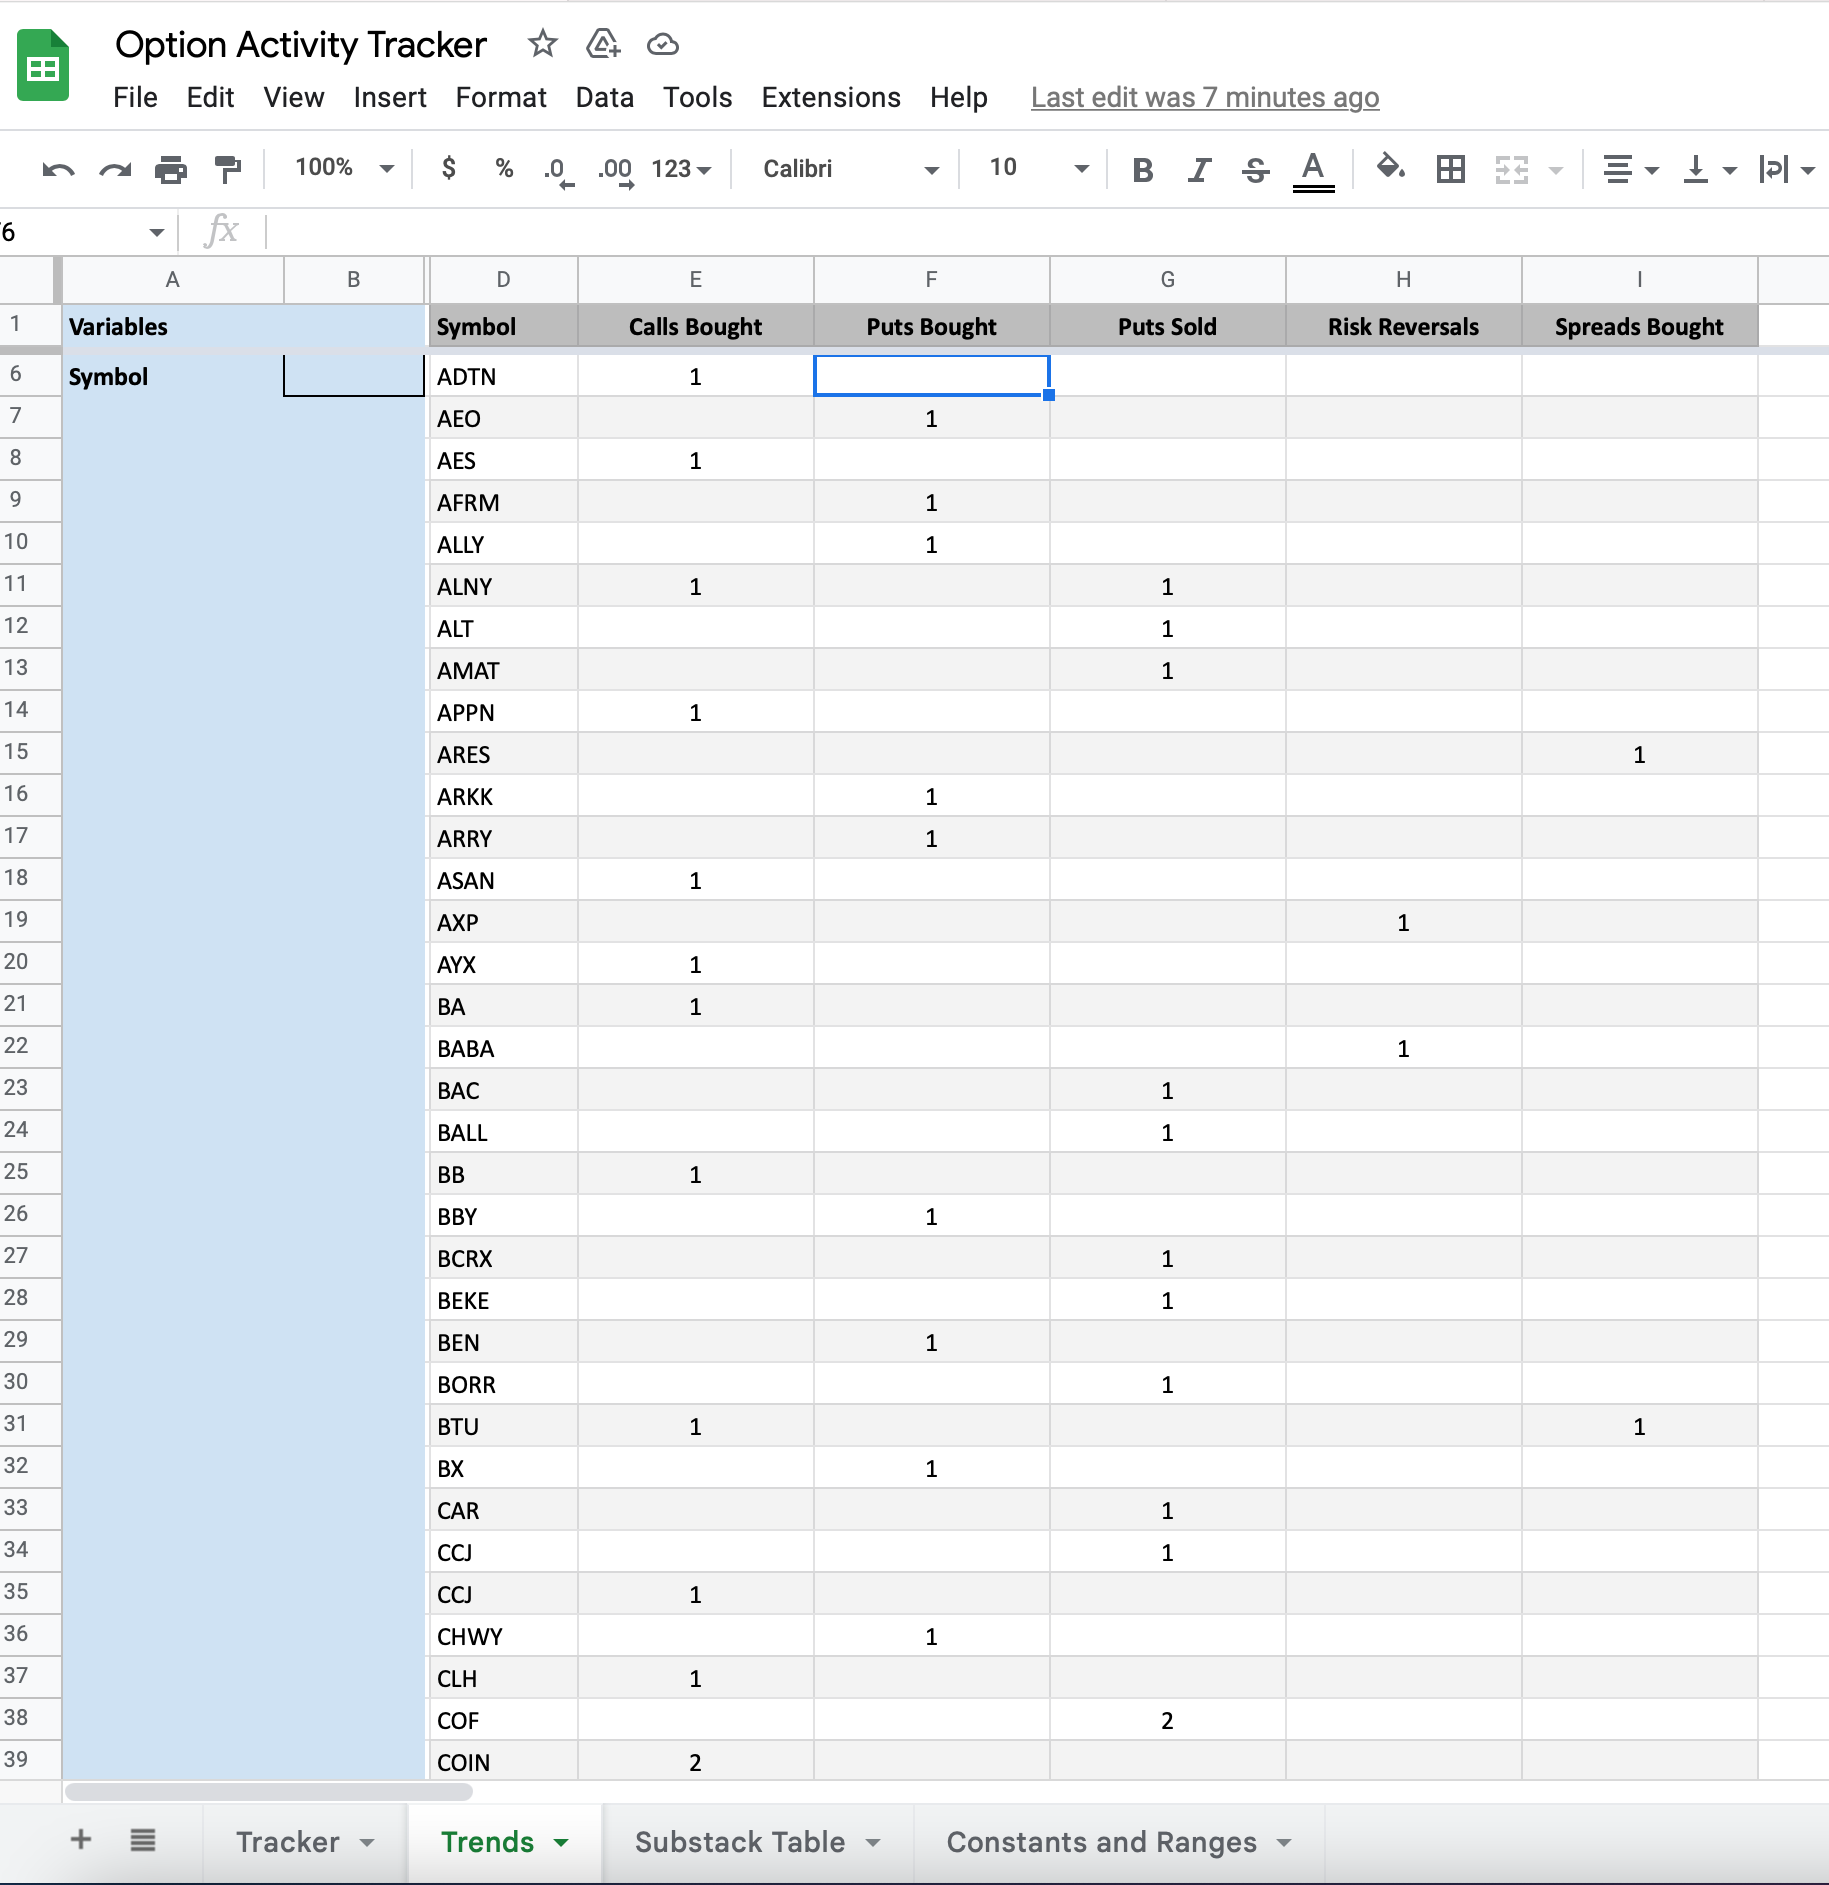
So with that said here is today’s table of action
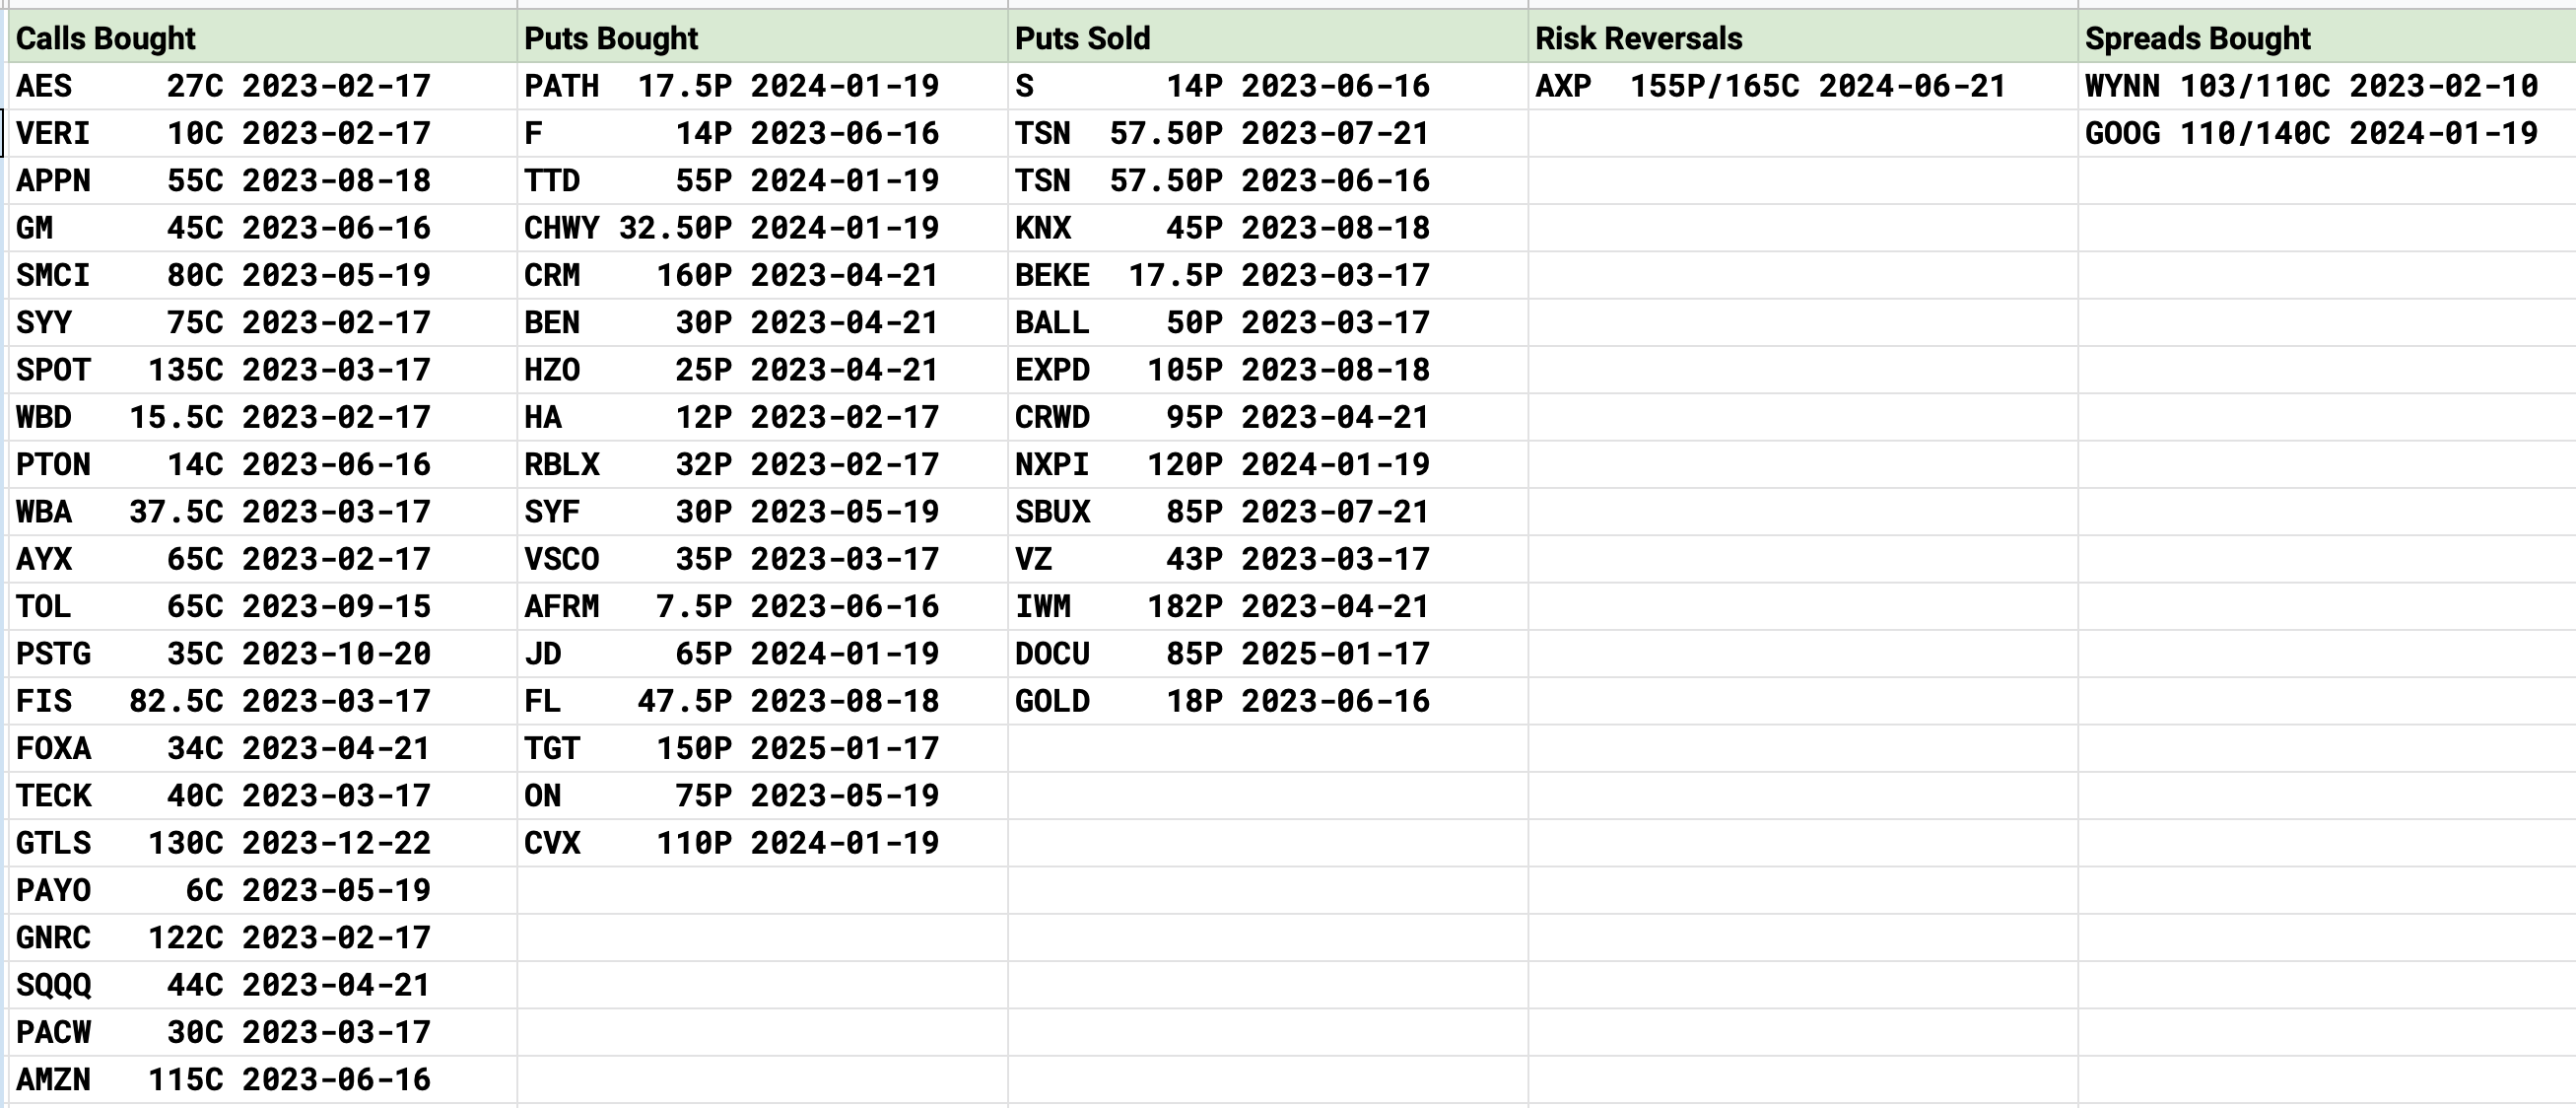
Amazon with a large block of 5000 June 115 calls bought
SQQQ had a 7000 block of April 44 calls bought today, interesting trade
SPOT saw 20% OTM calls bought at 135 in March
DOCU has been a favorite of mine and it saw a very odd put sale for next Jan at 85, it is 60 today so looking for big upside
TSN saw puts sold at the same strike of 57.50 in June and July
GOOGL not GOOG saw 110/140 call spreads bought for next Jan
CVX is 170+ and just announced a massive buyback but today they bought 110 puts next January in pretty large size.
VZ is one I’m in and like, they sold in the money 43 puts this march in nice size today
What Did I Do Today?


I had a great day, up 2.75% vs the NQ up 1.67% and the SPX up 1.47%. Being in mostly small caps my performance lined up more with the IWM up 2.45% but nothing out of the ordinary just short puts decaying as the market was strong. I didn’t add much today, just 1 trade on Docusign after seeing those in the money puts sold. DOCU has seen so much bullish flow the last few weeks and I sold some Jan 2024 40 puts today for 4.05. That is all. I’m trying to just hold firm and wait for this week to pass and give us more clarity on direction, until then, the market is just in no man’s land. Those CZR puts I noted in yesterday’s recap where 6000 were sold for this week worked out well today with the stock up 3% they declined by 50% almost.
What a month this was. I closed the month up 21.4%. I could have a 0% return for the next few months and I would still be on pace for my 1%/week objective selling puts. So, there is nothing for me to say other than the month went very well, well beyond my expectations. While I could close some positions and wait, it’s better to just wait and see what happens. If we go higher I will do tremendous and if we go lower, while it may sting short term, the puts are so far away that I will likely see decay in time. I try to look at the bigger picture and not the shorter term what market moves. If you remember my first post this year I said I would like to return 50% this year, well 1 month in and I’m 40% of the way there, so right on track.
Hope you all had a great day and I will see you tomorrow
I sold couple of puts, little bit later after you and on same levels and I am doing well. I am limited by my margin so I have only 3 positions but for Jan 19/2024. I am just wondering how long I should hold them. I checked the calculator and seems that after some time or certain upside, the profit is limited. What is your take on that? Thanks for great articles every day, really keeps me to have clear view on the market without noise.
Love the new tracker/spreadsheet and all the updates and info. Can't wait to get off work tonight and am determined to take this knowledge you've shared and start from Feb 1st putting it to work. You do an excellent job communicating the information. Appreciate it all! Have a great week =)