Before I get into this weeks best idea I want to give a quick primer on how to look at the market in the current trend we’re in vs past trends we’ve been in.
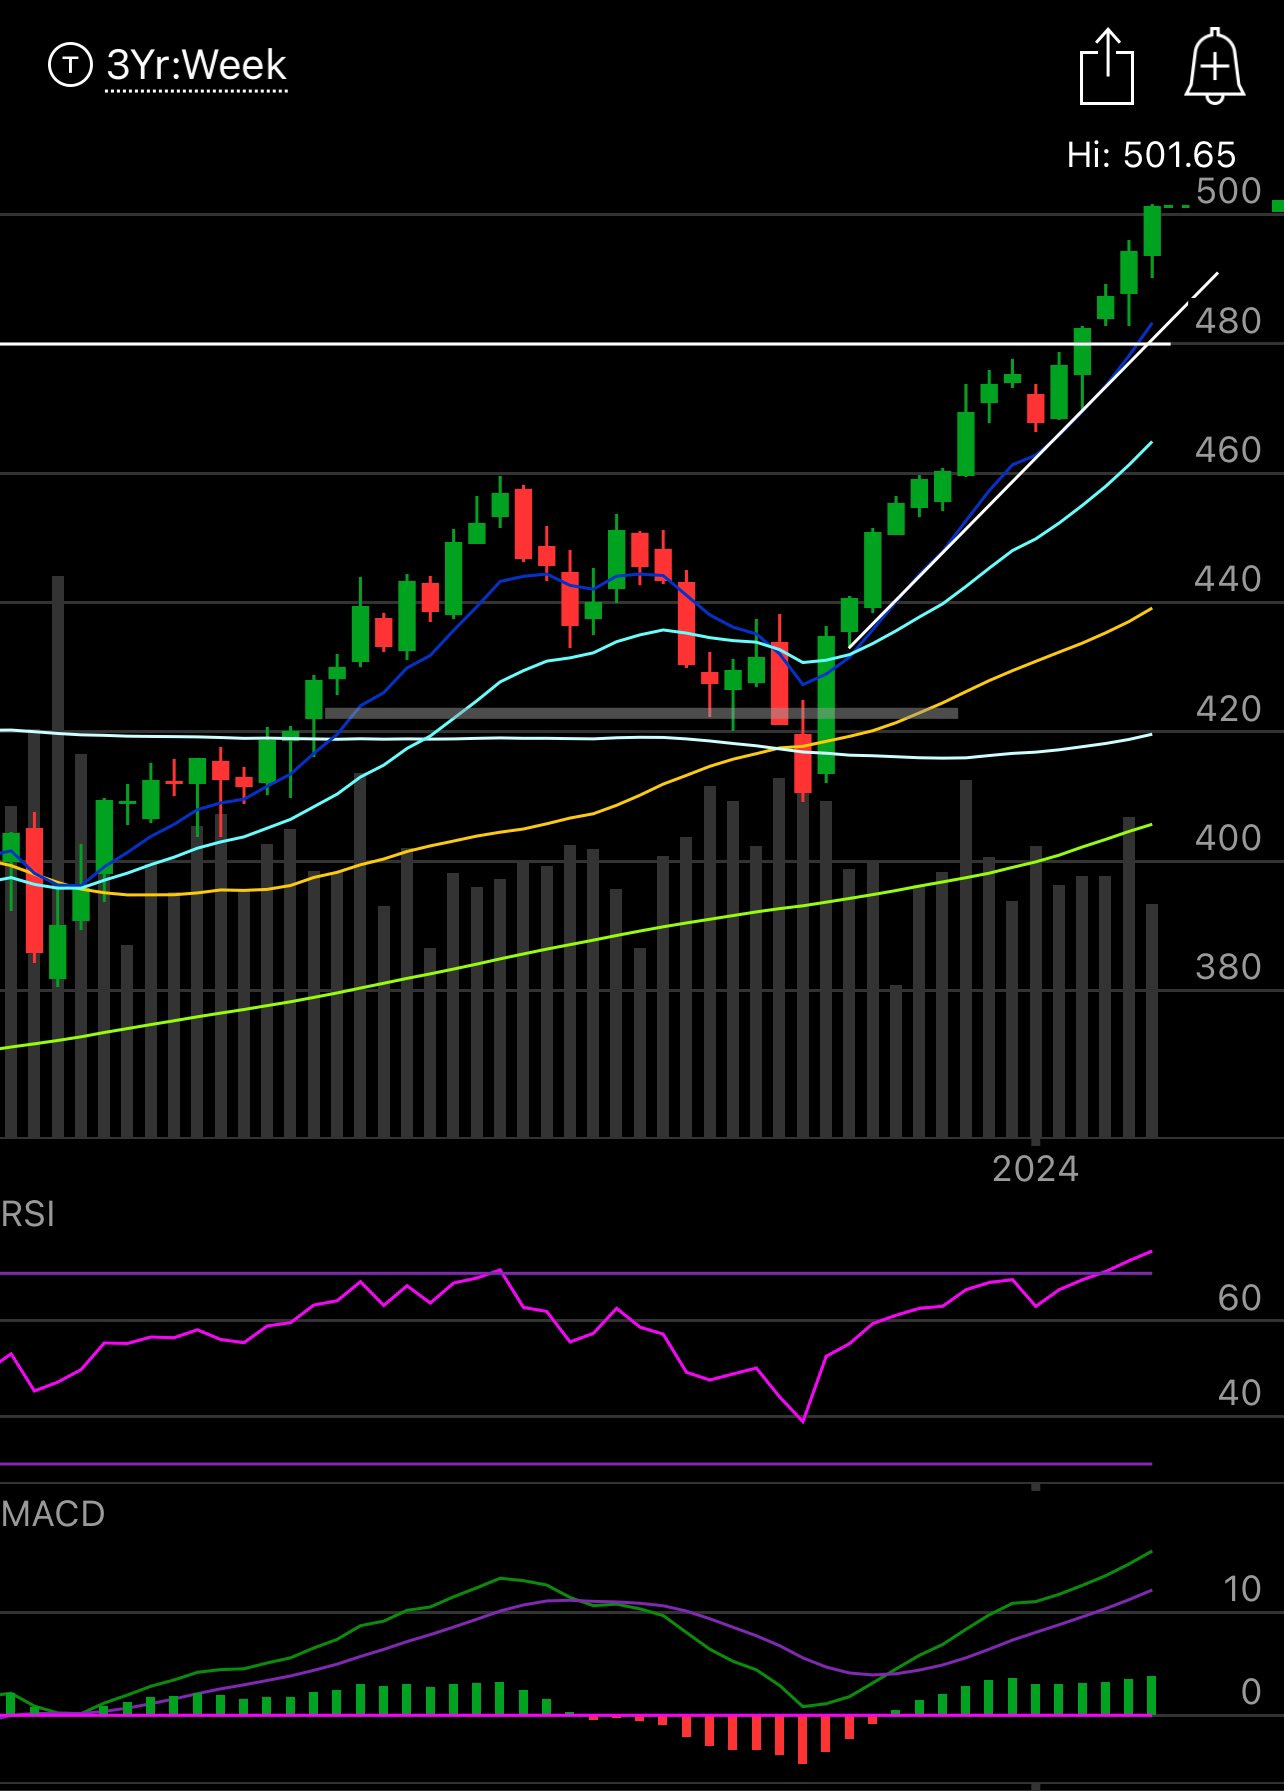
What a close yesterday, this run is now 14 green weeks in 15 tries on the SPY. Now, look at the trendline that I drew under this move up, you see that white line from early November? That is your cue on what is going to happen. We haven’t even pulled back to touch it in a month. As long as we’re over that trend, things are ok, below that, it is time to watch out. Why?
Because this always happens, look at the chart below zooming out and adding 2023, what do you see? Another uptrend, but I removed the line I drew because I want you see it without it being there. What do you see? An uptrend, that broke and it led to a multi week sell off. That’s all markets are. We trend in one direction, that trend breaks and we go the other direction until we settle down.
I’ve discussed this in the past but there’s many new people here constantly. Look at every market sell off we’ve had, these things do not come out of nowhere, here below is the covid crash. You see how we were in a perfect uptrend, then the first week we broke trend, that was your warning sign to get out, the market plunged after as you can see.
Look at 2018 when we had the fed panic crash, same story, an uptrend broke and we sold off hard. In the history or markets, a sell off has never happened without a trend breaking and names below key moving averages.
Here is the 2022 crash, without an uptrend line, can you spot where the trend broke?
All I’m trying to highlight is I’m constantly seeing tweets about people scared of the pullback coming. Is one coming? Sure, they always come, but the reality is as long as you are disciplined and just stick to the truth which is price action, then you will be ok. Simple rule of thumb for me, below the 21 ema on the chart you should either be out of a name or understand it is going to be weak for a period. That’s it. You can sell covered calls in the short term, but it isn’t that hard to understand why I focus daily on what names are over what moving averages. Those are your signs of strength.
Last weeks best idea didn’t work out as planned, but it did still work. That is why I prefer selling puts. I said sell the $380 put on GS and use the proceeds to follow that big $400 call buyer. If you had put on the trade below, even though Goldman did nothing and put in an inside week, the trade still would have worked because the $380 put was sold for more than you bought the $397.50 put which means you till got a net credit. If you bought the calls on their own, you lost money, but that is why you have to utilize these risk reversals, there are levels names should hold and GS did it closing at $384.26
.
This weeks best idea is a short and I hate suggesting these, but with the market hitting new highs, this name is performing so poorly and is trading near year lows a clear sign that this looks close to being wiped out by its biggest competitor. At over $120B market cap, there could be quite a ways down to go. 80% of trades I’ve logged this year on it have been bearish so why not, lets give it a shot. As always we’ll look at chart, options flow, analyst targets, and I will give a trade idea.
Keep reading with a 7-day free trial
Subscribe to The Running Of The Bulltards to keep reading this post and get 7 days of free access to the full post archives.


