2/4 Best Ideas For The Week Ahead
What a week we wrapped up. I think the earnings we saw posted from Apple, Google, and Amazon were inline with what most of us have been trying to tell the permabulls for a while. Earnings are going to be in decline. That is just reality, those SPX estimates are going to continue to fall when the largest companies are producing such bad results and we will be closer to $200 of earnings than the $225 estimates we had coming into this week. In even the rosiest of scenarios, we’re at over 20x earnings with a fed funds rate of basically 5%. You’re getting the same earnings yield with a P/E of 20x as you are with treasuries, the insanity in that is off the charts. Of course, we’re told it’s because we’re forward looking and that’s it, but the reality is the market has become a casino of 0DTE gamblers looking to get rich and they’re causing these huge moves. Want proof?
So I wouldn’t look at the recent action as anything more than a powerful move after a technical breakout, but the 0DTE call buyers are throwing gasoline on the fire.
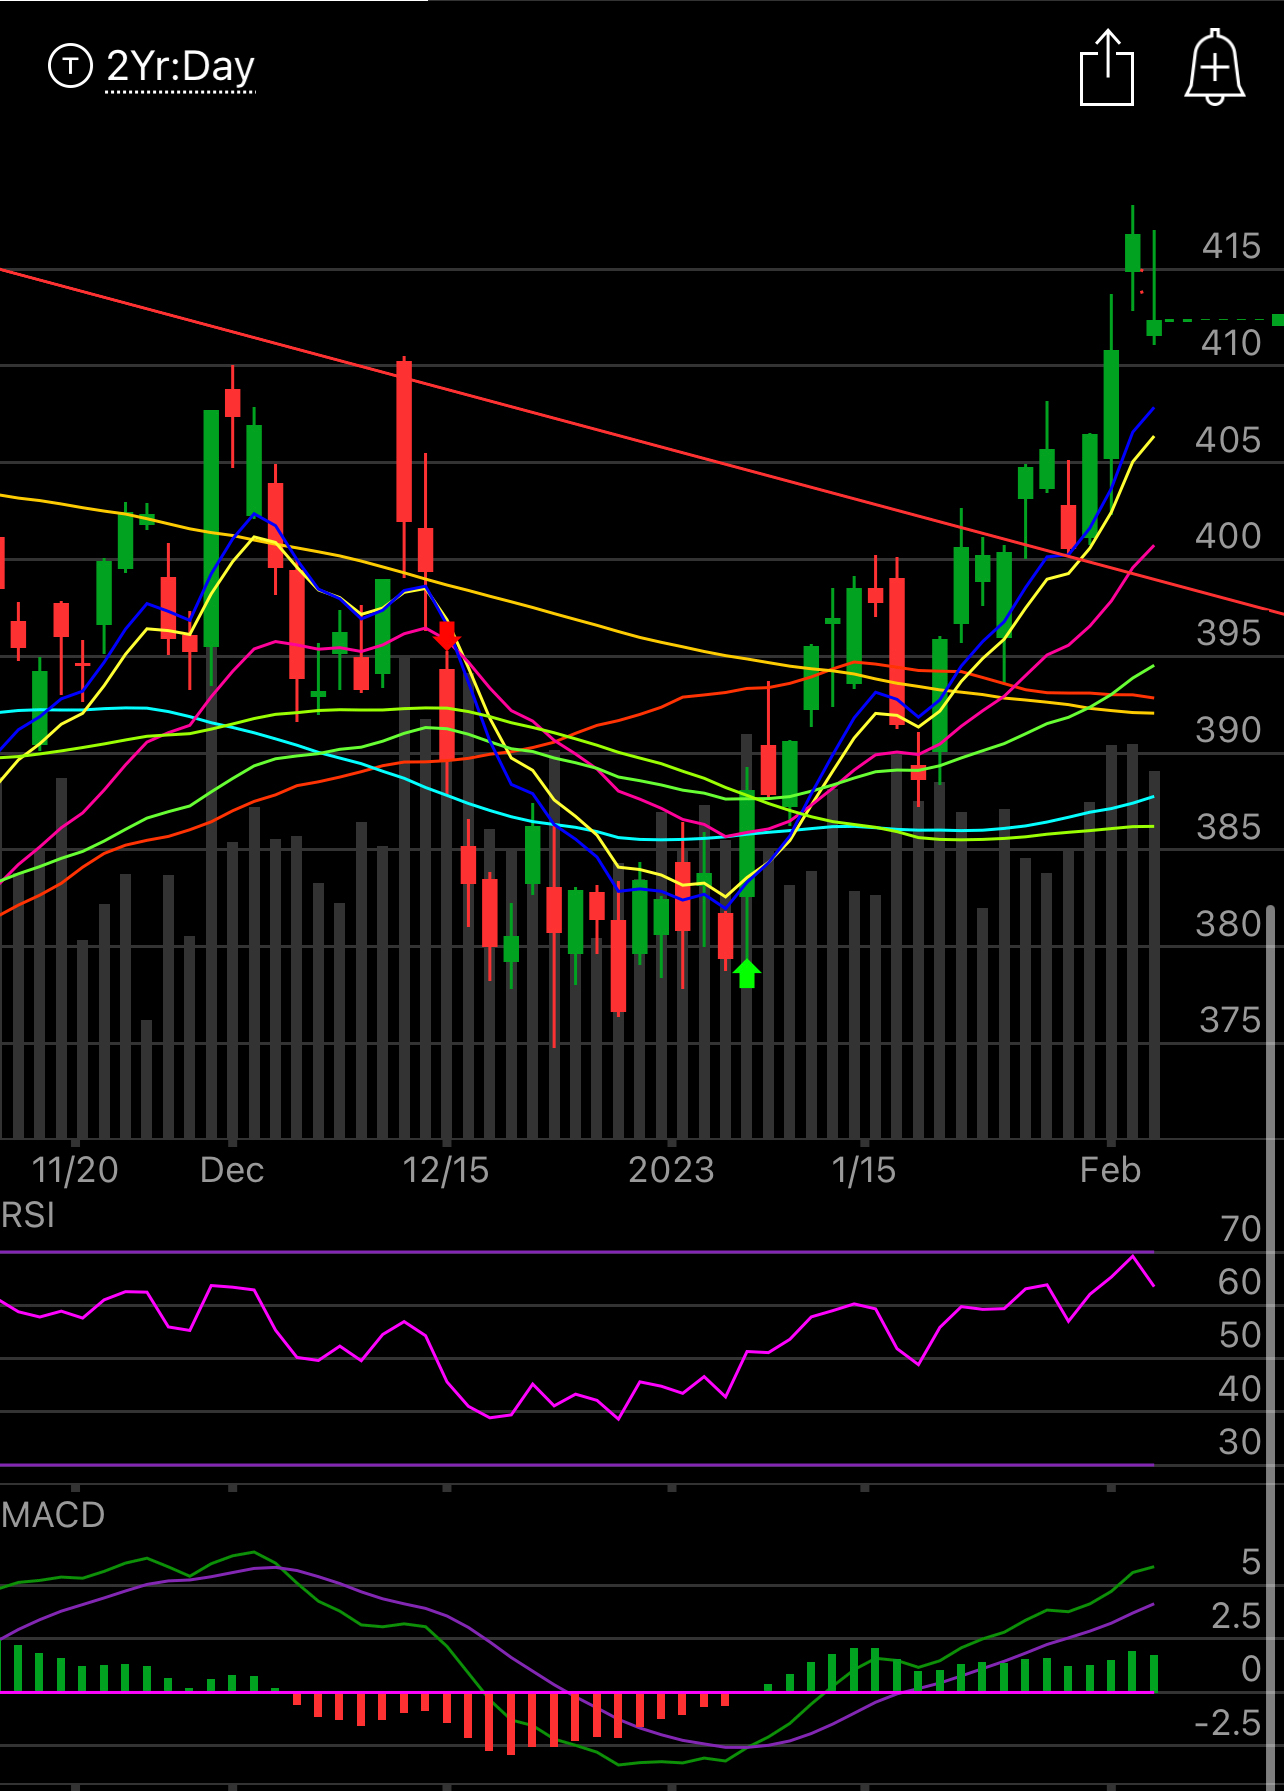
As you can see below he mentioned the last 6 sessions, look at how many sessions we’ve had since we broke that yearlong downtrend. You can see the gamma squeeze caused by the big players, they knew what they were doing. On a daily basis, the SPY still looks good, yesterday we closed with a green candle even with the nasty move down. We are a little extended still, way over even the 8 & 10 ema, but with all the moving averages now sloping up, there isn’t much to say that is bearish. There has been some serious buying going on we’ve had 1 red candle in the last 11 days. That is insane with all that is going on in our country and abroad. The RSI is looking near max overbought as you can see and we ticked right off it, for now I expect a little consolidation as the moving averages have to catch up to the candles.
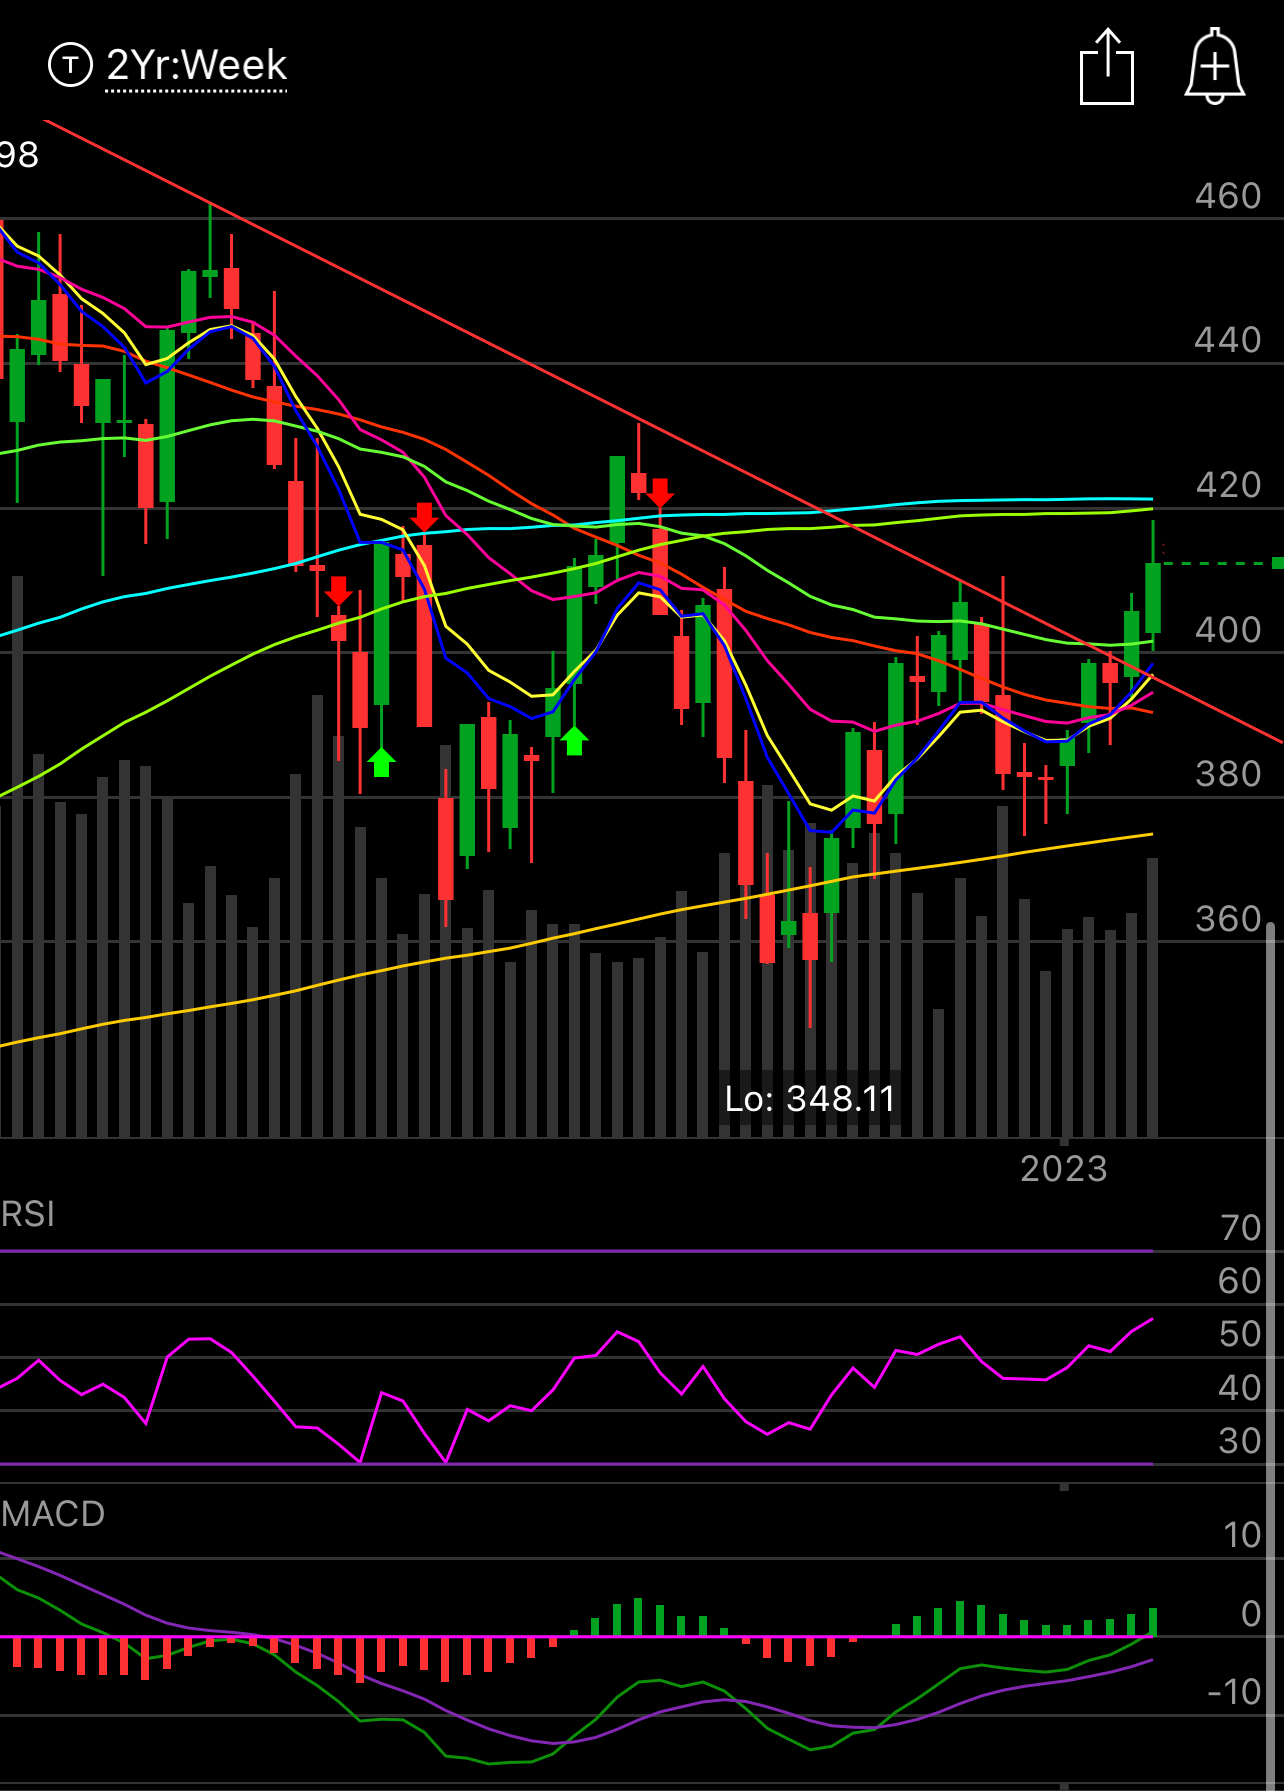
On a weekly basis you can see the major resistance above at 420, that is where we were slapped down. Still a good looking chart, I’m not sure what bears are looking at. For me, I know the economic data is awful, but the chart is showing buying and until I see an ugly confirmation candle breaking back down, I can’t be bearish on equities.
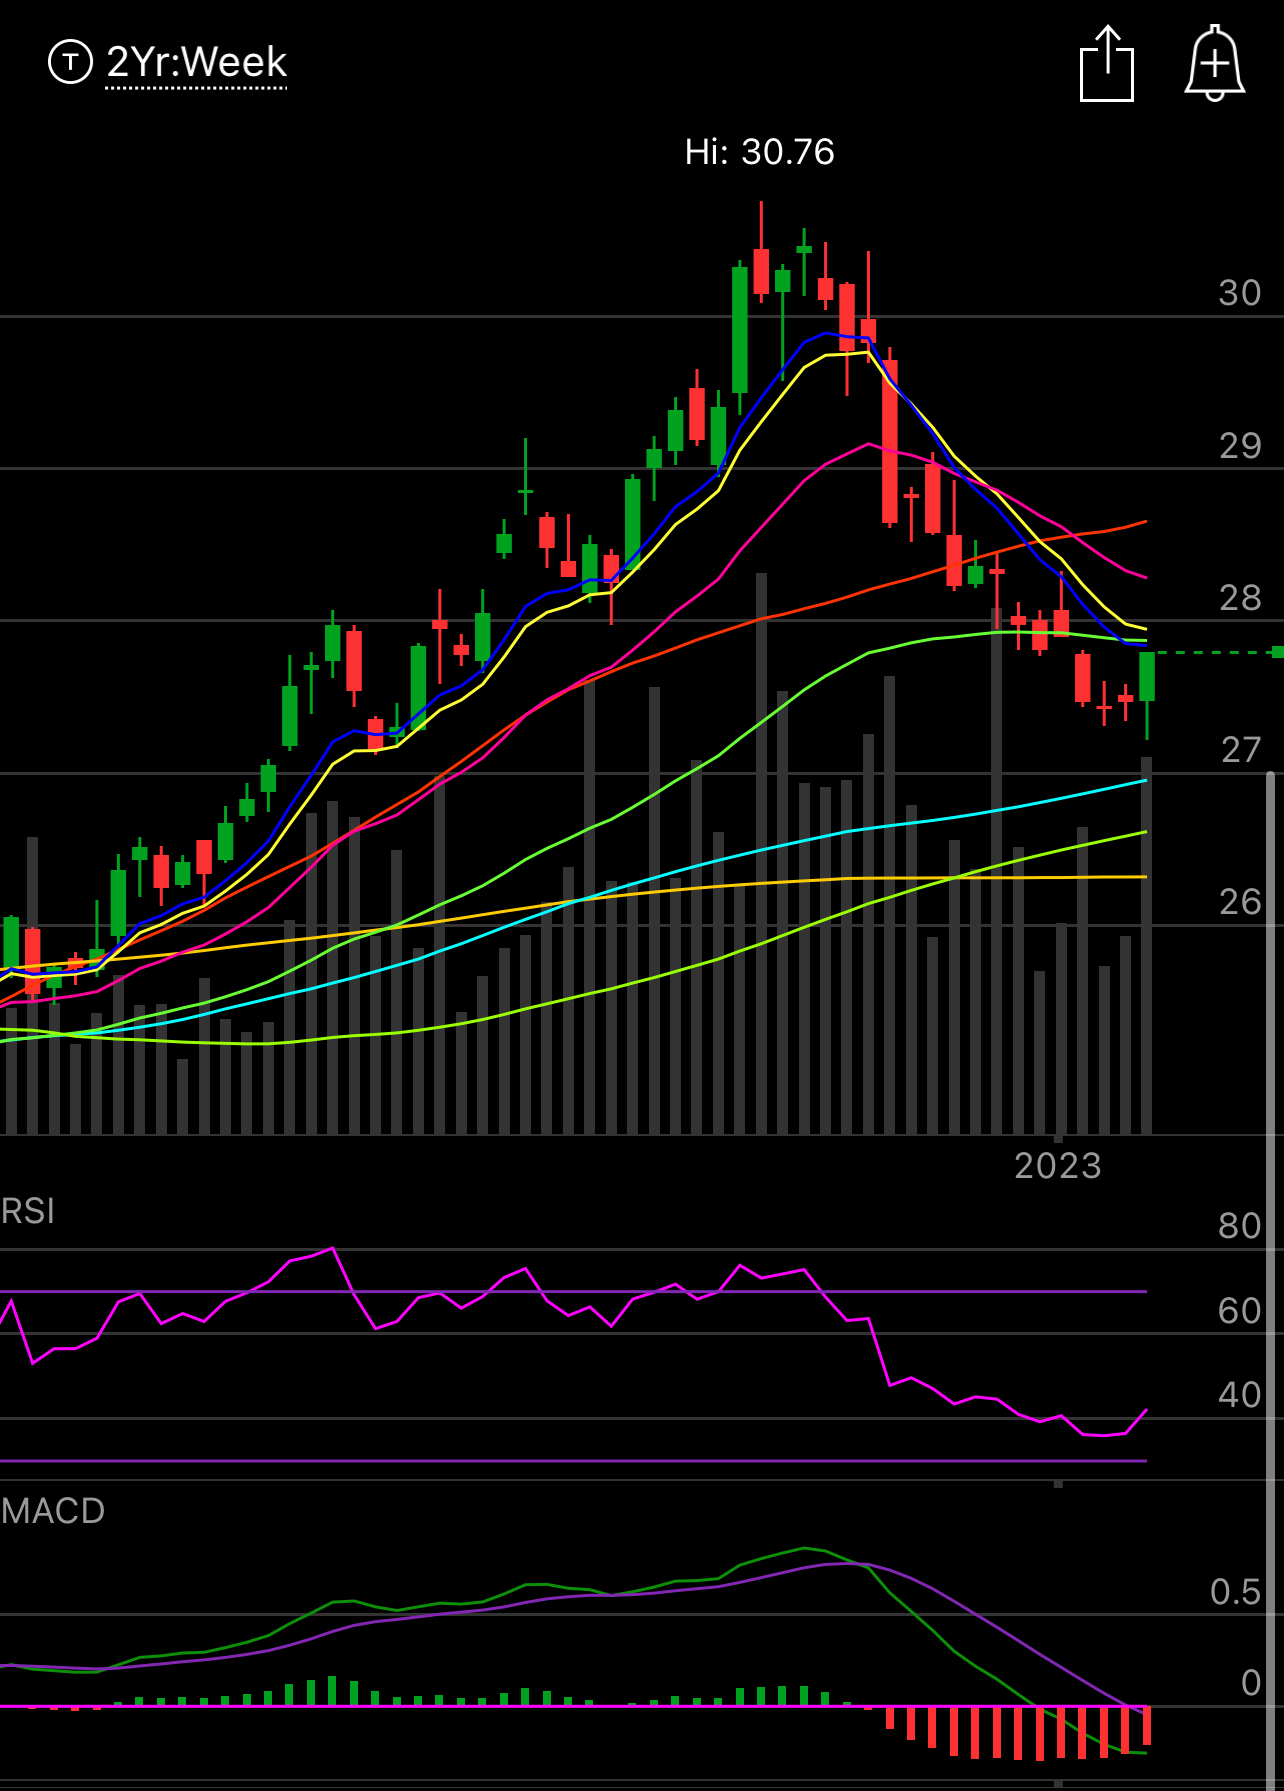
The dollar is starting to look like it wants to breakout below is etf UUP 0.00%↑ it tracks the dollar and you can see the weekly candle it put in. I mentioned this one previously and it’s been in a freefall being red 14 of the last 15 weeks. That fall in the dollar is what fueled that rally we just had. What happens if the dollar reverses? See how the highs on the dollar lined up with lows in our market? Stock bulls want a weak dollar and the candle last week says caution is warranted as the MACD curls up.
My Best Idea For The Week Ahead
For those that are new, every weekend I try to put together a few of charts of strength, 8 this week + a single best idea based on options flows I’m tracking in my database. I look for what has had a very large amount of unusual flows and I try to line it up with a chart that looks good. I do not buy these directly, typically I sell puts as I always try to get in a name lower, I just try to provide the information, you can play it however you want with shares, calls, whatever. So enjoy the charts below, if you have questions just ask


