3/26 Best Idea For The Week Ahead + 10 Charts Of Interest.
Another week passed where we got no clarity on the direction to come. The SPY closed in the same region it did last week between the uptrend and downtrend leaving us to guess on what comes next. While on the surface this looks pretty ho hum, under the hood it appears something is brewing.
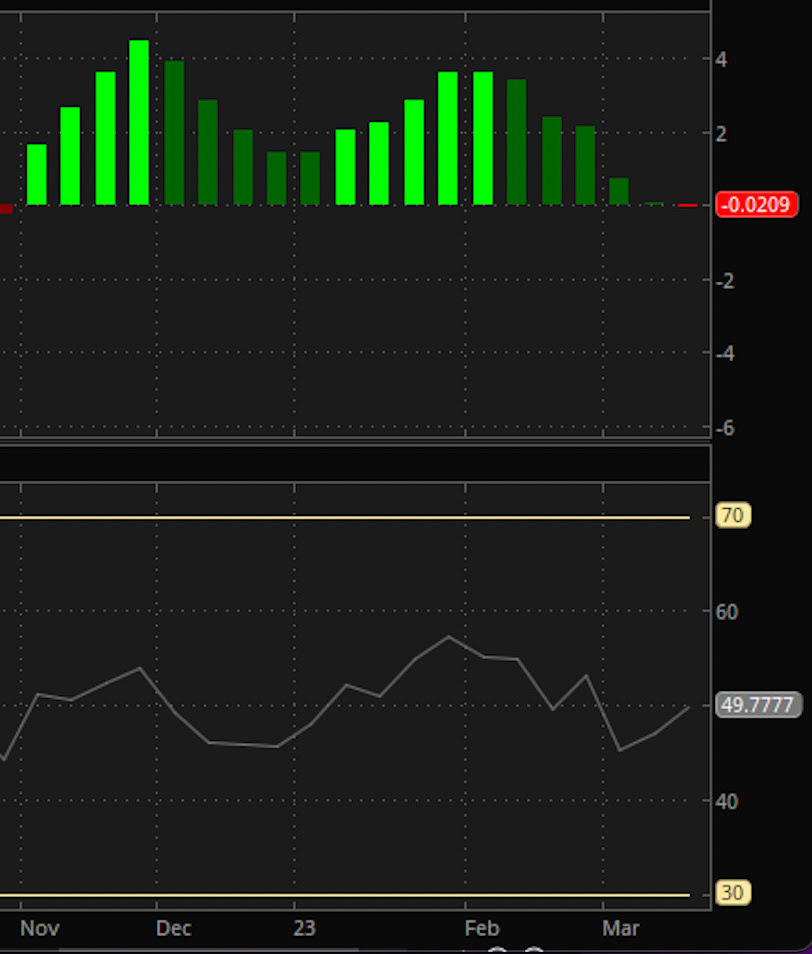
The MACD did turn red for the first time in 5 months as you can see zoomed in below. Typically, this means there will be a period of weakness ahead. How long will it last? Nobody knows. It could be a week, could be a month, late 2021 as you can see above led to nearly a year of weakness. The flip in September last year wasn’t quite as long, either way, it appears we’re in for a little bumpy patch.
The QQQ remains the strongest sector as people continue to flee financials and oil for the safety of megacap tech. You can see the clear continuation off the bullish engulfing candle we discussed last week. Just remember these candles they’re simply showing you is money accumulating or selling a ticker, that’s it, so many like to think these are nonsense, but the reality is, last week’s candle showed the QQQ tested lower and was promptly met by buyers, the followthrough is not surprising.
The weakness is in the IWM, small caps, as those continue to break down. Friday everything was green but small caps. The trendline on the bottom below is going back to the GFC lows in 2008, the other trendline is going back to the covid lows. As you can see the last 2 weeks, the IWM finally broke down, the next 2 weeks of weakness were also not a surprise and until the IWM can reclaim that trend, small caps are just doing to be weak. So this is a sector I would avoid for the time being. The MACD and RSI are confirming these thoughts as both are pointing down.
Trends
Below are the open trends I’ve noted from when I began this dataset in late January. To this point I’ve logged a little over 3,100 unusual trades in nearly 800 names since then which has allowed me to share with you better data on the directional trends of the unusual options activity every day. It could be argued looking a the 2 month trends below that the bullish and bearish trends do indeed catch onto what will be strong and what will be weak with decent accuracy.
1 Week
1 Month
2 Month
Best Idea For The Week Ahead
You’re going to get alot of movement this coming week, it is quarter expiry on Friday. I typically do not like to make moves into that because you’re going to see alot of big and unusual moves as funds look to dress up/down their holdings here. There aren’t going to be many funds that want to explain to clients why they’re still long banks or why they don’t have enough tech, so I expect to see more strength and weakness from the usual suspects here. Just remember there will always be a bull market somewhere and the charts are how they’re found, let’s look at a name that put a nice bullish engulfing candle on the weekly chart last week


