3/30 Best Idea For The Week Ahead
Back on 1/27 I wrote up COP as my weekend best idea, back then the stock was $112.xx and energy looked to be setting up nicely so I wrote up the piece in the link below.
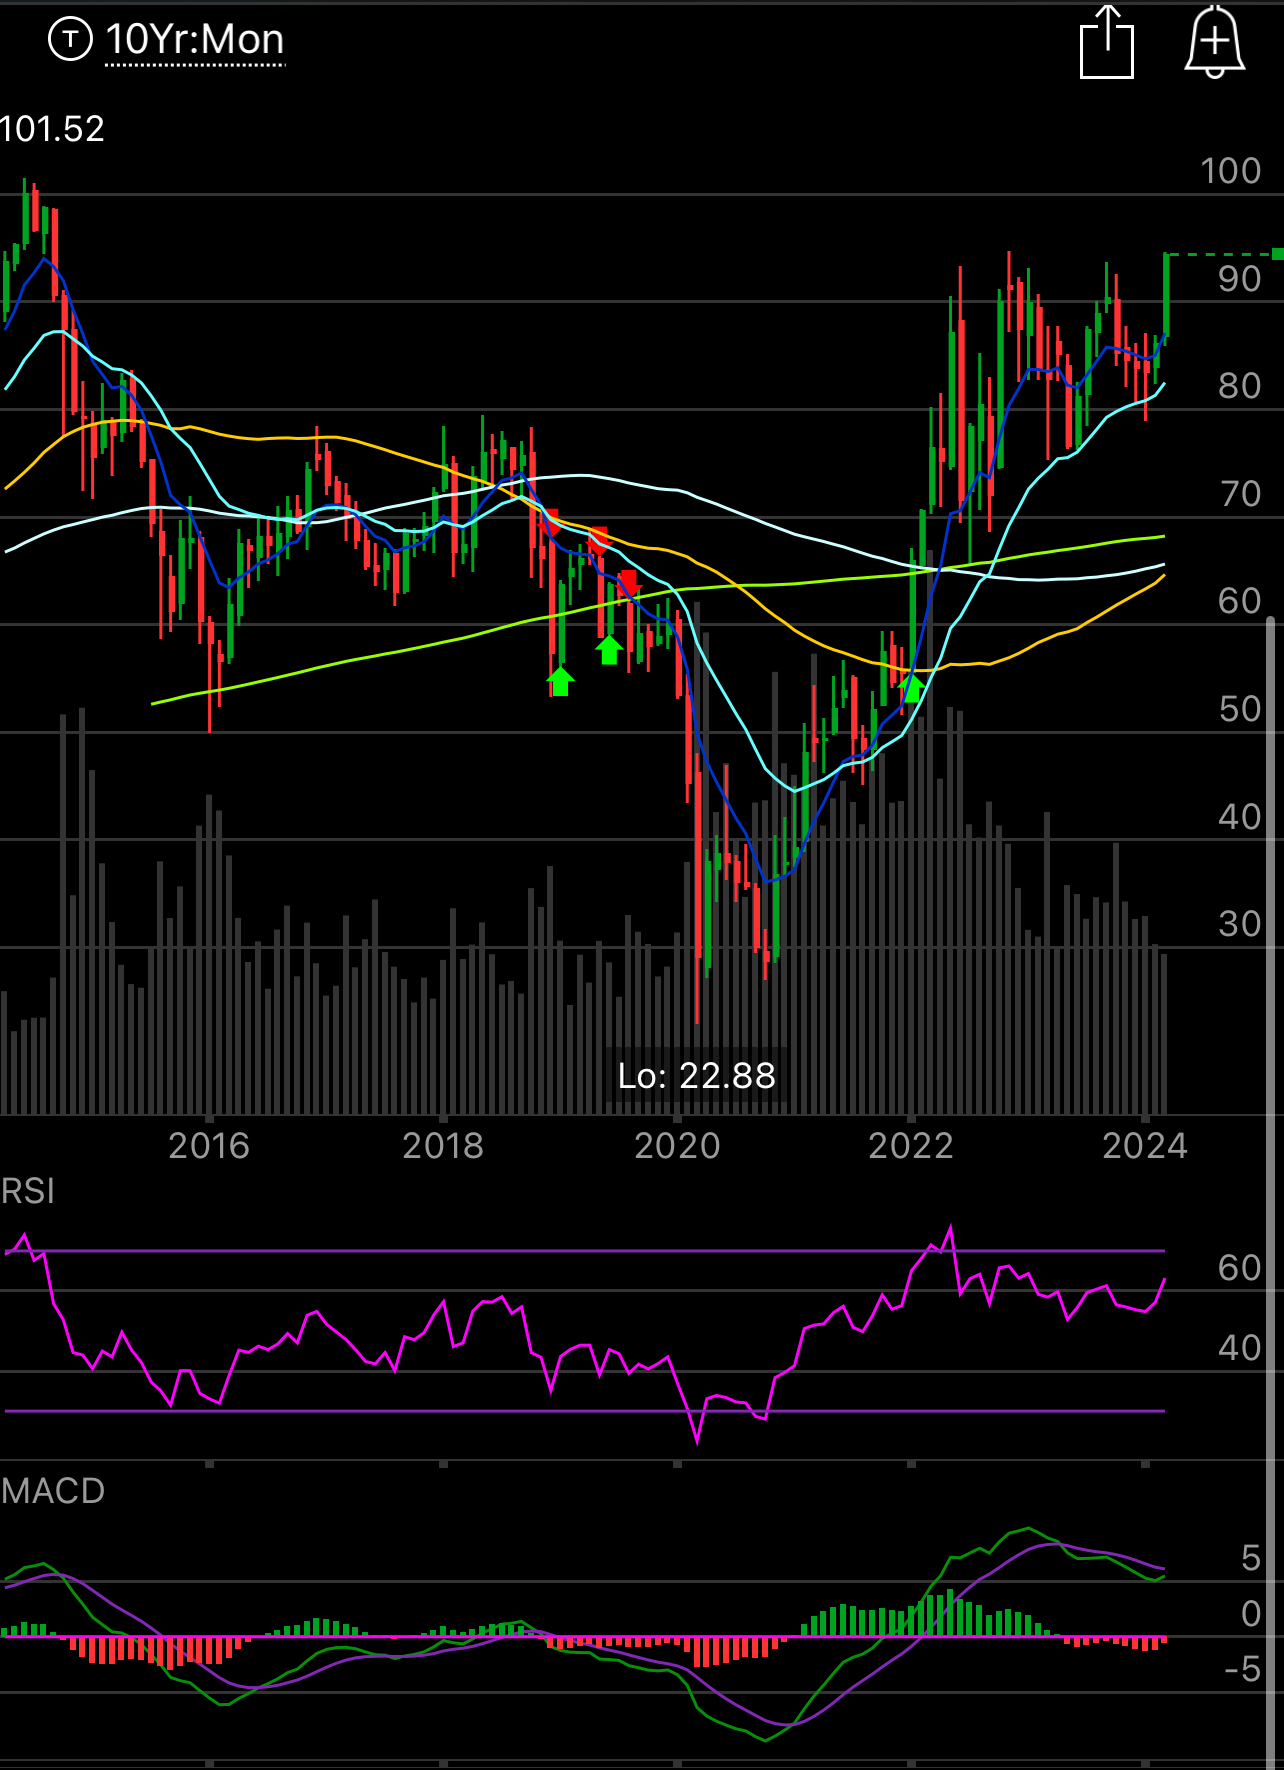
Yesterday the XLE closed at 94.40, the highest monthly close it has seen since 2015! The energy trade is back! The funny thing with most investors is when a name hits highs, they don’t to buy it, they want to buy at lows. The exact opposite should be happening. The reason being is when a stock is at lows, it is there because everyone has sold it and it is weak, that is why things like PYPL have taken years to work, when you buy a breakout, you’re buying strength and as a trader, strength is what makes you. That’s why you see charts breakout and continue on.
Here was the main thing, the screen grab below was what I wrote then. COP had reclaimed the 200 day, the green line, which was a big sign the bottom was in. The longer wicks showed it tested lower and found buyers, a bullish sign. When a candle closes at the lows of the day or has a long wick above that means it did not find buyers. Notice the monthly chart of the XLE above closed at the highs, so it found buyers all month long. That is why I say charts tell a story, because they do, they’re a visual representation of all the buying and selling going on in a time frame of your choice.
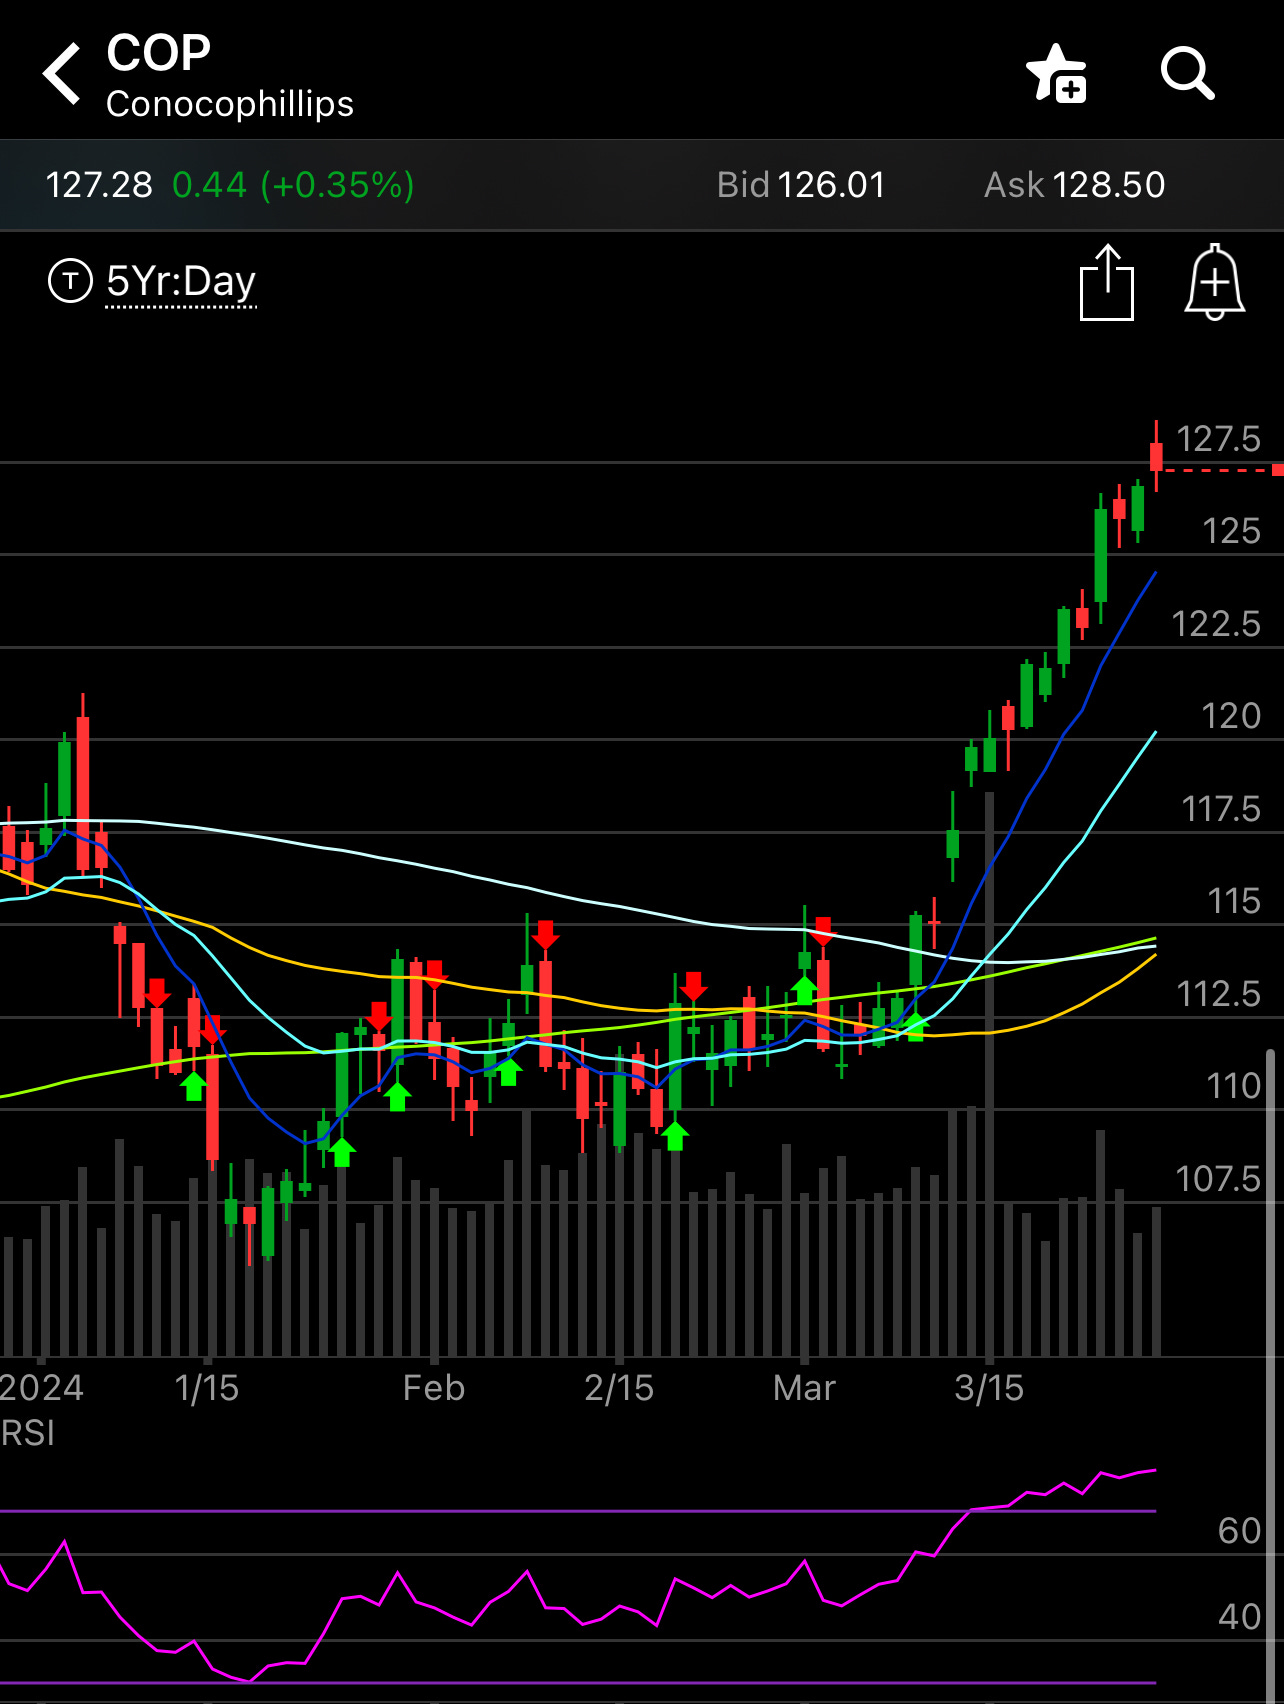
Here is COP today. You can see for the next couple weeks it kept toying with that 200 day, that is what stocks do, they shake impatient people out constantly, it took nearly 45 days but after multiple tests it finally broke out and ripped to 127.50 in a straight line in just 12 sessions. Stocks also love to burn theta which is why I prefer selling puts short term to buying them. If a stock stays flat, the calls you buy are hit, but if you sell puts, they slowly decay.
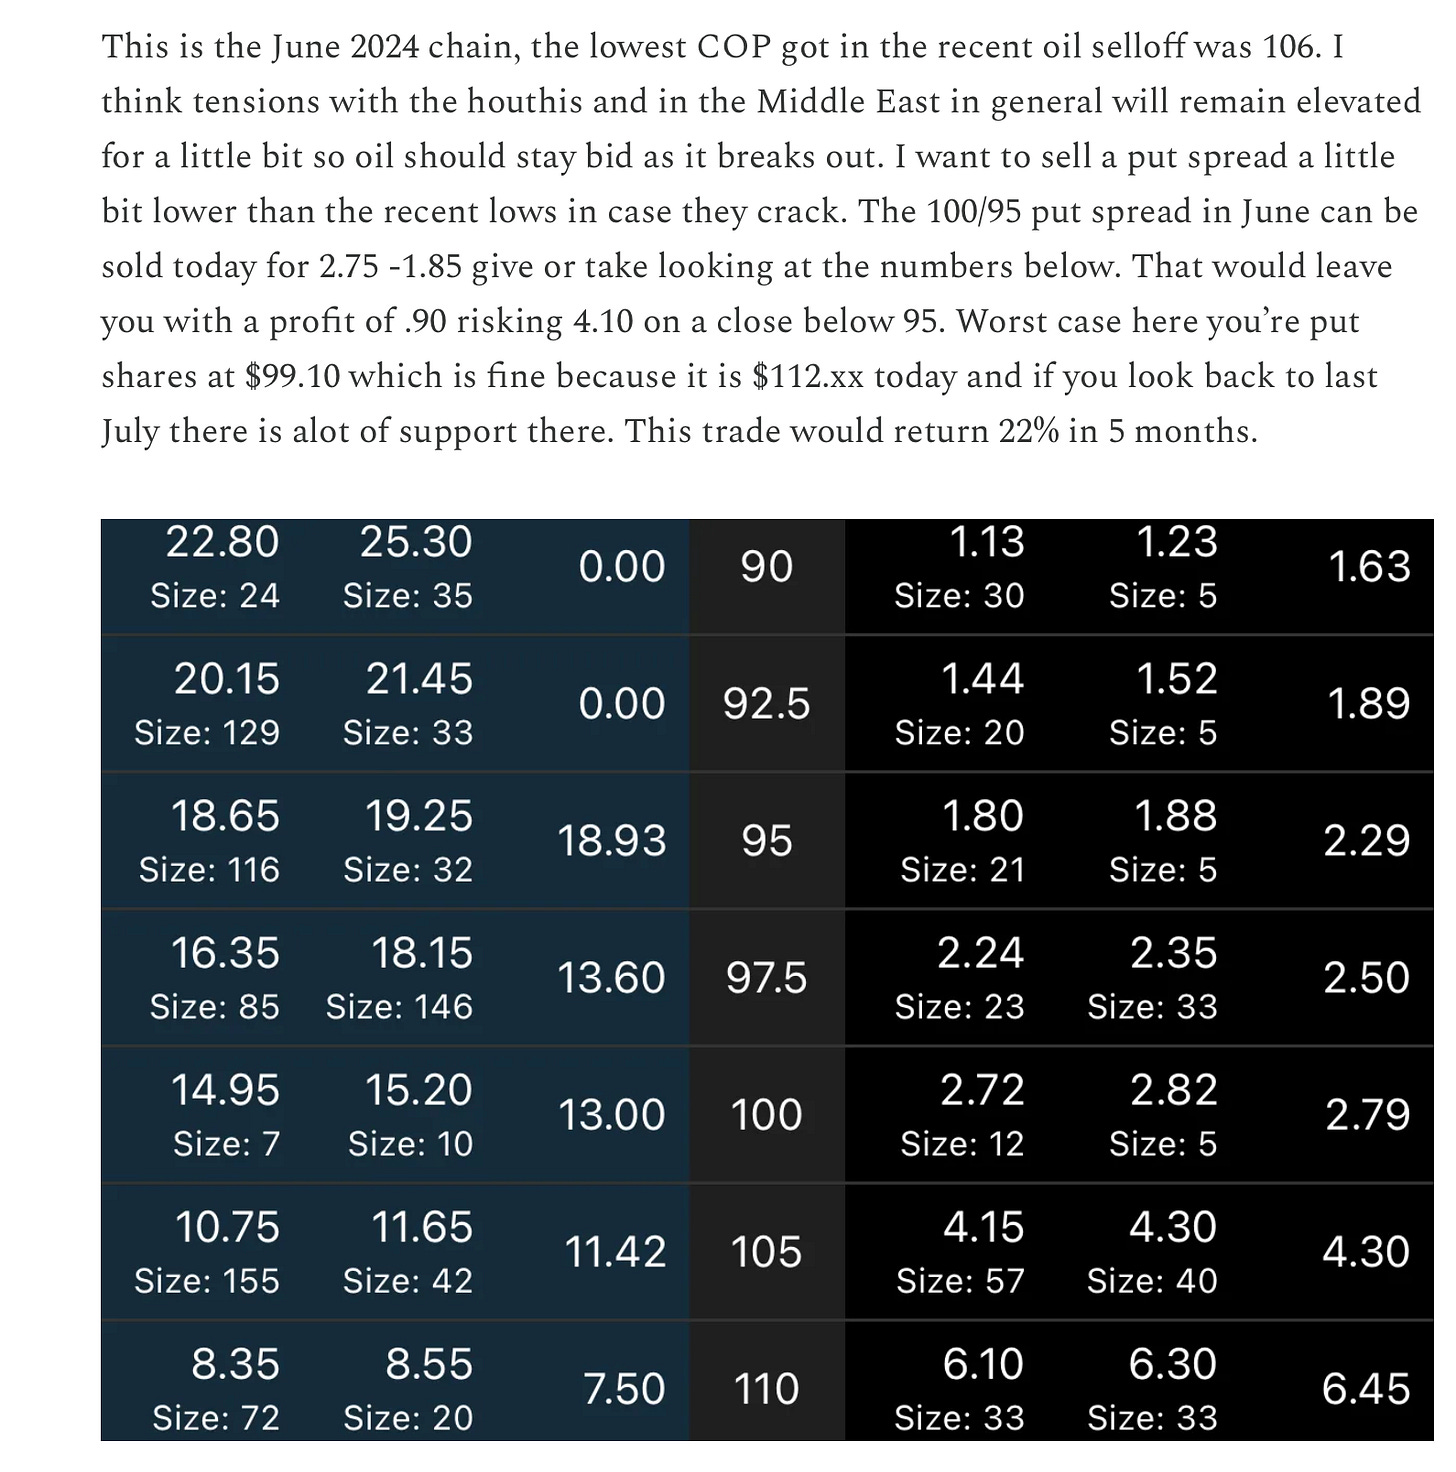
The specific trade I highlighted back then was this June 2024 put spread below to sell for .90, today that same spread is worth .09 and you could close it today 3 months early for a 90% gain.
You can see that first chart I posted above where 106 was the low of the range, the reason I sold 100/95 puts is because I knew 106 should be give or take the bottom. I knew looking at the XLE, the energy sector etf, oil was looking like a bottom was forming and I took that information and I sold puts lower because even though 106 should’ve been the bottom, my offer was to buy the stock for below $100 in June. Selling puts is all about making the deal at the price you want. There is no need to give into pressure and pay the current price, you dictate the level you want to buy.
Sure, put selling isn’t as sexy as people buying calls and showing you their 700% gains, but those people also don’t show you how many times they got their teeth kicked in also. My objective is to post trade setups that work at a very high clip or trades that you can put on for free using risk reversals. Whatever it is, the point of options is to lower your risk profile, but somehow fintwit has turned into the purpose of options is to buy 0DTE calls and try to get rich while potentially bankrupting you.
With that little rant on why put selling wins, here is this weeks best idea with options flow, charts and how I would play it. This name is the largest component in an ETF that just closed at multi year highs, if the ETF is breaking out, this name will lead the way.


