3/6 Recap
Today’s session was an ugly one for bulls everything tested higher levels and was sold. There are a lot of datapoints coming out this week, as we seemingly have every week and it constantly has everyone on edge. I wasn’t expecting much until we got more clarity after chairman Powell spoke tomorrow.
SPY
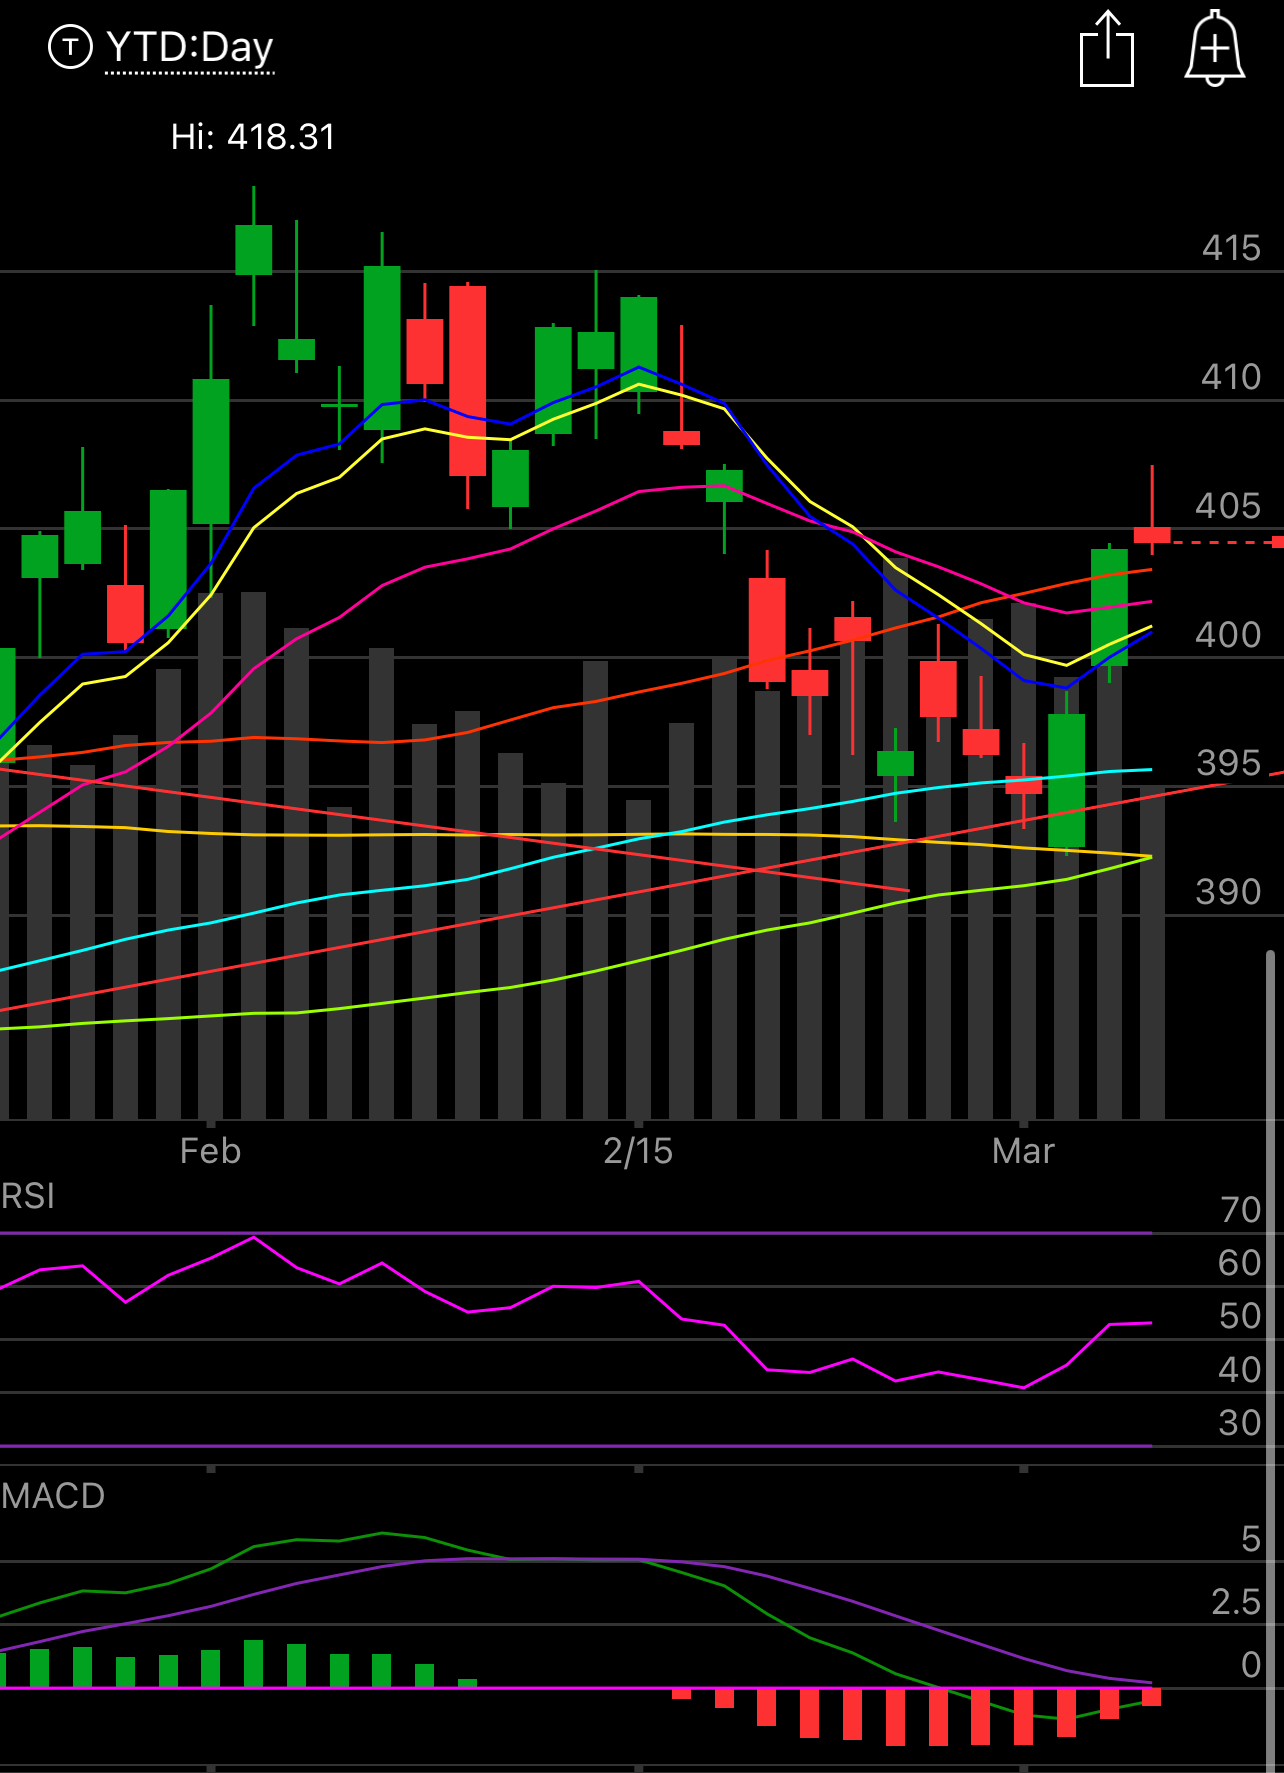
This remains over all the key moving averages, it has strength although today’s candle was ugly. There was a lot of selling today, that is natural before Powell speaks. He could very well flush us lower, but as long as we are over that red uptrend line you see below at 395, the market is in the same uptrend it has been in since October, below that, the thesis and my positioning would change. The MACD as you can see is curling up and could potentially flip to positive if the rest of the week goes well. It’s all on Powell tomorrow and payrolls on Friday.
QQQ
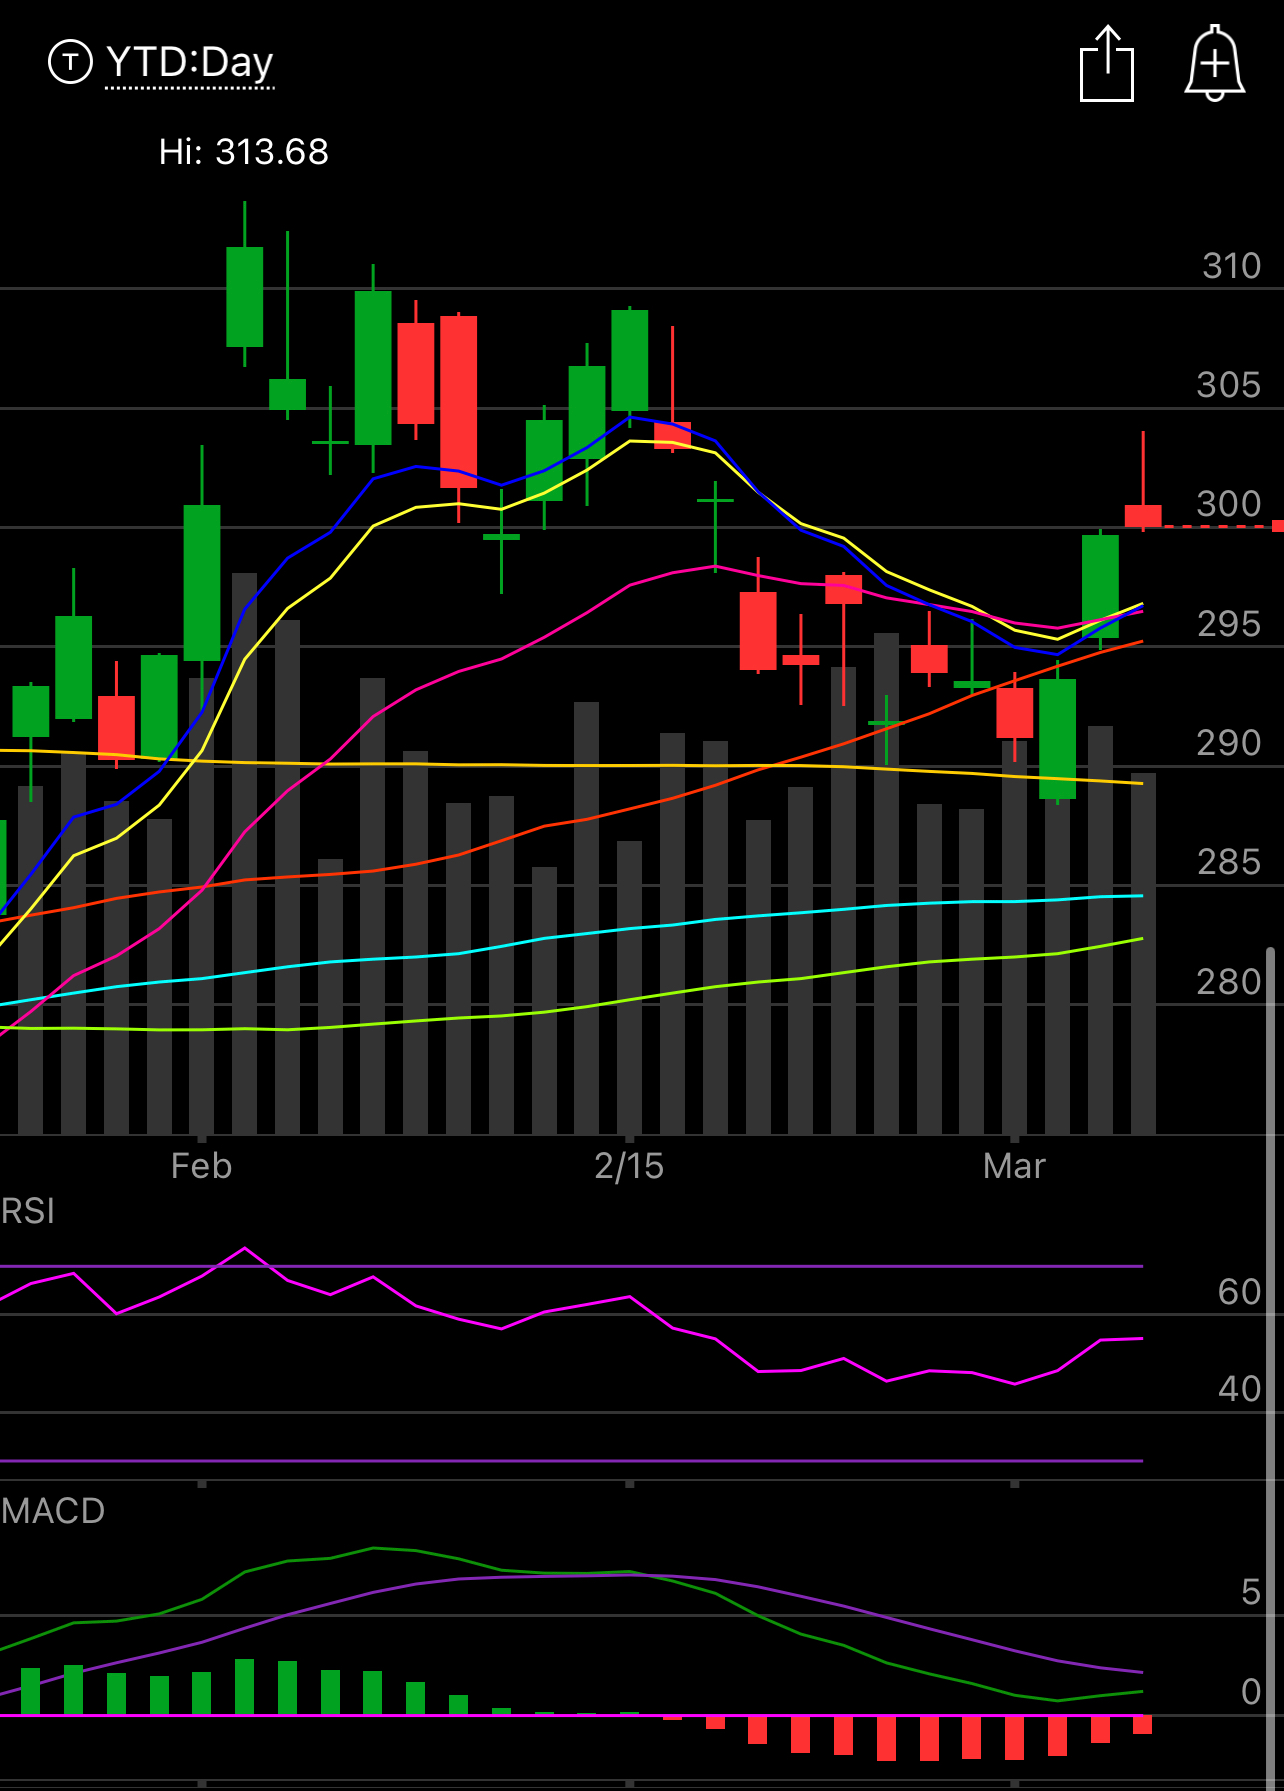
This had maybe the worst candle of them all with a pretty clear gravestone signaling a test higher that was full rejected, closing at the lows which shows buyers were exhausted. While it is still over all the key moving averages I won’t see this is finished, but today’s candle typically signals an incoming reversal and with an open gap at 294 below perhaps we test lower and just chop around. That was my call at the beginning of the year and I still think we mostly do nothing in 2023.
IWM
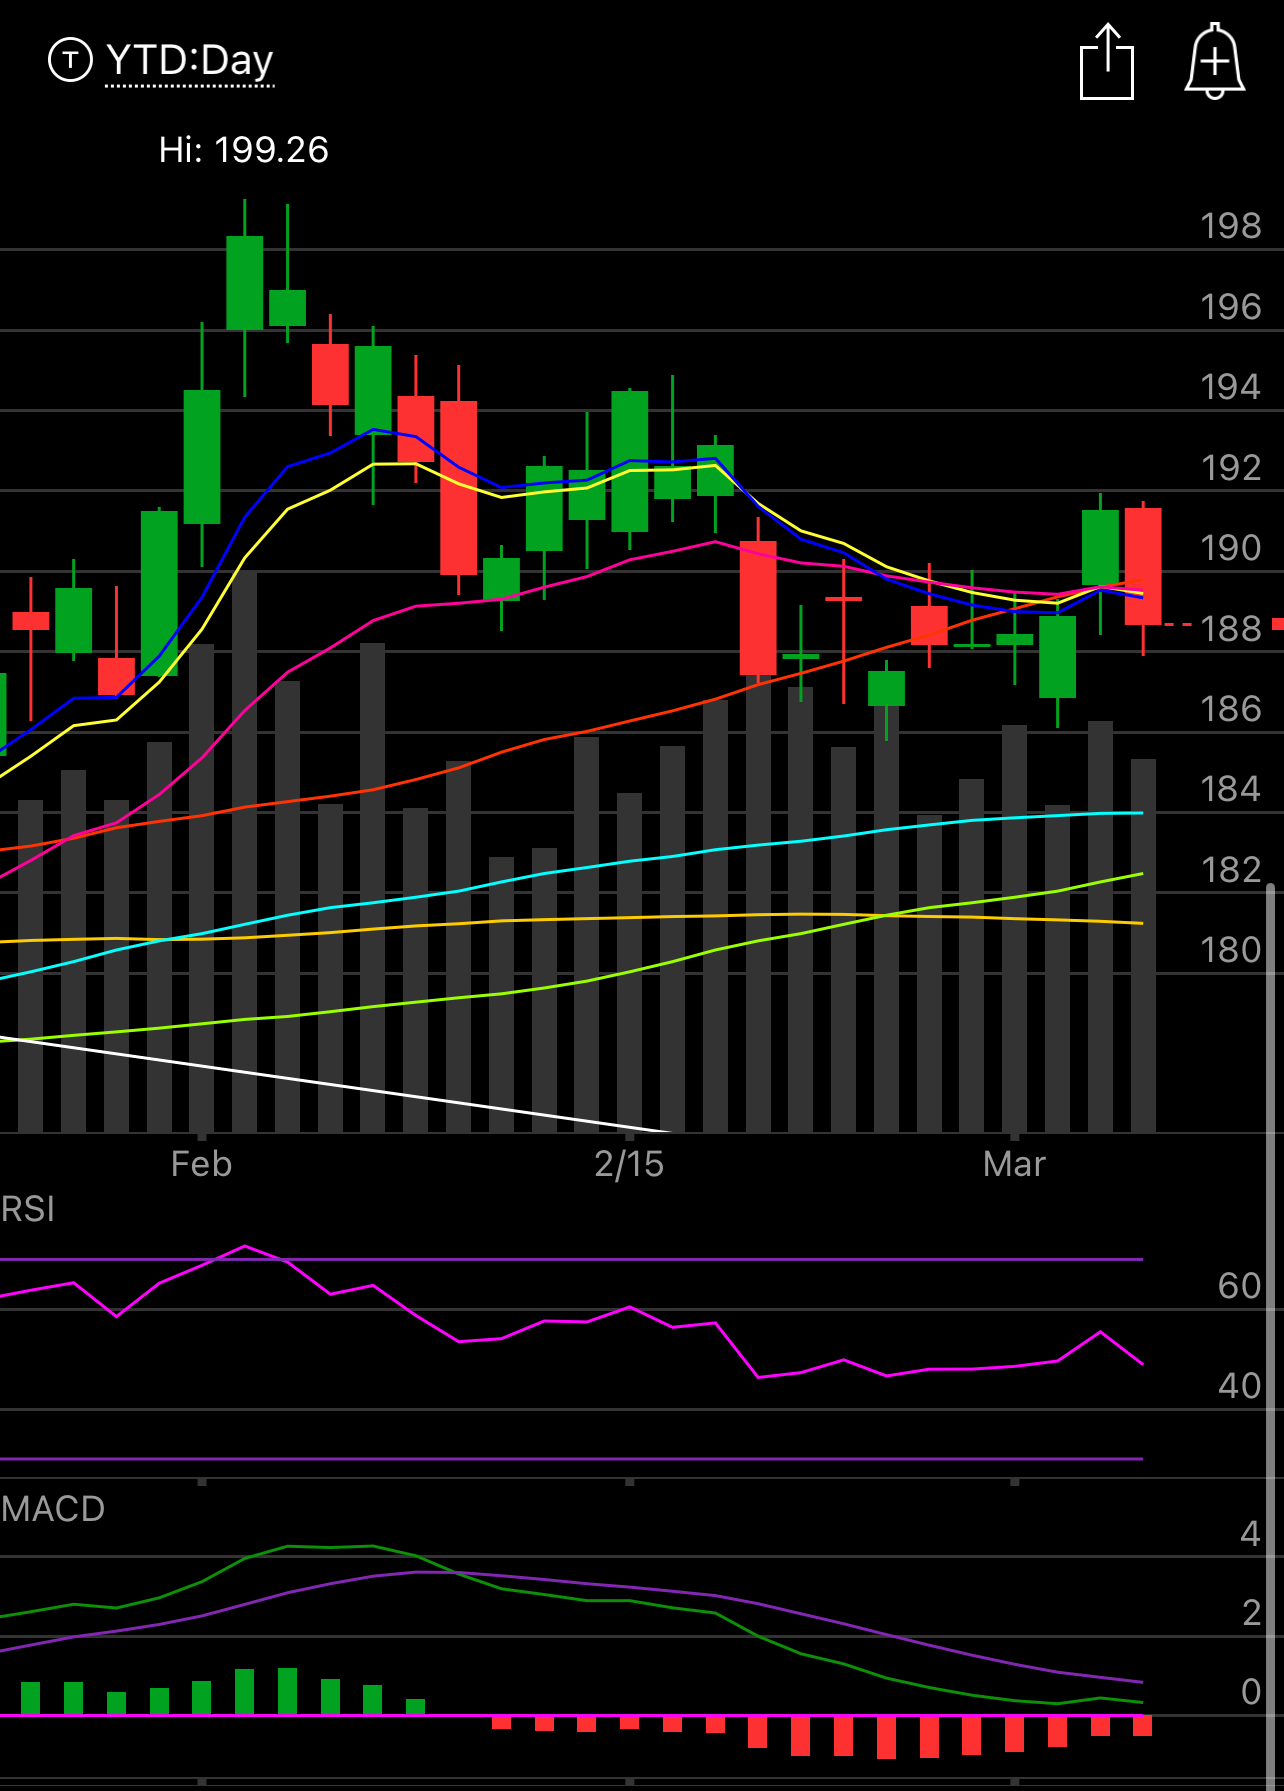
This led lower all day and it has been the beacon of strength all year. It was down almost 2% and ARKK specifically had a huge put buy I saw in April at 41 with 8,000 of those bought. Small caps have run hard and it may be time for them to cool off as we slowly realize a soft landing isn’t a plausible scenario.
Today’s Unusual Options Activity & What Stood Out.
There’s a lot of new people here today and I just want to explain what this section is. Everyday I try to sort through the countless options trades placed to filter to what I deem the most unusual institutional activity. Within this you have calls bought(bullish), puts bought(bearish), puts sold(bullish) and risk reversals which are the most aggressive type of trade you can place and I note them as either a “P” first which means a put was sold to finance the calls noted or a “C” first which is bearish meaning a call was sold to fund the puts. These trades are obviously the most interesting to me because they show excessive bullish/bearishness, but they’re few and far between and often in names I don’t care to trade.
What do I with this data, I compile it into a database to see developing trends. As a put seller, my focus is finding the direction of a move, and selling very conservative puts into it. Otherwise will use this data to buy calls, to sell calls, to buy puts, you name it. The data is simply direction, what you do with it is up to you. Typically I aim to provide 60+ trades a day, somedays there are more, rarely there is less. Today I noted 70 unusual trades. You can look at the volume inside your brokerage to verify all these trades as well. Here is today’s dataset


