3/8 Recap
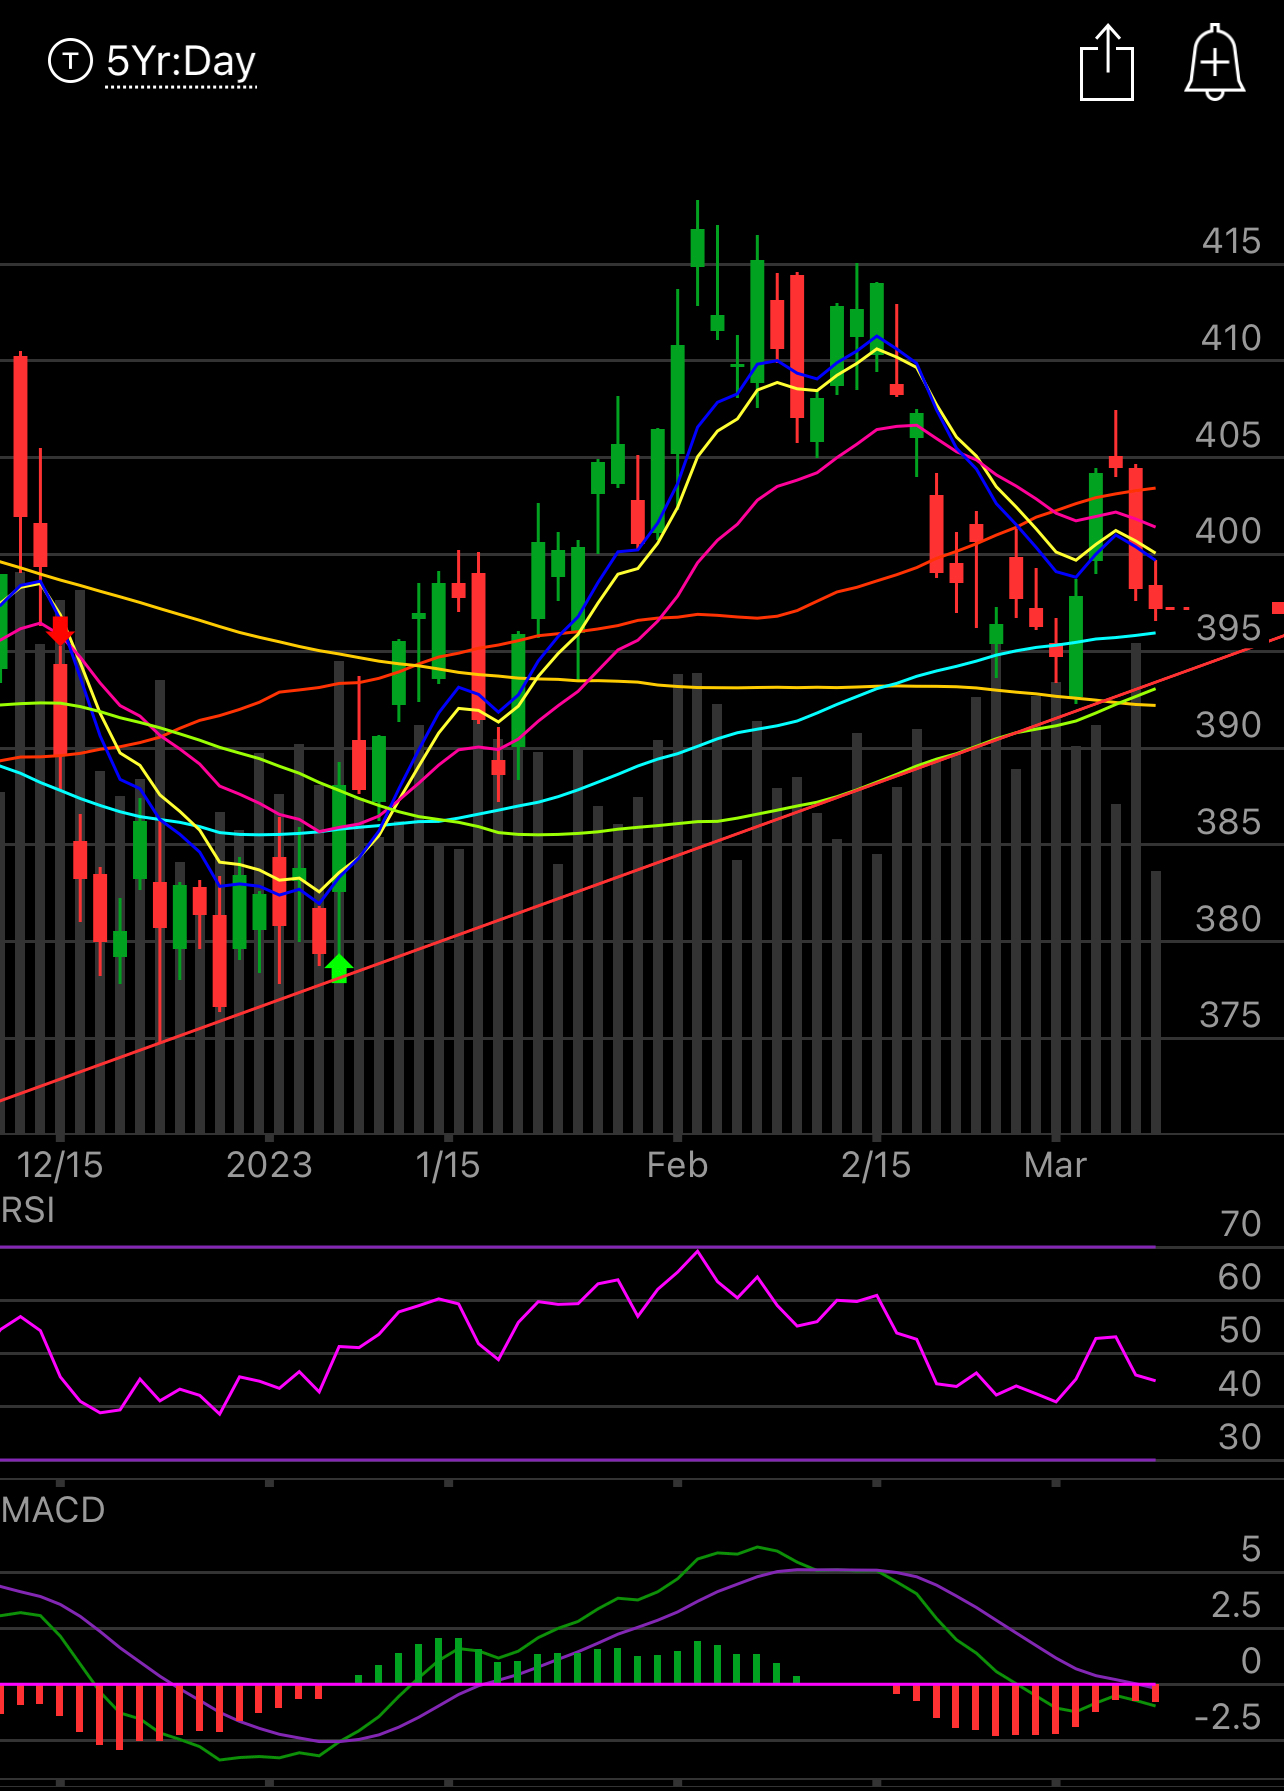
We continue to trade weak below a lot of key moving averages but mostly flat as I write this. The market likely won’t do much until we get this payroll number Friday and that should decide whether we’re going to finally break this multi month uptrend or continue higher. As you can see below we’re heading right back to that trendline where we last based and bounced in December. In yesterday’s recap you can see it going back October. As we continue to languish below al the moving averages including the 8/10 ema, weakness will persist. The MACD and RSI both remain in positions of vulnerability and there really isn’t much to say other than we’re still in an uptrend, but we’re on the edge of falling into the abyss. I still stand by my January 1 call that this remains a year of no significant returns. As we go sideways, those who sell puts will do great like us in here, the rest of the market will just be chop as we absorb one bad datapoint after another for the rest of 2023.
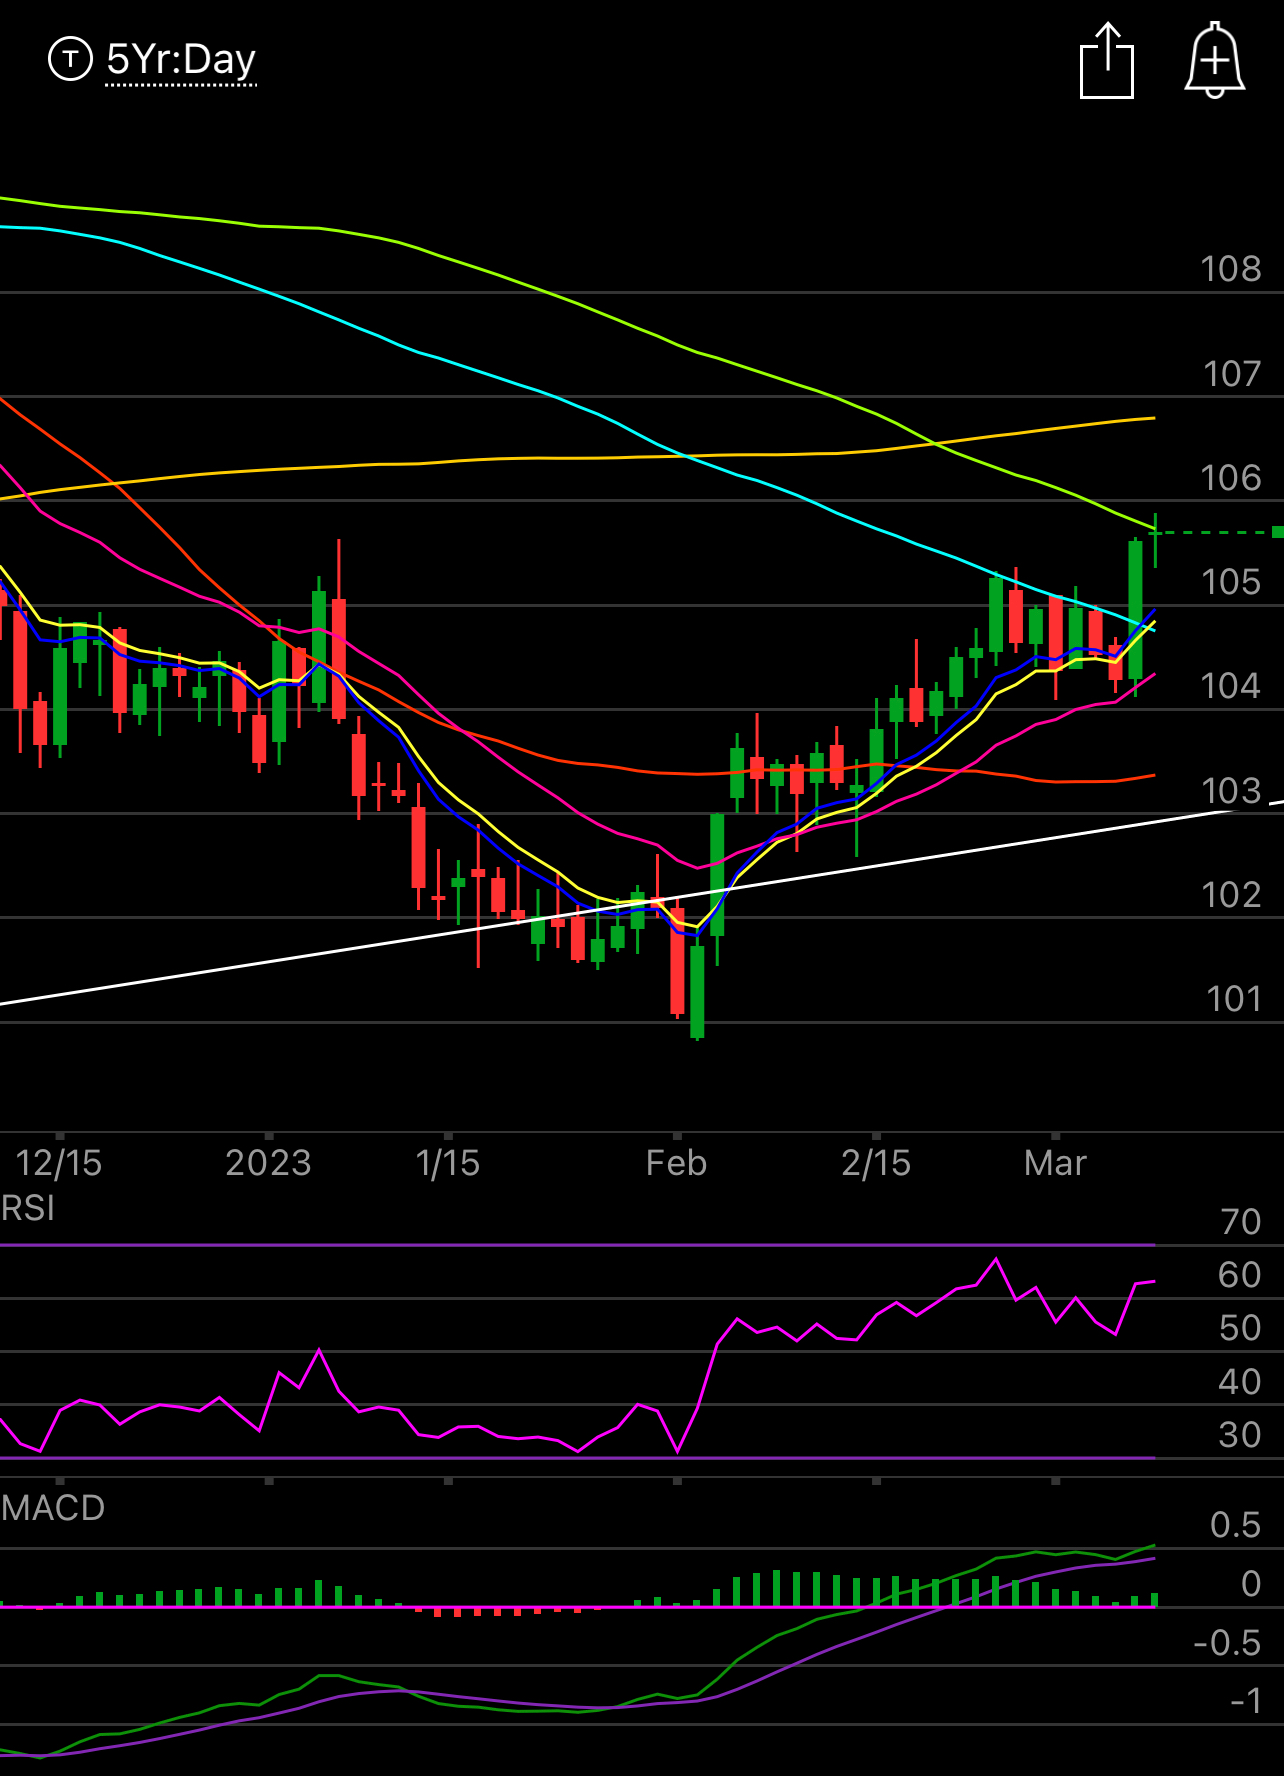
The Dollar remains firmly bullish breaking out which will continue to pressure equities. If you want equities to rise, the dollar needs to calm down and it just hasn’t in over 5 weeks. The hope for bull is that maybe this moving average can reject it and push lower so equities can rise, but with banks now talking a 6% FFR today and a 70% chance of a 50 bps hike next meeting, it’s going to be hard to cool this off.
Trends
Yesterday I only posted the 2 week trends from my database and I figured why not add longer term trends so you all could see longer timeframes developing. I also added the 1 month today, you can see the date range on the side. Again the bull/bear score is just the net of the total trades in my database ie 11 trade count and bull score of 9 means that of the unusual sized trades I noted, 10 were bullish and 1 was bearish. You will see below one of the bearish names has 8 trades and a bear score of -2 that simply means 3 trades were bullish and 5 were bearish.
This data is important to note because you could have a smaller name with only a bull score of 4 and all 4 trades were bullish, larger names have more activity within them and you’re going to get more on each side. For me, I hold a name with a perfect score with no bearish action in higher regard even if it has a lower bullish score. As you can see below, the top one on here is 14 for 14 meaning there wasn’t a single bearish trade in unusual size that I noted and that makes sense with the large move it just had.
2 Week Trends


