
4/15 Best Idea For The Week Ahead.

As I did last week, in the interest of making the posts shorter, I’m going to just post my best idea for the week ahead today, the unusual options flow that goes with it, the charts, and an actionable way to play it. Tomorrow, in a separate post, I will have an earnings preview going over individual names reporting in the week ahead and all their options flows and charts.
Also before I get into the name for this weekend, I wanted to talk about a question I just got from someone on yesterday’s post about the table I post daily that I thought may clear up questions for others. The table I post daily is simply a list of the oddest action that I have noted daily, remember these are for my personal notes that I’m publishing daily. There are millions of trades that flow in and I’m breaking them down into the weirdest ones so to speak based on historical context of specific names. 1,000 contracts in one name is odd, but it is not in say Apple. So for me, the specific number of contracts is not relevant as I am just a put seller and I just want to find which name is strong and I want to sell puts in the right direction. That is my style, others in here are daytraders, they buy calls and shares, others are trend traders and they want to see which names look ready to pop based on the table of trends I post, basically everyone has a different style.
What everyone is here for is the data, which is terribly expensive to obtain from the source, thousands of dollars a month. I looked around at the other services available to retail investors, they do not break data down for you, they let you filter by ticker and see every trade placed in an individual name, that doesn’t really do much but force you to spend hours researching name by name. My value proposition is that I cut out all the nonsense for you and give you a list of specific odd trades to save you time. I try to get this out with 2 hours left in the day now so that you have time to do whatever you want with it intraday because for many who buy calls or shares, a stock may gap up the next day on news from unusual flow, for me as a put seller, this isn’t as important to me, but I realize the needs of others here as everyone has a different trading style. I am just providing the data the market offers, that is all the table is.
I know it’s a little confusing at first, but I’m here to answer questions for you whenever so if you’re confused just ask here or in email.
Trade Of The Week
Last week SLV took off, that was a very good trade for the week, the flows and the chart aligned and it worked out well, I did mention in the recap thursday that SLV looked overheated and due to likely cool off and sure enough yesterday it did retreat by 1.8%, overall a very nice week in the name, I am still in the puts I sold in June that I noted.
This weeks name saw 5 unusual sized trades this week which is quite a bit for a $33B market cap. It is a good name, with some high quality funds involved. Let’s take a look at:
CVE
The Options Flow
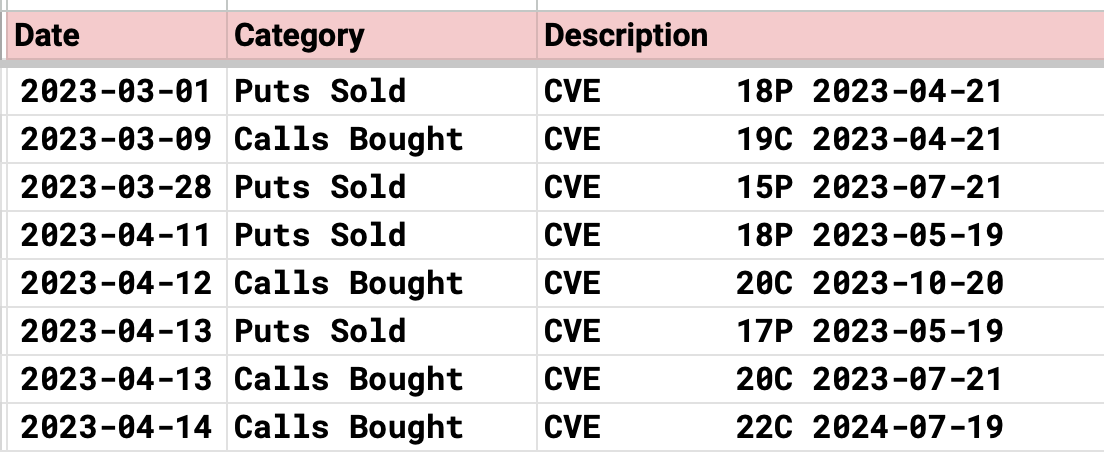
Right off the bat you can see the trades placed just this week. 5 times past week institutional investors went after this name. Puts were sold at 17 and 18 in May while calls were bought at 20 and 22 later in the year. This is an energy name. Last month there were puts sold at 15 in July along with 18 in April expiring this coming week.
The Charts
The charts are not the prettiest, that isn’t in question, but directionally, the option flows are bullish and there is always a way to play a name regardless of the chart so I will get into that part below.
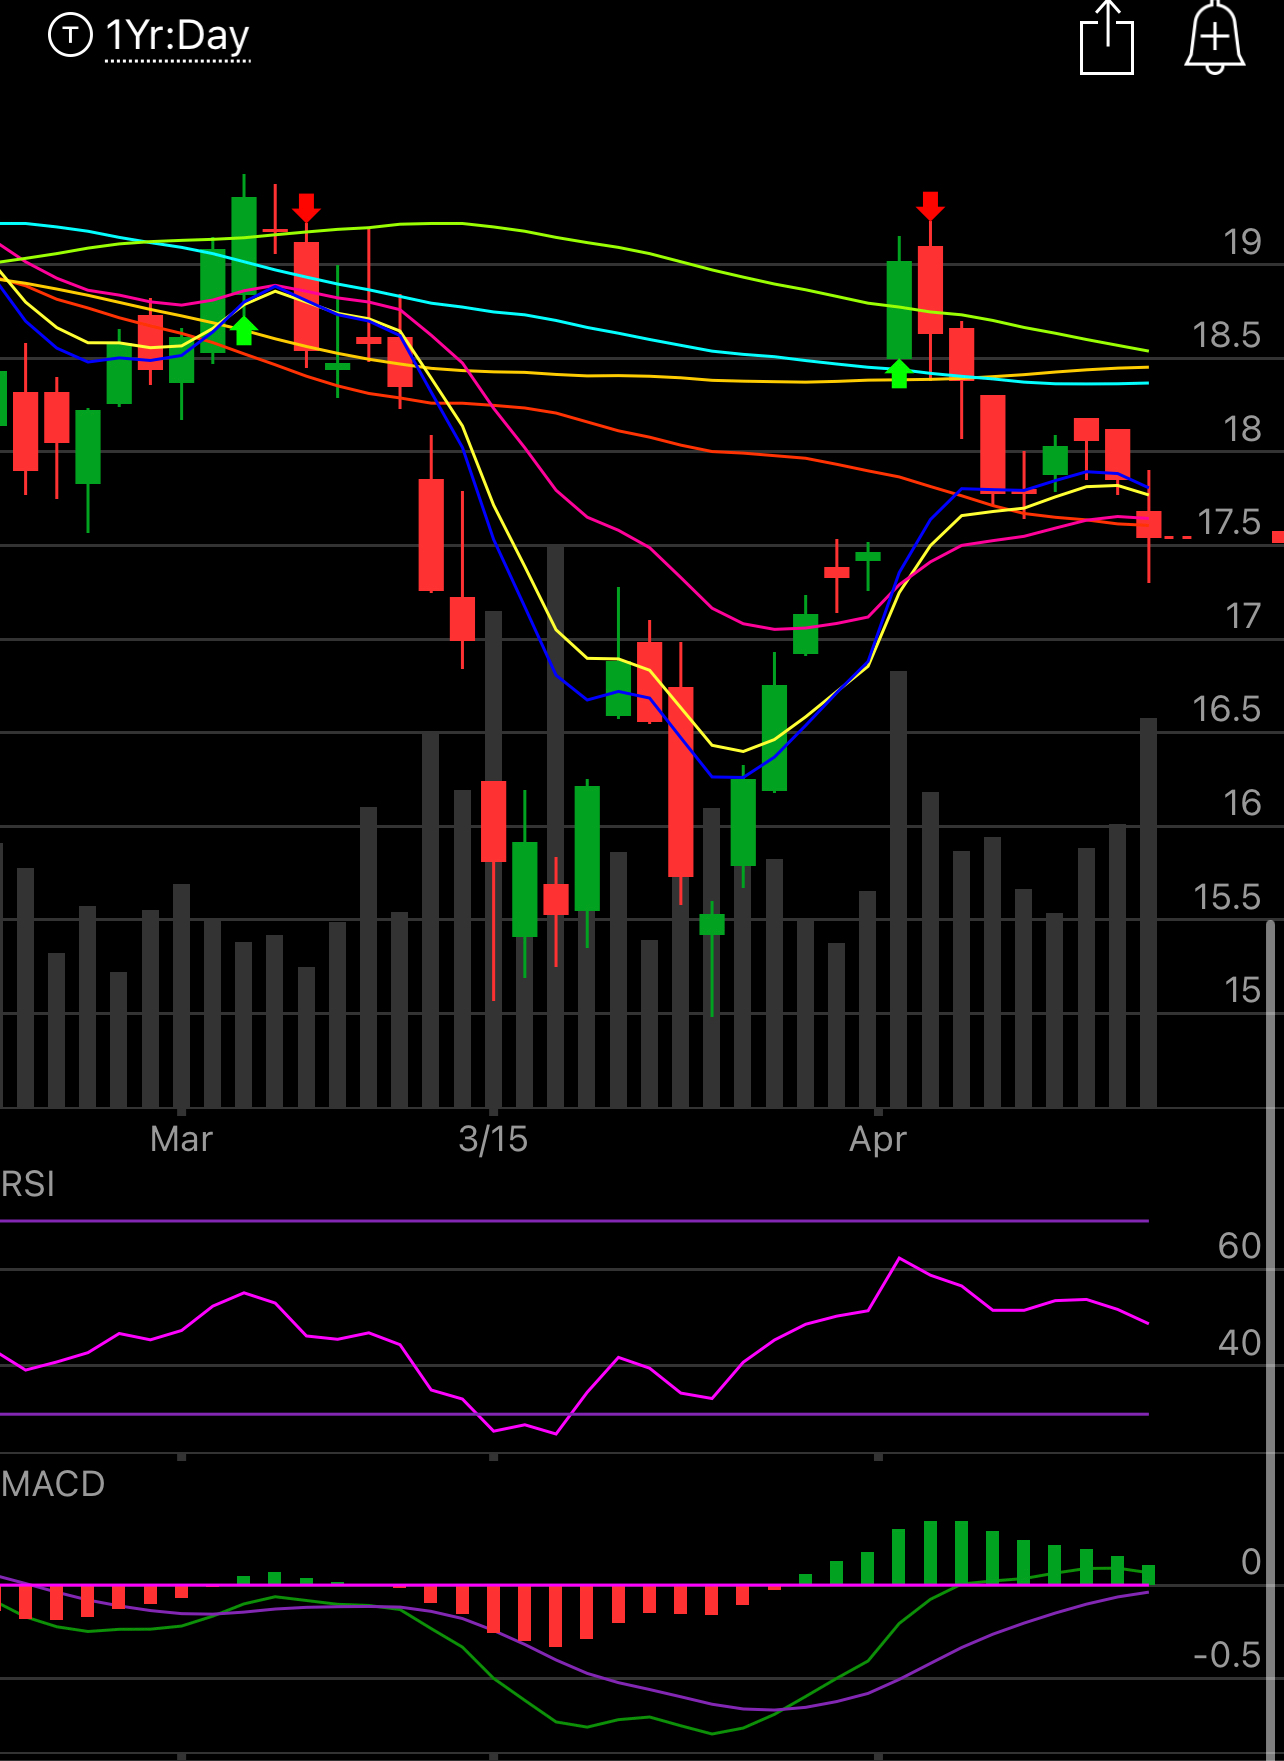
The daily closed below all the moving averages, not good, it’s been red 7 of the last 8 days., but it did just fill that gap that you can see was created at the end of March. There is still 1 more gap at 15.50 as you can see below.
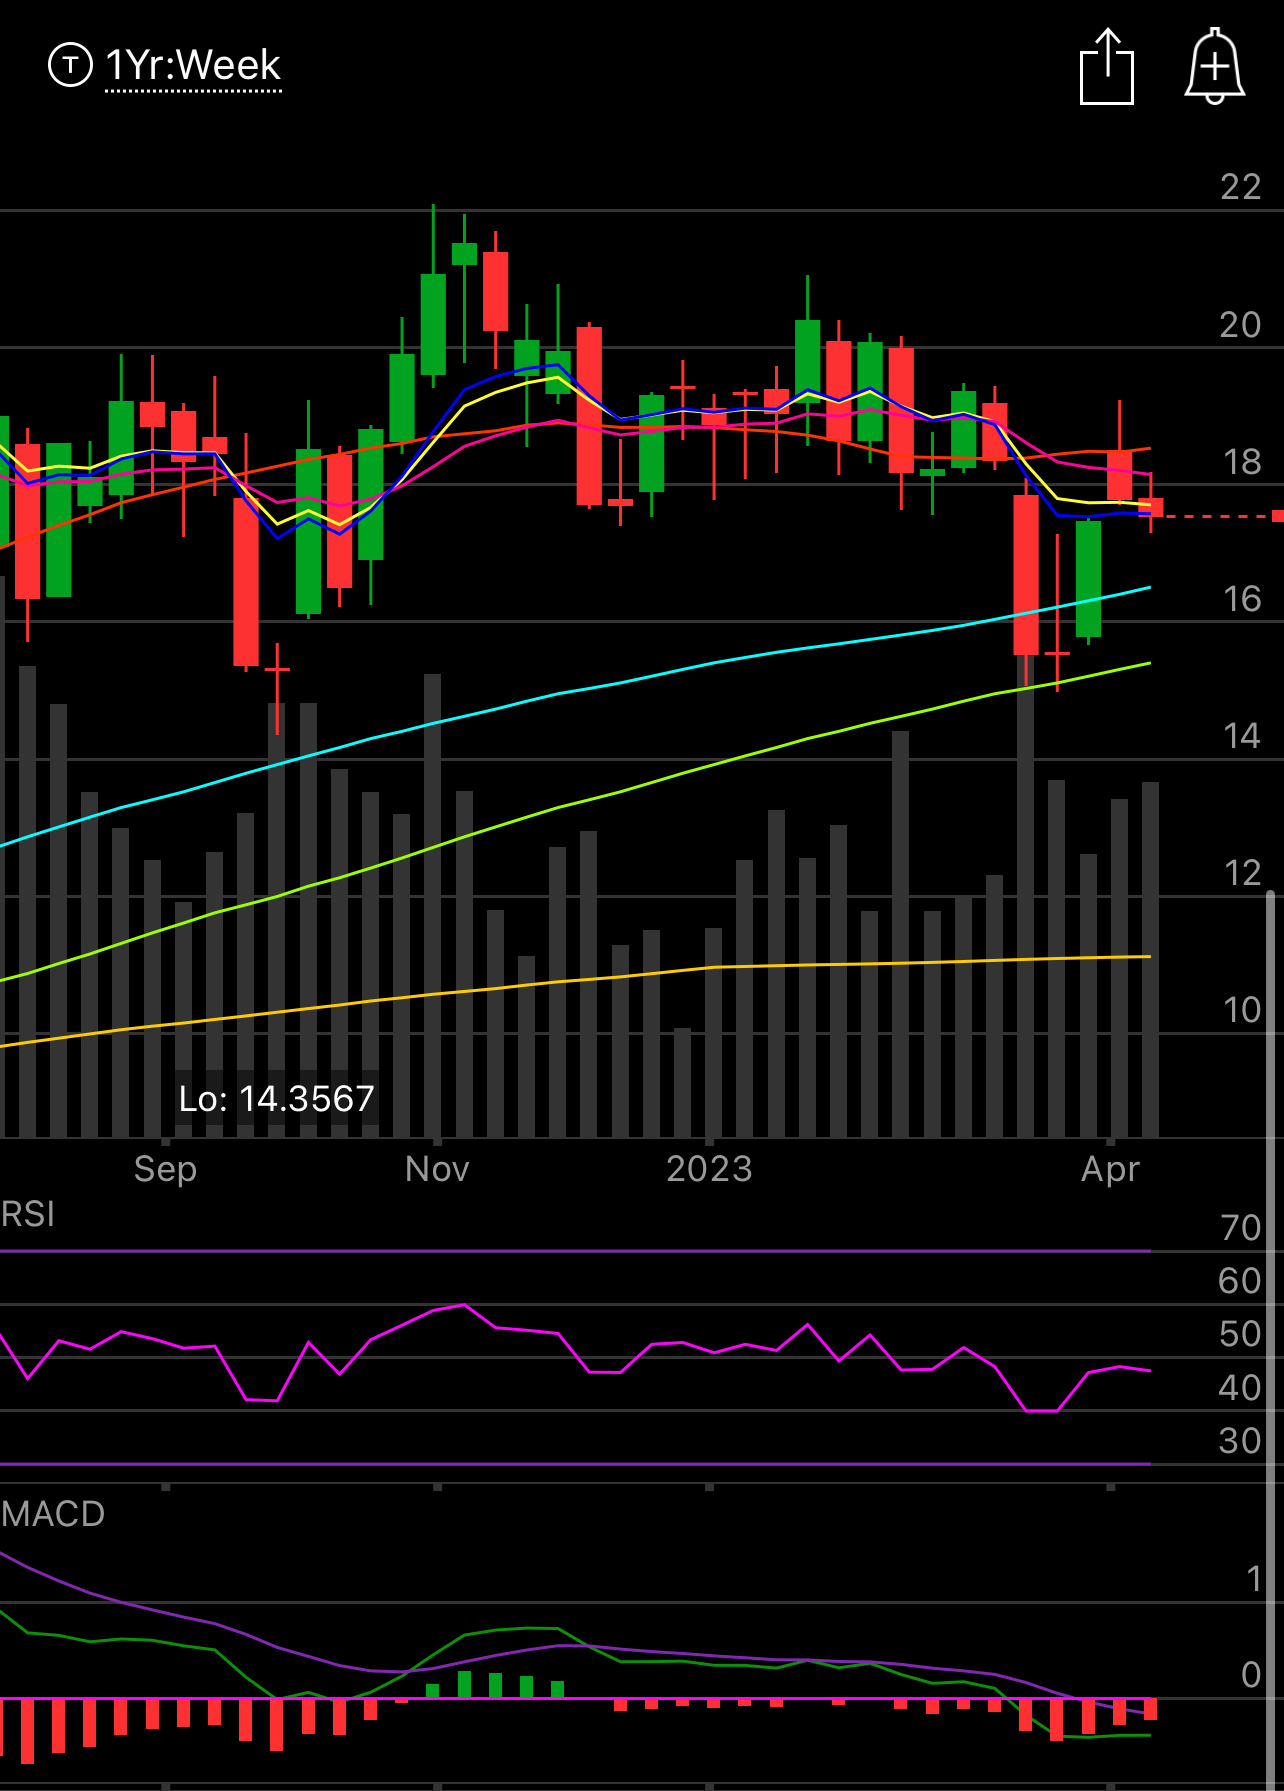
The weekly shows some nice support below a hair over 16 and then again around 15.50 which lines up with the gap I noted above.
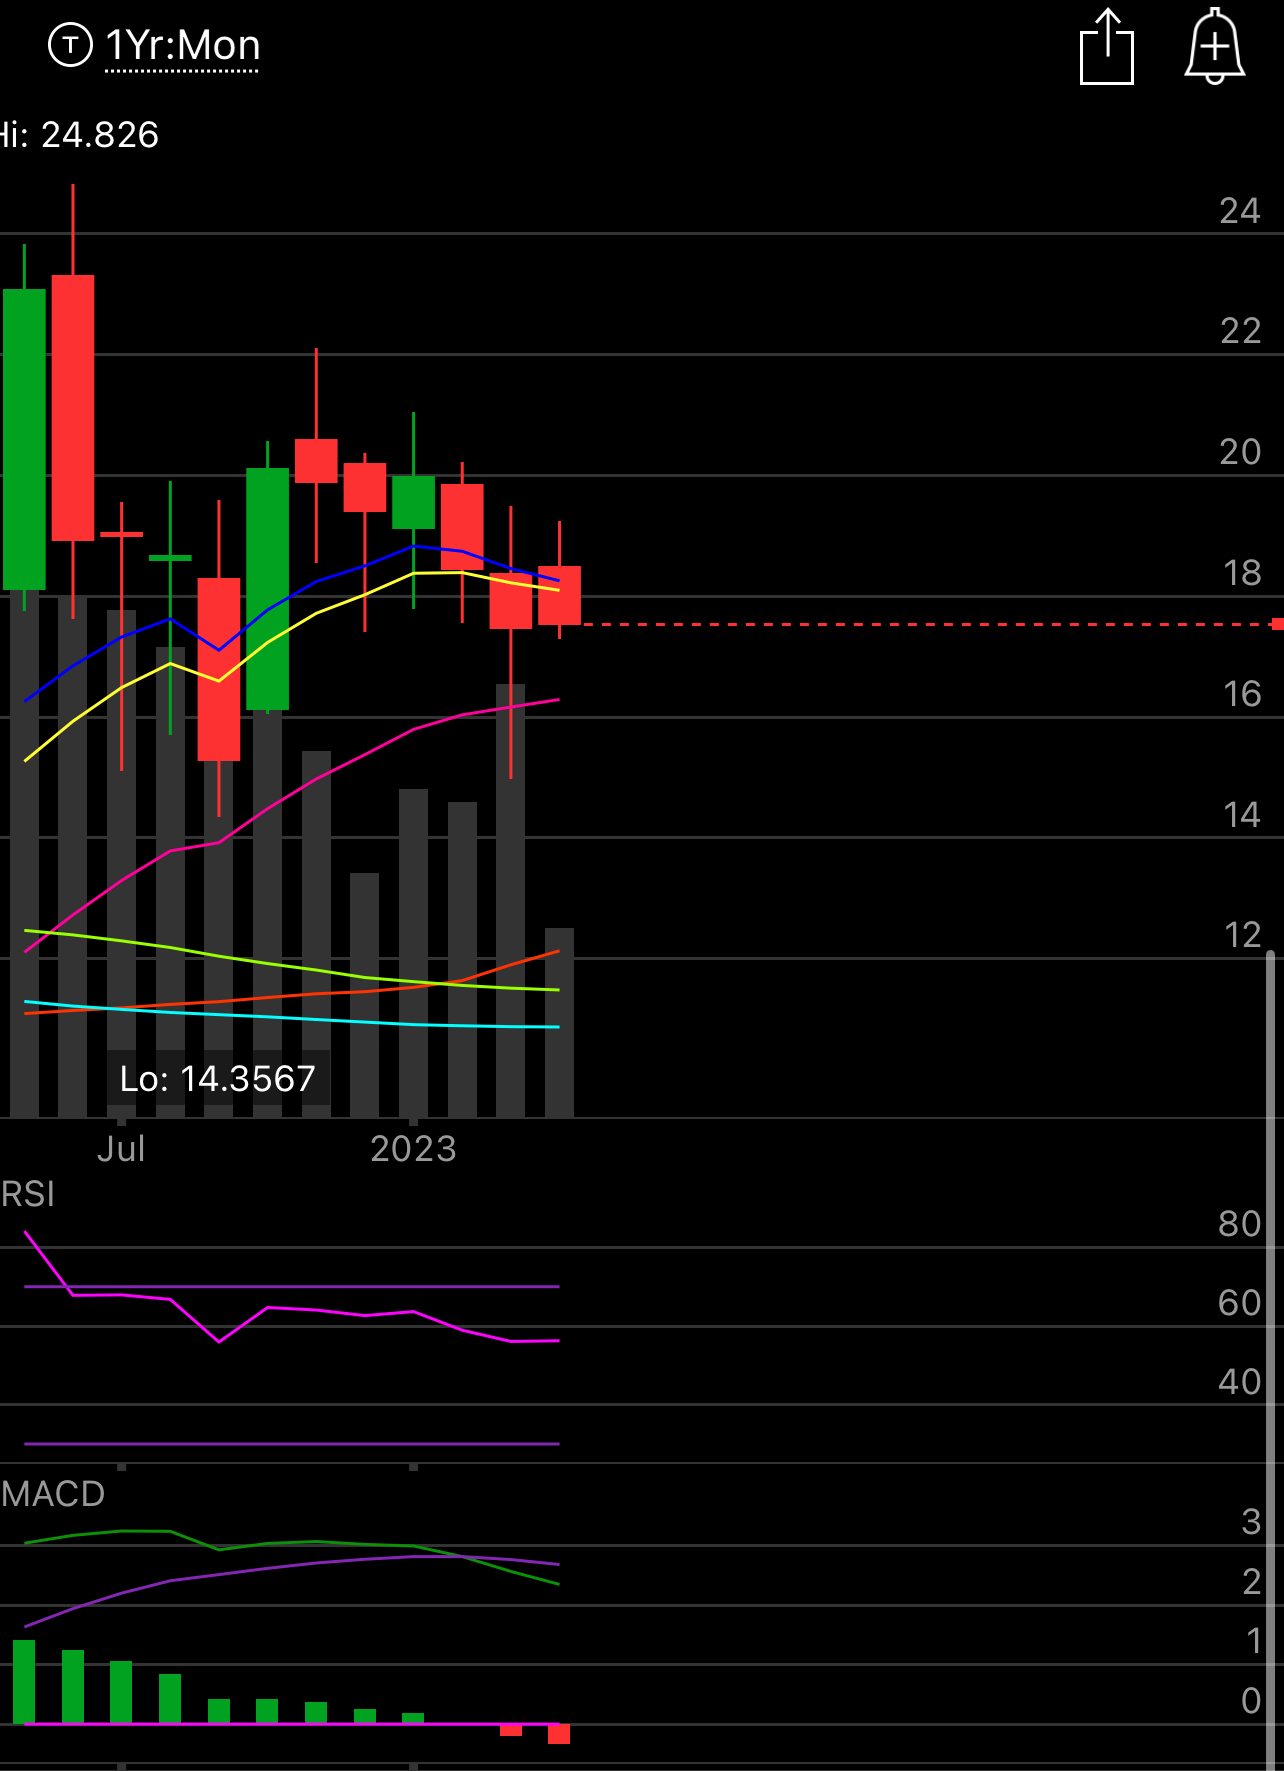
The monthly is not looking too good either, next support is a tad over 16, but the name is well off its highs from last summer and it is a high a quality name in the mid tier energy space.
How Would I Play It?
I would target that gap fill myself, just because gaps tend to fill at some point,currently the stock is 17.54, I would sell something like the January 2024 15 puts on CVE which are currently 1.40 x 1.55 as you can see below.
If you sold these you are basically taking on the obligation to get long the stock at near 13.50. If the stock comes down to 15 great you picked up the stock for 13.50 which is 25% lower than it is today, if the stock goes up, you’re still making 10% on the trade. Either way you are making money while not paying the current market price.
I hope you all have a great weekend and I will see you tomorrow with earnings previews.
I don't see it in the table but similar to the July 2024 calls, there was 16,059 of volume on the $25c for Jan 2024.