
4/19/25 Best Idea For The Week Ahead

So we just wrapped up another weak week. As you look at the chart below you shouldn’t be shocked. I’ve discussed the 21 ema and its significance for years and you can see the clear break below that light blue in line in mid February and we have closed below the 21 ema all but 1 day since. This is just a normal downtrend. It’s hard because we’ve been so conditioned to buy the dip every time we break under the 21 ema for years but this was one of the times where we broke it and did not recover in a short period. In the future if you simply go to cash on every close below that 21 ema you will never, ever get caught up in a move down like this. Below that moving average anything you put on is going to be a struggle until the market gets back over that moving average. This chart is just bad right now. Again remember a chart is just a visualization of buying and selling occurring within a name, that’s it. If a chart looks good, that’s because it is being bought, when it looks bad it is not being bought, don’t overthink things but overall the SPY is just being sold more than it is being bought right now.
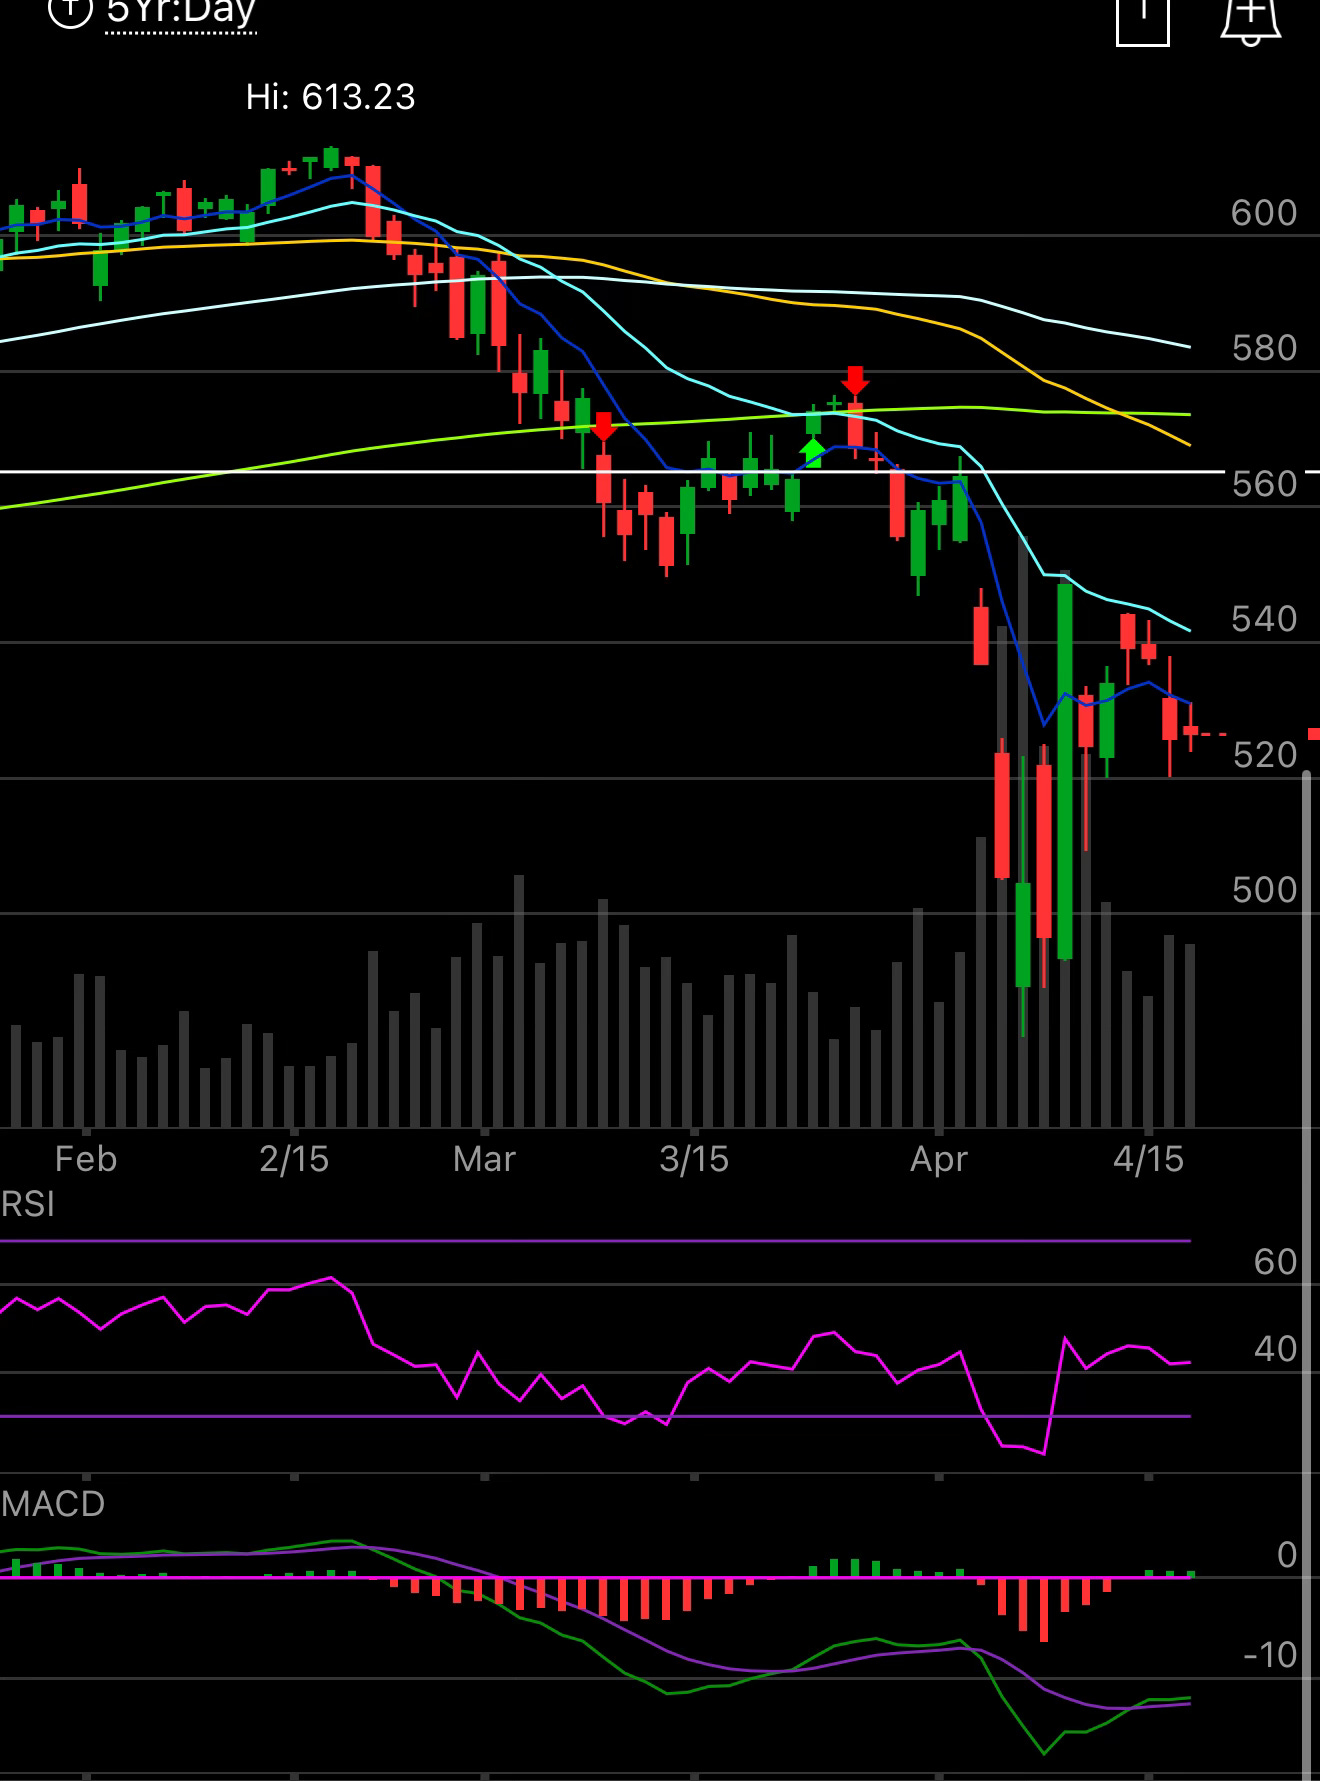
The hope is this weekend we get some trade deals from Trump and Co, personally, I do not think any of that matters right now as the only trade deal the market wants is from China. We have earnings from a few megacaps this week and more the following 2 weeks but right now there is nothing anyone can do until this downtrend breaks. The good news is the longer this goes on, the lower the 21 ema goes and right now it is barely over 540 on the SPY with us just 3% below it now. Still, we are looking at some immense technical damage this is just going to take a long time to repair. We are definitely not going back to previous highs quick so get that notion out of your head, when liberation day happened I said 2 quarters and I still stand by that timeframe leading into October at a minimum for the market to assess the impact of tariffs.
As you look at the technical damage on all these names you need to have a checklist of strength to determine what you want to be in. I still think you don’t want to touch calls right now, stick to commons and focus on names showing relative strength. Names over the 8 ema especially right now with how weak everything is, anything over the 8 ema is a name showing short term strength. You want to see moving averages not sloping down on daily and weekly timeframes, the longer the better, and in order I would say this is the order of importance for moving averages.
8 ema
21 ema
50 sma
100 sma
200 sma
You ideally would not be swinging names below the 200 day, that means a name is long term broken, nothing good happens there. Look at all the big names you trade right now, only a handful are over the 8 or 21 ema right now, none of the megacaps are, those are just not where you want to be and the market is telling you as nobody is buying them at this moment.
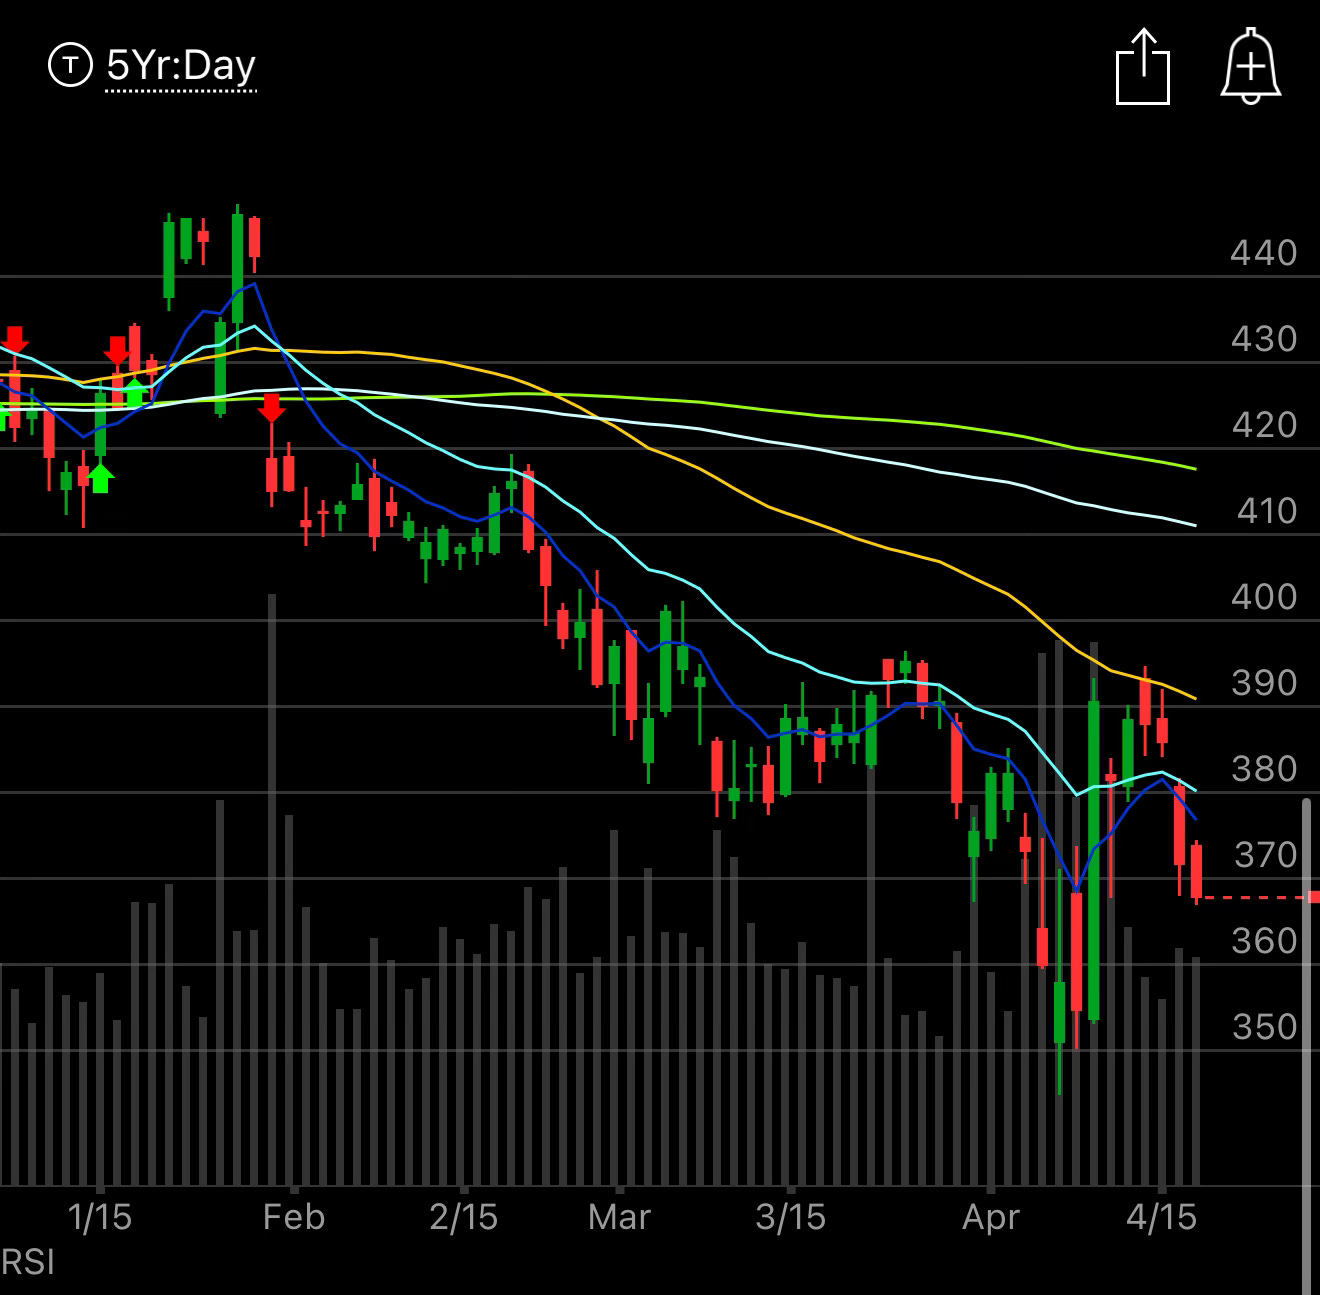
Let’s look at some of these mega cap charts and you can see what I mean. Here is MSFT below, this has seen multiple breaks below the 200 day(green line) since last summer it was consistently weak and then in late January it broke below the 21 ema on that heavy volume gap down and it has been a disaster since, reclaiming the 21 ema twice short term and instantly reversing back below it. This is where you want to wait and see a name reclaim some of the bigger moving averages first like the 50,100,200 which MSFT never did. There is nothing else to say here, this is a great company if you buy it here and close your eyes, I’m sure you’re thrilled a couple years out, but in the short term it won’t be pretty or easy as every pop continue to be sold. That simple rule of being long over the 21 ema with a stop on a close below it would save everyone fortunes but yes along the way you would take a lot of small losses going long and being stopped out especially in this recent tape.
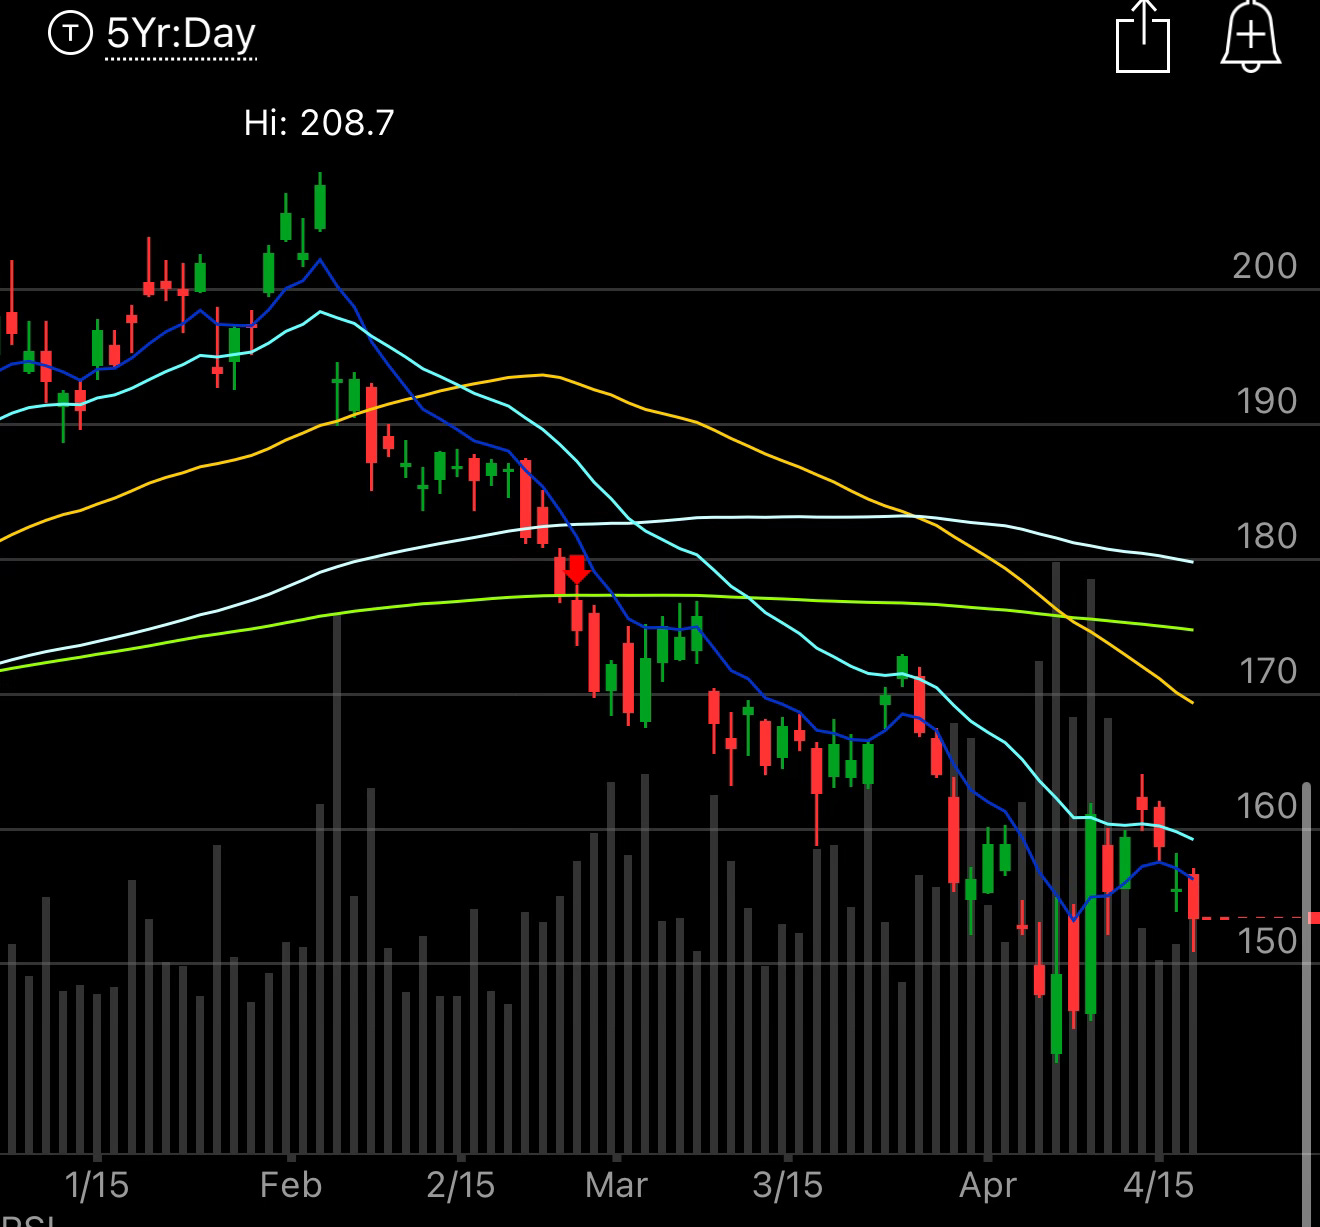
Here is another darling fintwit loves, Google, pretty much the same chart as above and it really does not matter how cheap this is or how much FCF they’re generating, these megacaps all trade at a factor of 1 and they all go up or down together. Right now this is as horribly broken as any other big tech chart out there. Whenever they rotate back to megacaps, this will be fine but it doesn’t look like that is anytime soon.
So what names are strong? I’ve mentioned Uber, below, but look at this chart. It is over all the key moving averages right now. It clearly has more people buying it than selling it. The why part isn’t too important but you want to position yourself in strength, not weakness and if you do a name like this should be near the top of your list.
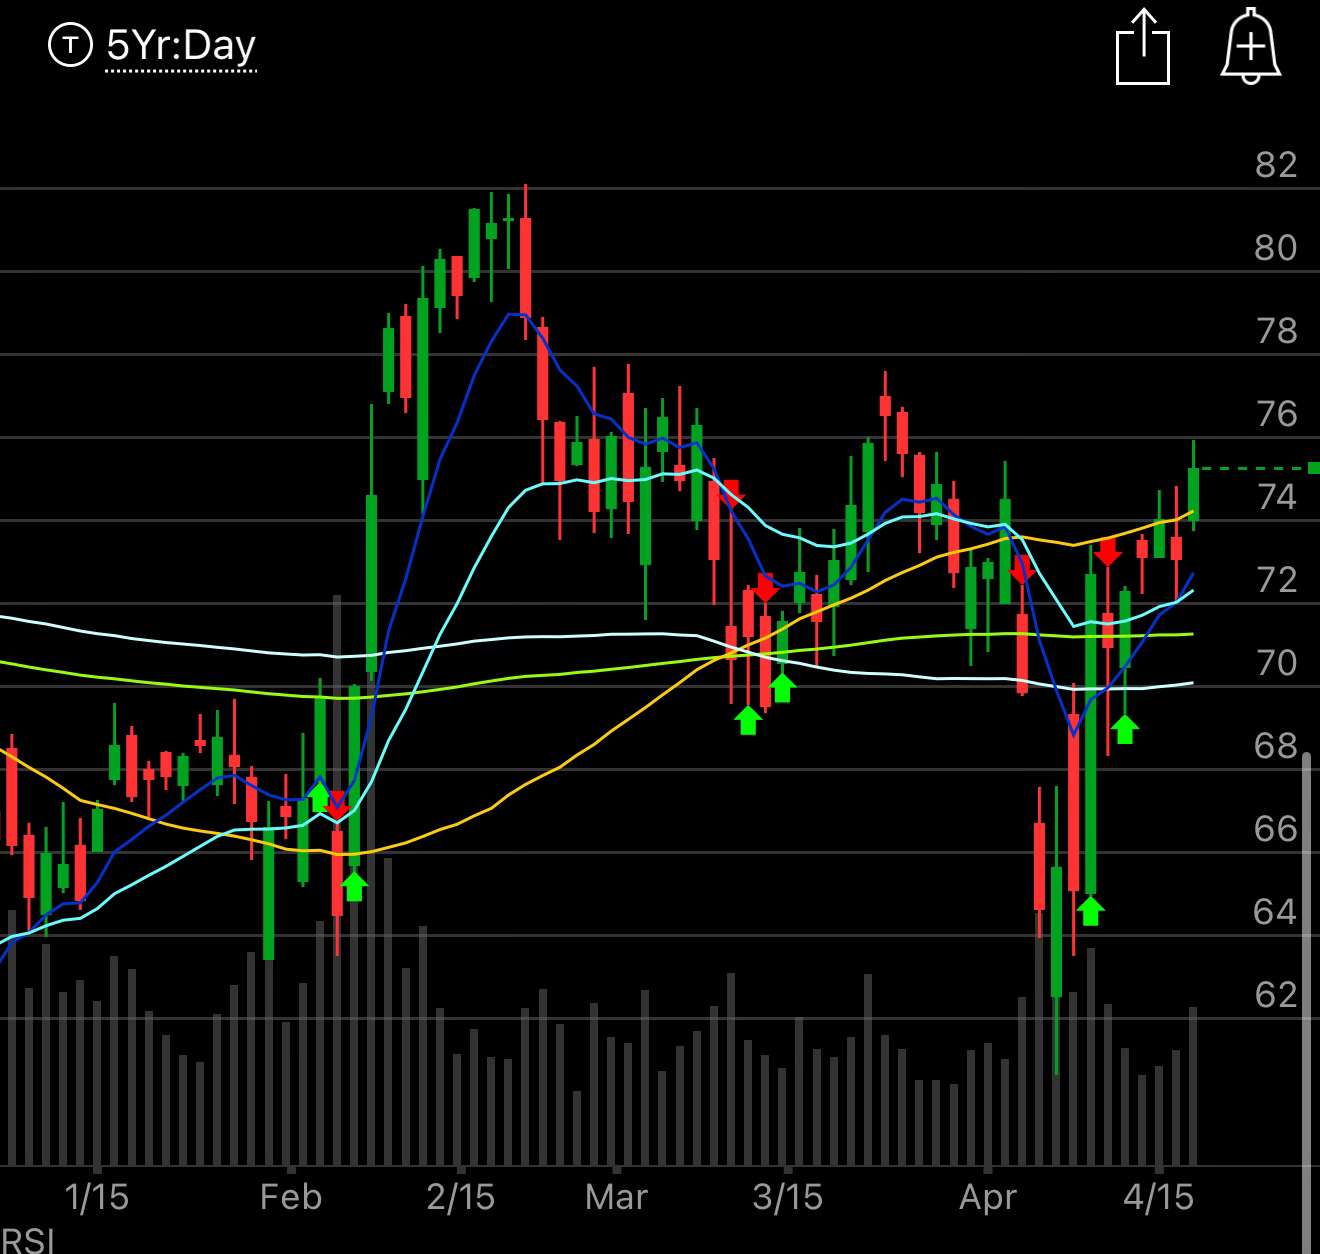
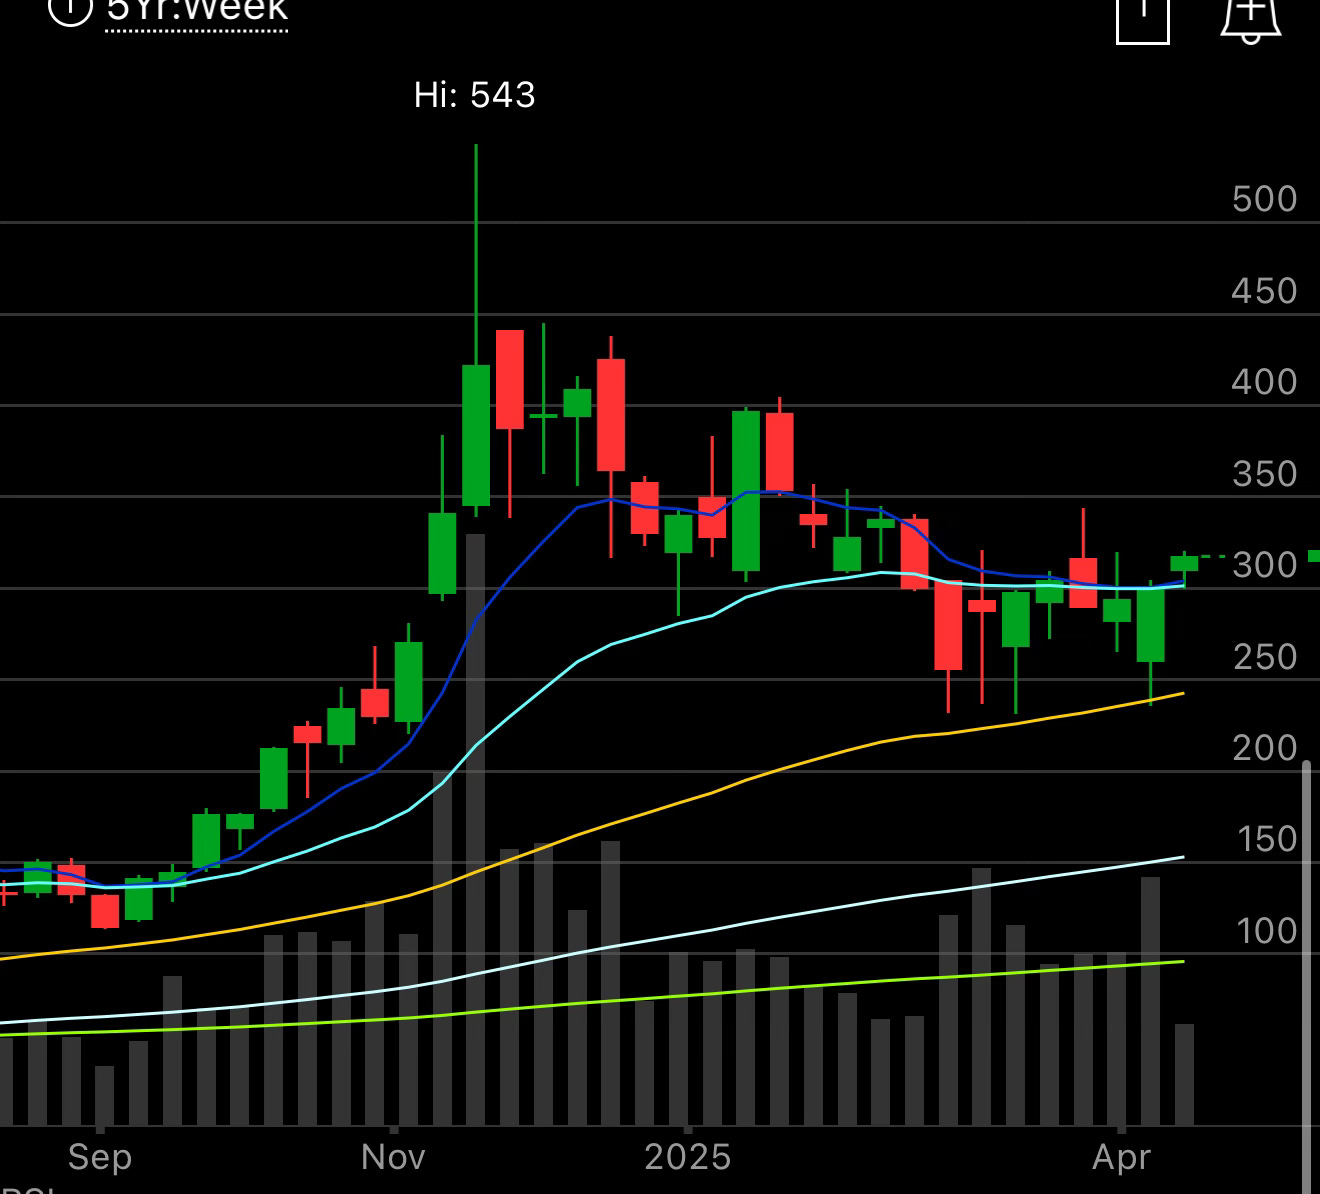
I’ve mentioned MSTR, below, and myself recently buying it in size and you’ll notice if you look at weekly charts of most names, the moving averages are sloping down and the names are below most moving averages. Microstrategy is one of the few names where the moving averages are not sloping down on longer timeframes AND the name is over the 8 week average. Think about it, we’ve been through a very rough 8 weeks in the market, how many names are holding up like this? Bitcoin itself used to be levered Nasdaq and this was levered bitcoin, it would have been destroyed in the past, now it is holding up strong vs the market. This is one of the few doing so, that is telling you that people are hiding here which is even more telling considering how high beta this name is.
With all the above in mind, this week’s best idea is where we’re going to discuss various ways to play a bullish chart like the above with put sales, put spreads, risk reversals, ratios, and covered calls. Different trade ideas for people with different risk profiles but it all starts with finding a pocket of strength. The chart is the chart and it is clearly as bullish as any right now.
