
4/29 Best Idea For The Week Ahead.

I have a few things to say before I get into the best idea.
Last Week’s Best Idea
MDT had a fantastic week, that was one of the best moves I’ve had after a best idea post closing the week up a little over 6%. I still like MDT longer term as a cheap defensive, I wouldn’t buy it right here, but selling puts below that gap below should continue to work this year as it makes a push higher with a few of the key moving averages curling up now.
Recap Of The Past Week & The Importance Of Trendlines.
This past week was one of the most incredible I’ve ever seen. Look at this chart of the SPY below. The last 2 candles were insane, but that is without context. The white line on the bottom is the trendline from the lows in October. We broke down below it on tuesday, a clear sign of weakness, we did it 2 months ago as well and it lead to nearly a month weakness. This time, it followed up with 1 day of weakness, Wednesday. If you remember I made the post last friday about buying puts as a hedge. I did that because all the indicators were rolling over: the MACD, the RSI, and we were breaking below moving averages. Look at the last 4 candles below.
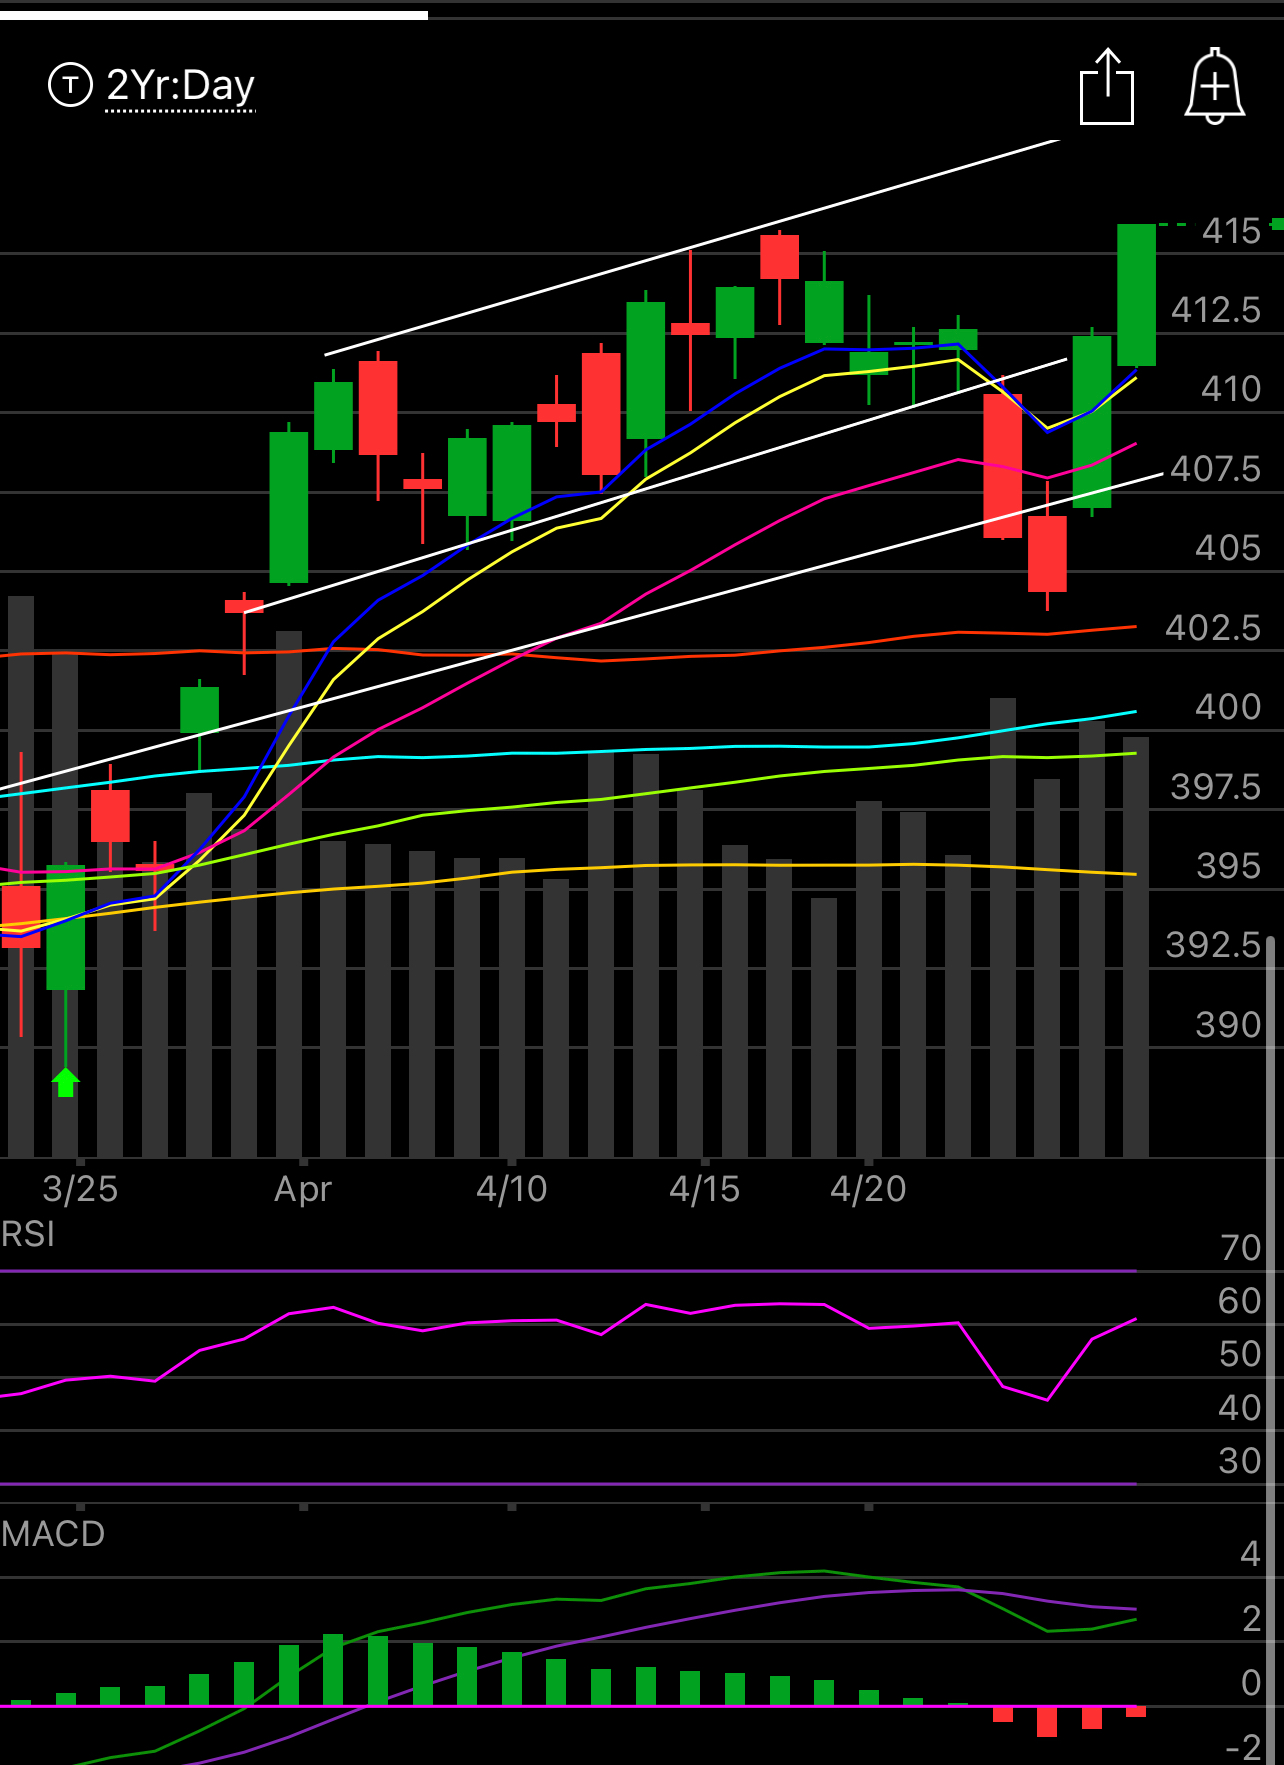
My timing was good, not perfect, but good. I was 1 day early, we dumped hard tuesday. Now here is what I want you to understand just for your own future reference and trading. I really respect these trendlines. When a trend breaks, I go short, and when a trend recovers I go long. Markets really are that simple. Now here is where this week was the wildest I’ve seen. That yellow arrow is last friday when I took the big put position hedge. We followed with another ok monday where for the 3rd day in a row we tested below the 8 ema. You can see it that Link from last friday my 4 reasons for buying those puts, one was repeated tests below the 8 ema on the daily. A clear sign of weakness. Great, textbook trading. Tuesday we get the initial dump, the blue arrow below, perfect, it breaks the short term trend we were in all of April. Typically when you break below a range like that, everyone over an extended period is trapped and sellers are in control closing the SPY below the October low uptrend. The market finally brokedown, bears everywhere rejoiced. The sellers were indeed in control because Microsoft, the 2nd largest component in our market ripped up 10% afterhours tuesday and it meant nothing because you can see the candle on Wednesday sellers took it even lower to 403.xx. Then META reported revenues +3% and the stock jumped 15% and the market never looked back the last 2 days.
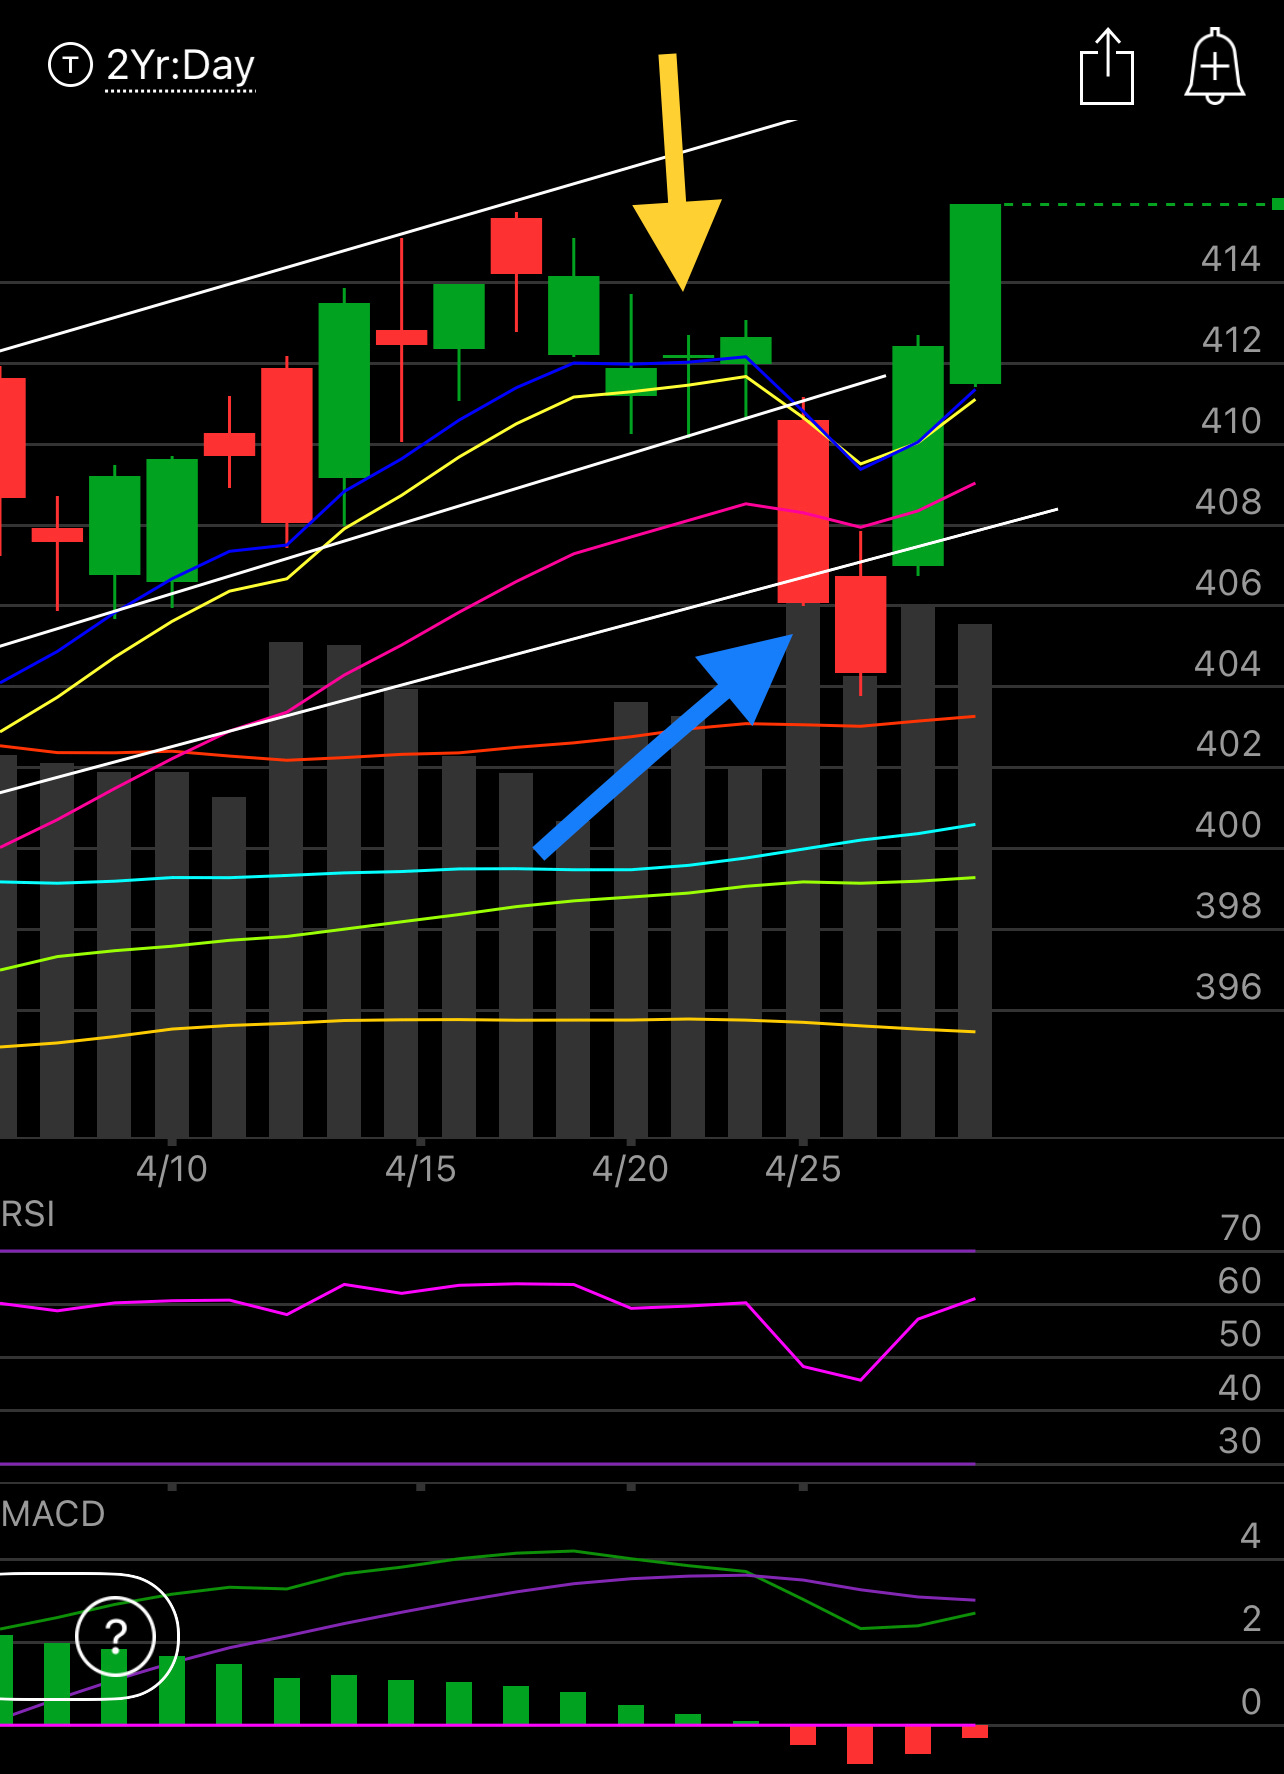
Bottom line, being short is hard when this much liquidity exists. You have to pick your spots, be short, but respect the trends. If you do not, you will not survive. You always hear about traders blowing up, you can’t do that if you respect trends.
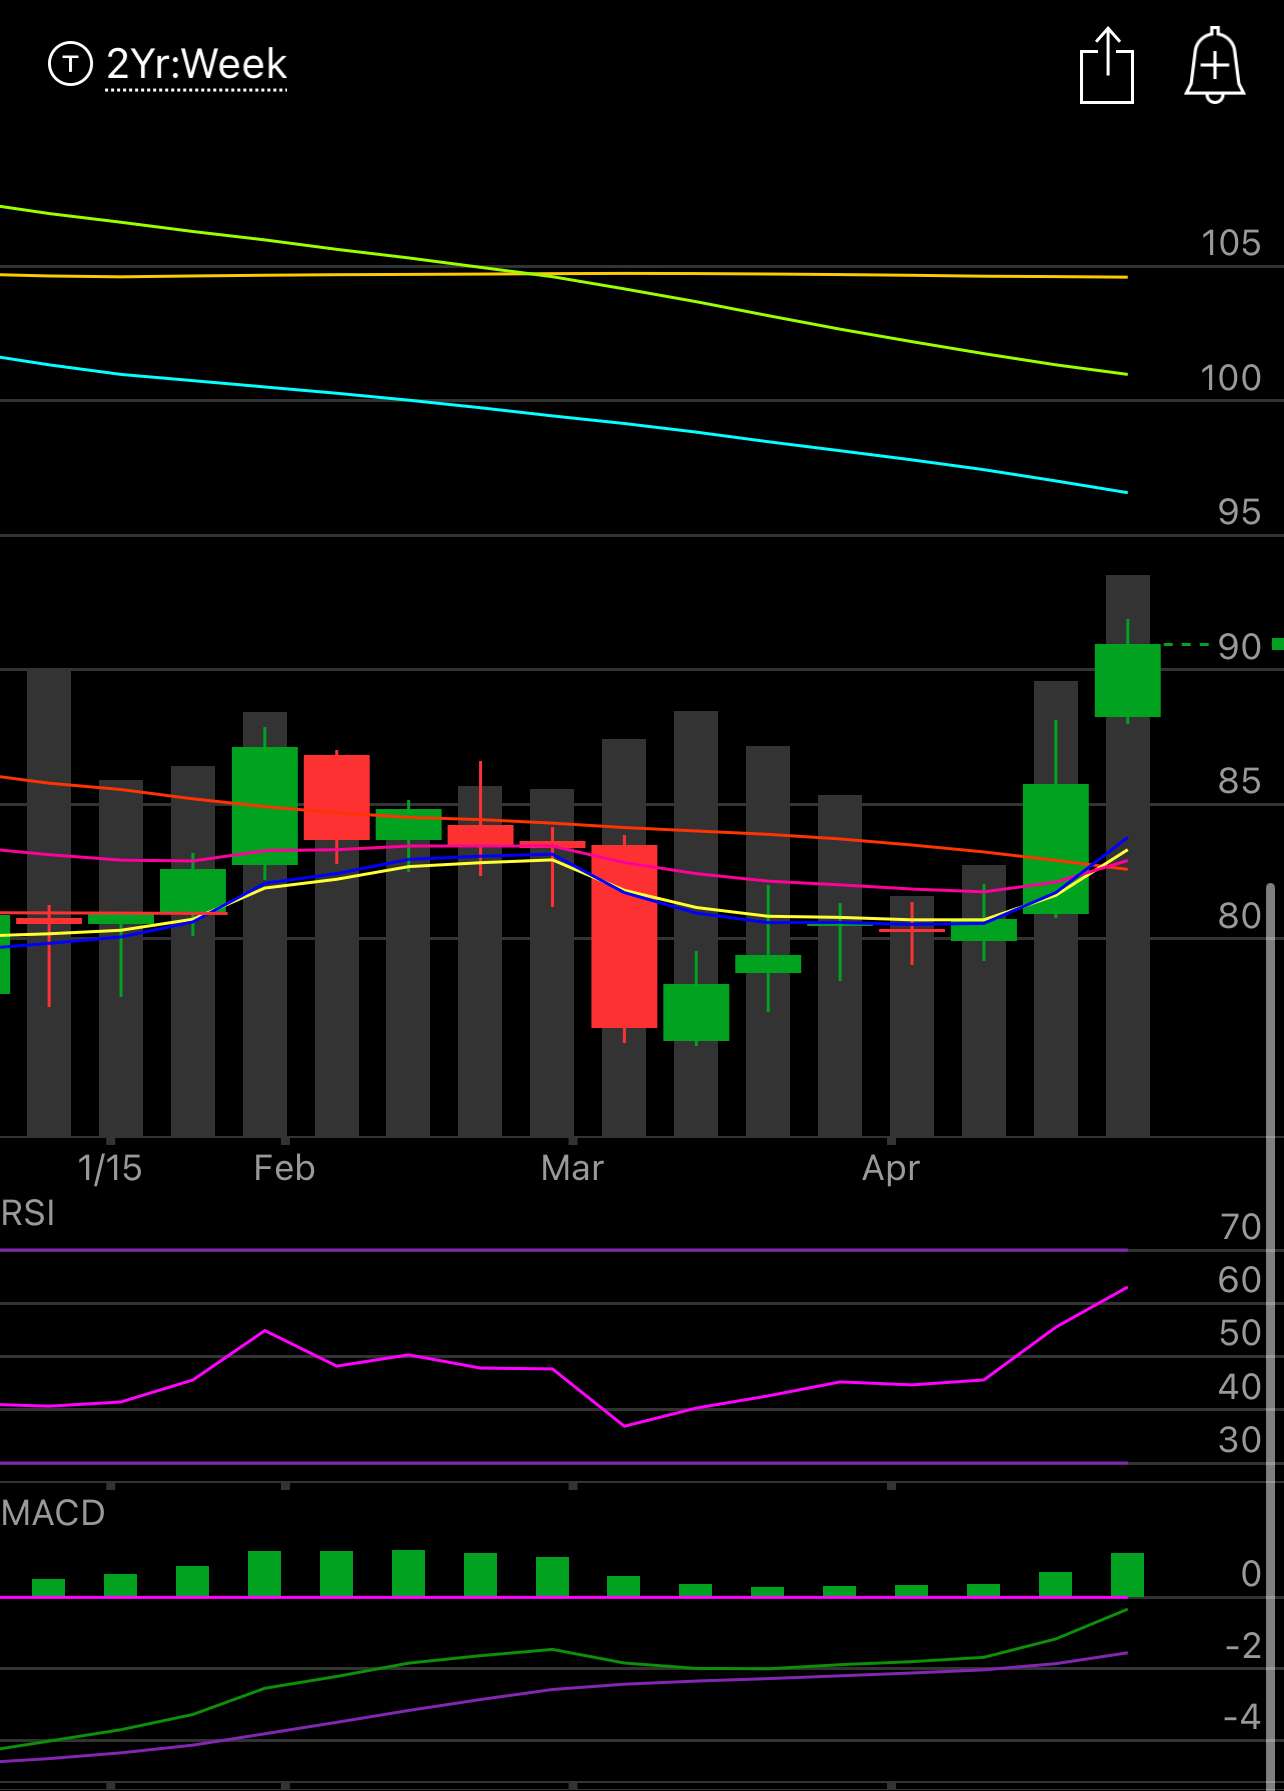
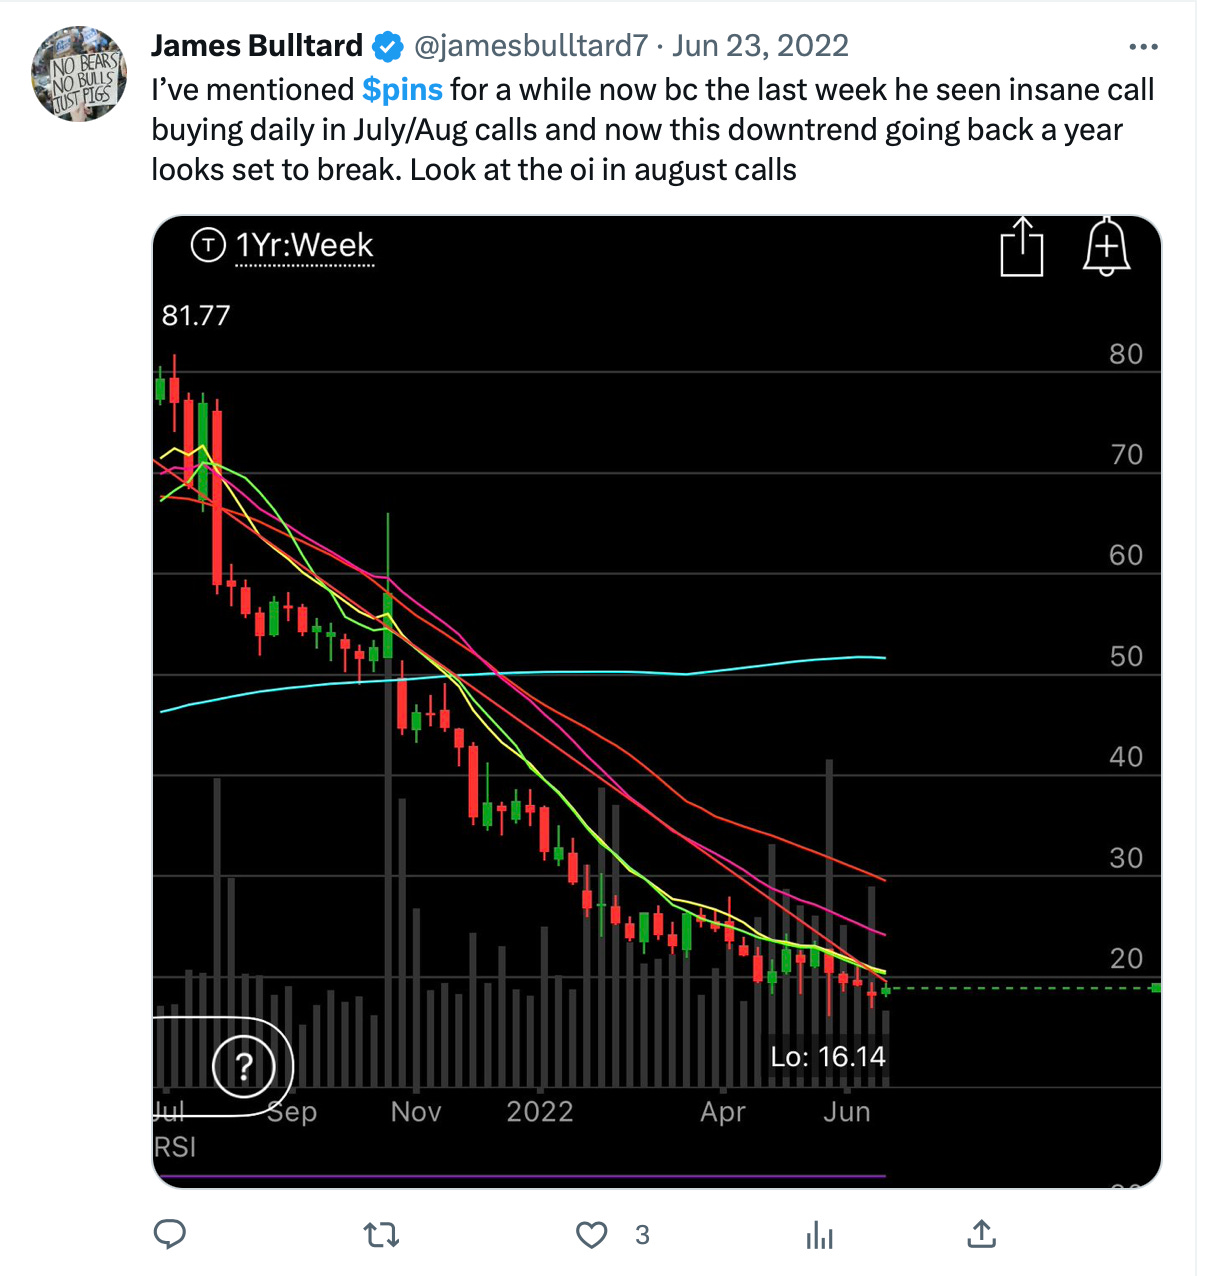
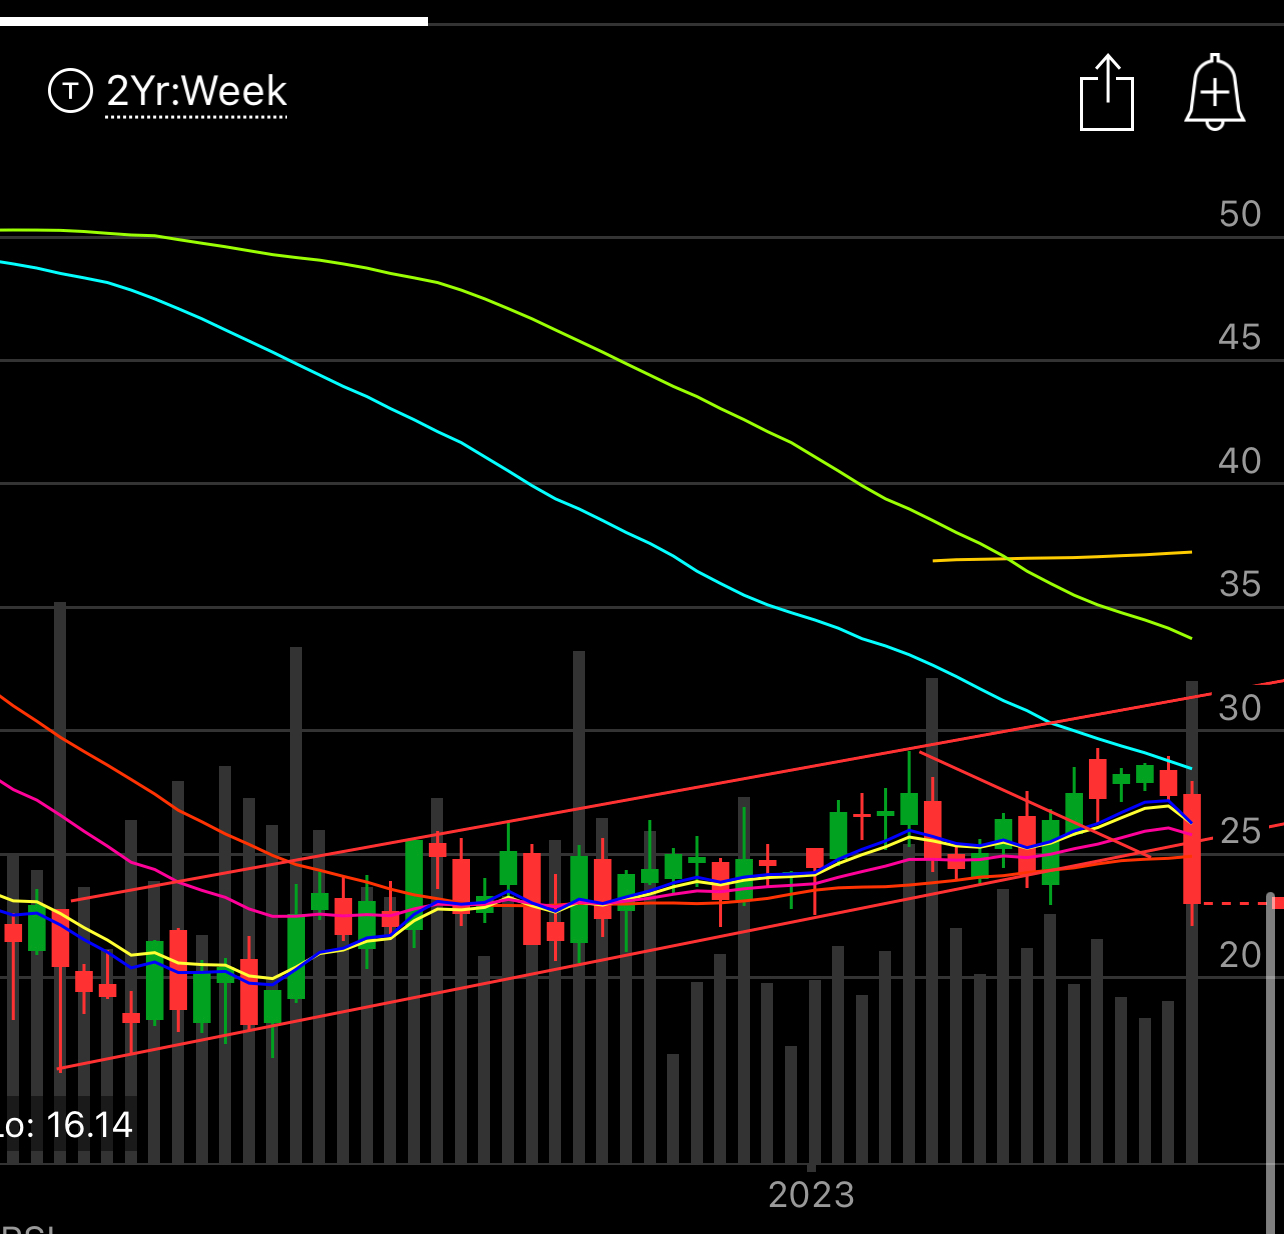
Let’s discuss another example from yesterday, Pinterest. I’ve liked this name for a year now. Look at these tweets I posted a year back, I have to screenshot them because of Elon’s war with substack, you can’t embed anymore. You can see 2 tweets from early June 2022 that I was seeing huge call lots being bought daily. Something weird was happening and it lined up with the chart appearing to be close to a breakout. A couple weeks later in early July 2022, Elliott Managment disclosed their stake in Pinterest and this is the link here

So what’s changed now? Elliott still has their stake, it’s bigger than ever almost 30 million shares at last disclosure in February but they haven’t been able to control costs. This past Q Pinterest reported $600m in revenue, almost 1/4 of that was SBC and they lost a few hundred million, that was hideous and a failure from an activist who usually doesn’t fail like this. So even they too can be wrong sometimes, keep that in mind. Will they fix it? In time probably yes or they might just cut their stake.

With that said, the chart broke down yesterday, it’s pretty easy to see it below that the trend it had been respecting on a closing basis for a year was finally violated with a weekly close outside the range. Now could this be like the market where it dumps and recovers quick? It’s possible but not probable. The market didn’t violate a weekly close, just 1 day. This chart is decimated now, it will be a long time in my opinion before Pinterest recovers, but it is a buyout name still with a captive audience. That said, I am not a story investor and I closed my short puts at $20 in January for a loss and moved on. I’ve made alot on Pinterest riding this trend for a year, the market gods got some back yesterday but more importantly I respected my lines and left this without emotions.
There is always another trade just remember that, people get emotional and want to hang onto losers too long, don’t. That is the key.
