4/8 A Preview Of The Week Ahead
You’re getting this post a little early on Saturday night, tomorrow is a travel day for me. I’m going to add a whole new post every sunday on here that I never did before. It will be comprised of earnings previews when applicable, charts of interest for the week ahead, this week you will be shocked by what names are seeing the bullish flows, hint it is not good for the market, and other musings of mine.
Let’s start with a question that I get constantly about how to think regarding leverage. My answer will forever be that I do not recommend you use leverage unless you have a very high risk tolerance, a deep knowledge of how to manage margin, and balls of steel. With that said as I’ve said before, leverage is only to be deployed in uptrends. In the history of markets, other than 9/11 where we were closed and gapped down, every major decline has been pretty easy to spot unfolding and avoid. They all begin with the same exact thing, an uptrend that breaks, what do I mean?
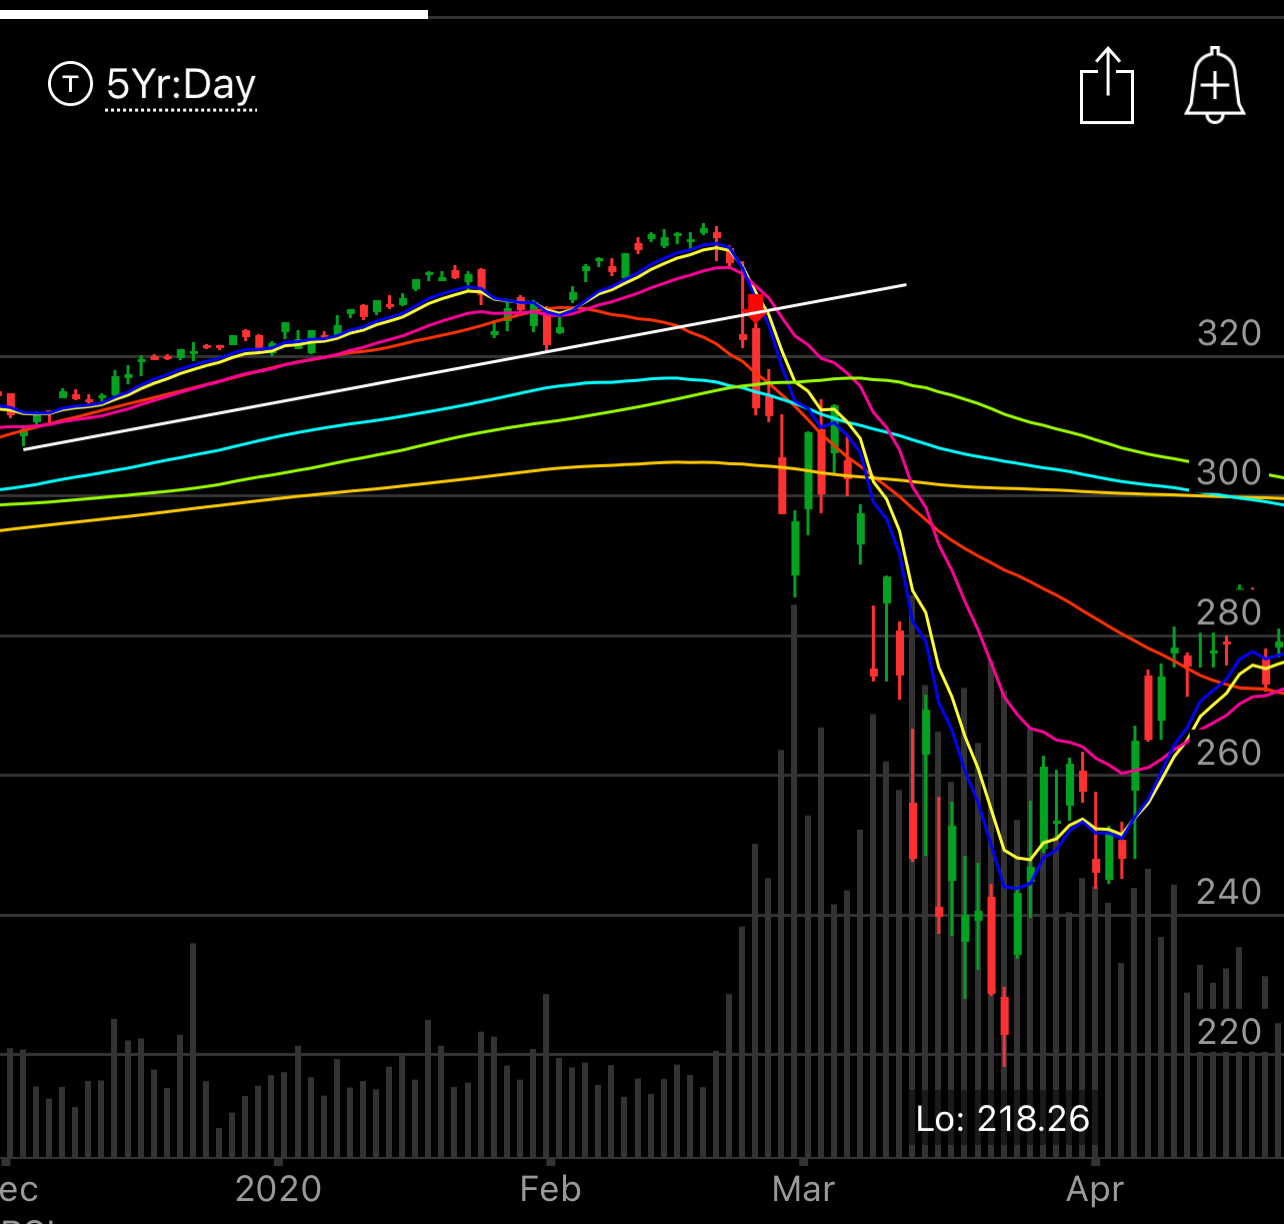
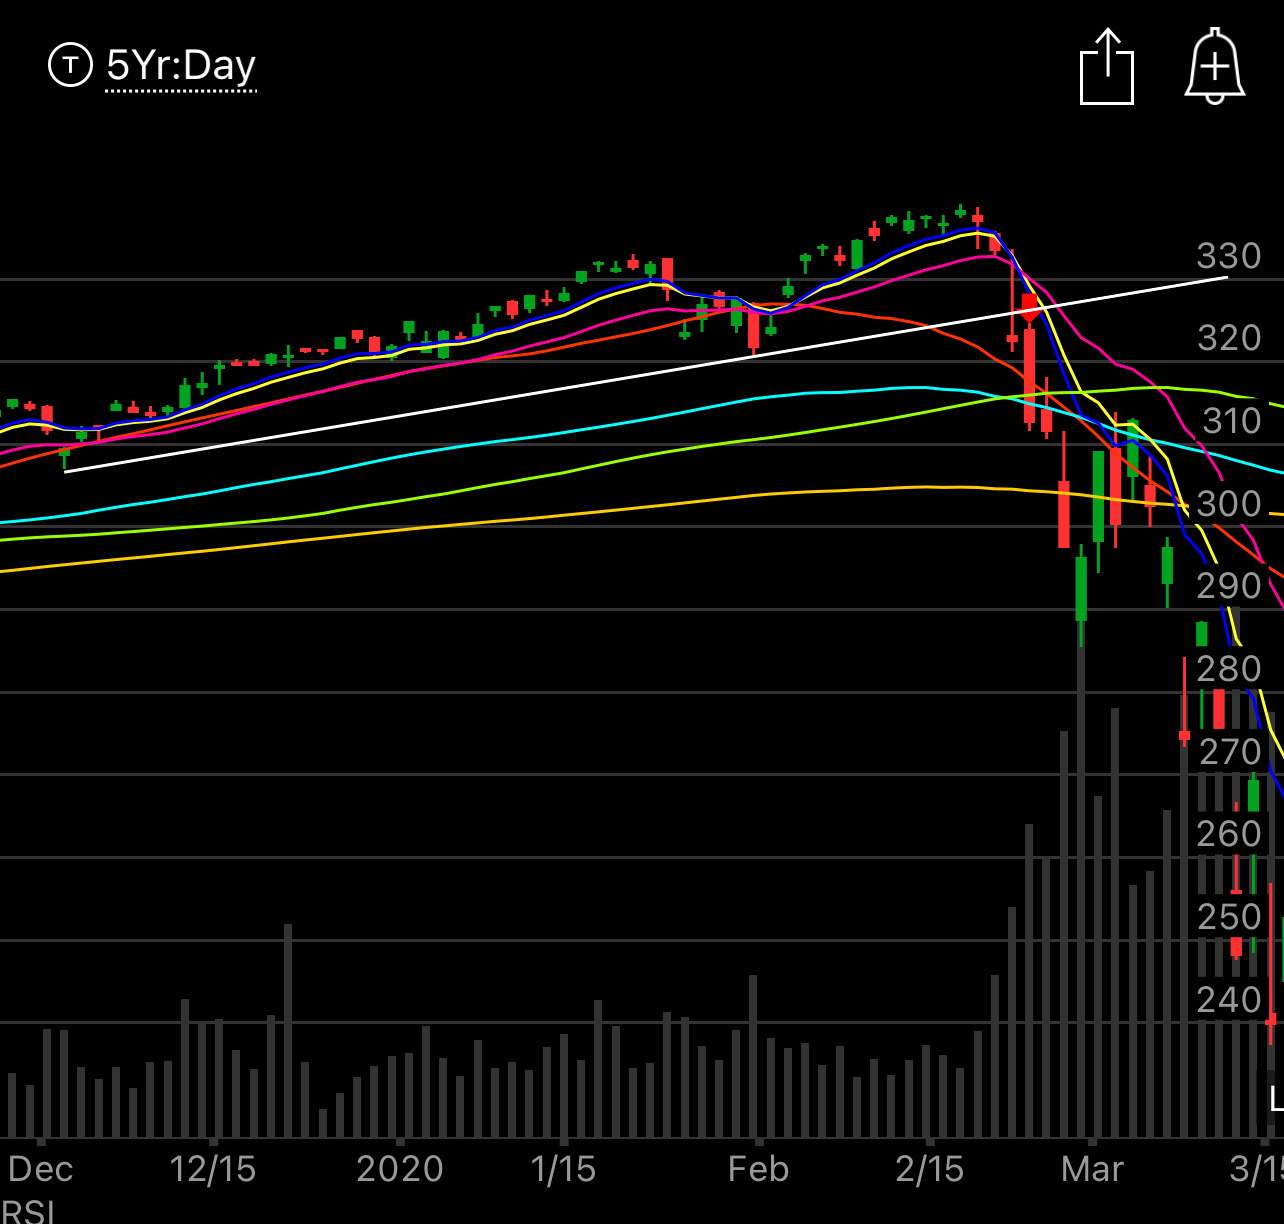
Let’s take a look at the covid crash in 2020. We all knew something was brewing in China for weeks before covid officially became a thing here. We saw the videos of the people collapsing in the streets overseas, we also knew camps were being set up and while we knew it was coming our markets kept ignoring what was coming as they kept chugging higher. Then the uptrend broke as you can see below…….
When we zoom in below you can really see that I’m talking about. This uptrend that extended well into 2019 finally was violated and the day it was, it was over. It doesn’t matter why it was violated, what matters was the fact that it was violated. Once that happened, it was time to remove all leverage and wait.
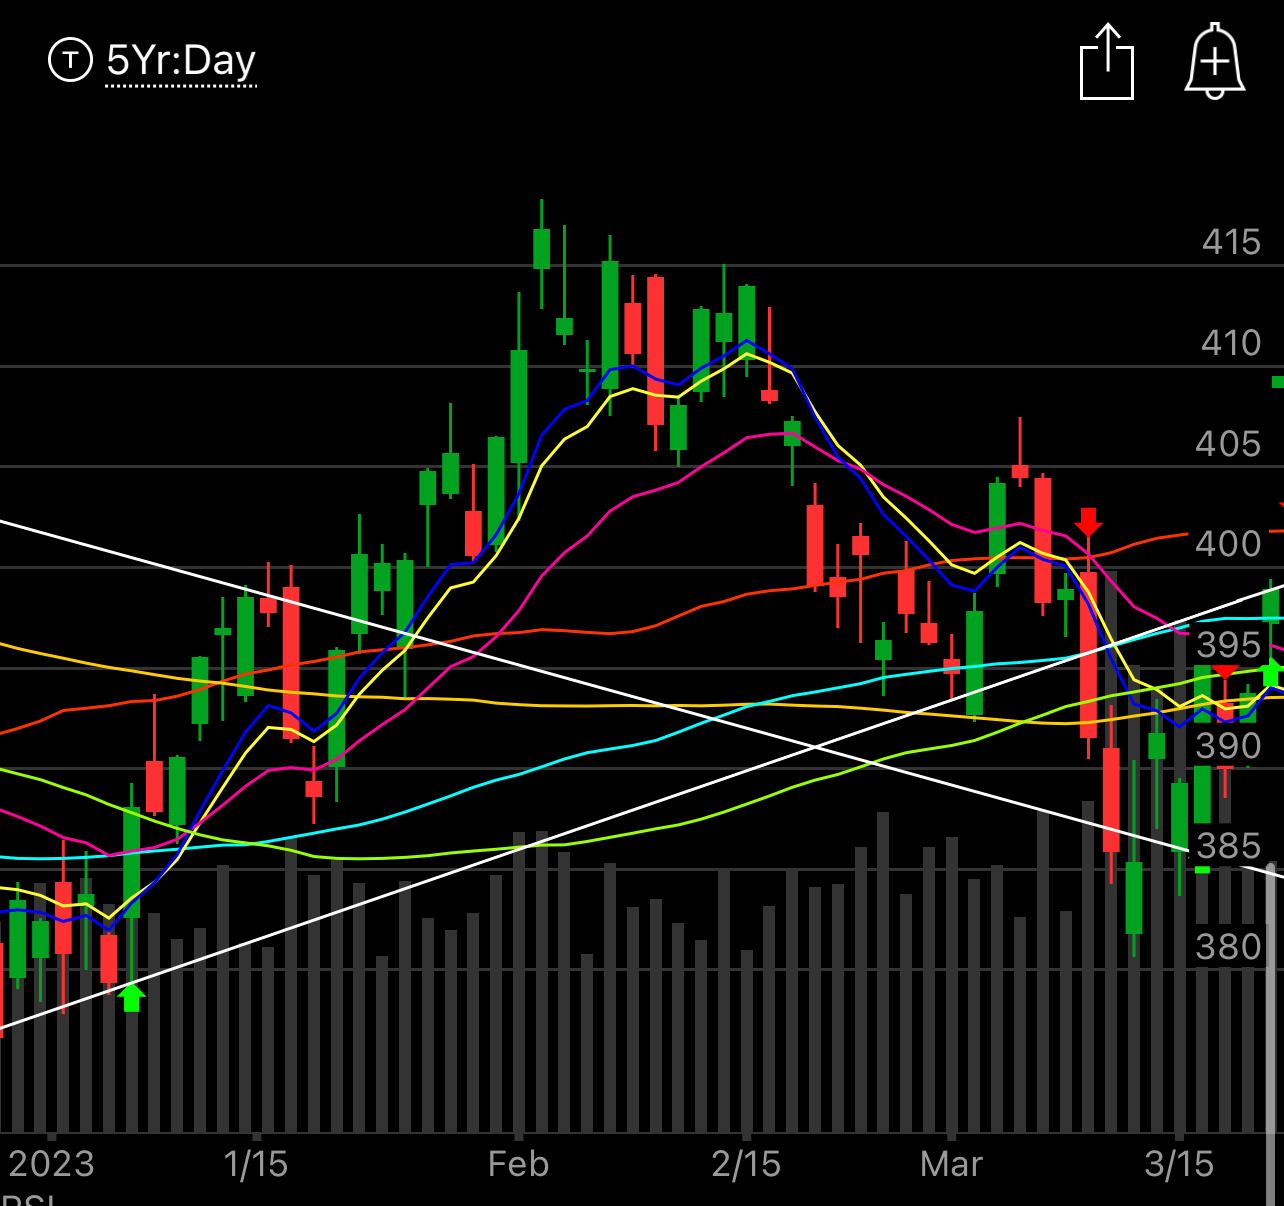
Sound familiar? It should because I was screaming at the top of my lungs for you to remove all leverage in early March when the uptrend broke again. You can go back to the posts from then and me warning that when the uptrend breaks you need to be cautious. This particular uptrend was one we were in from October 2022 and you can see the clear break in early March……
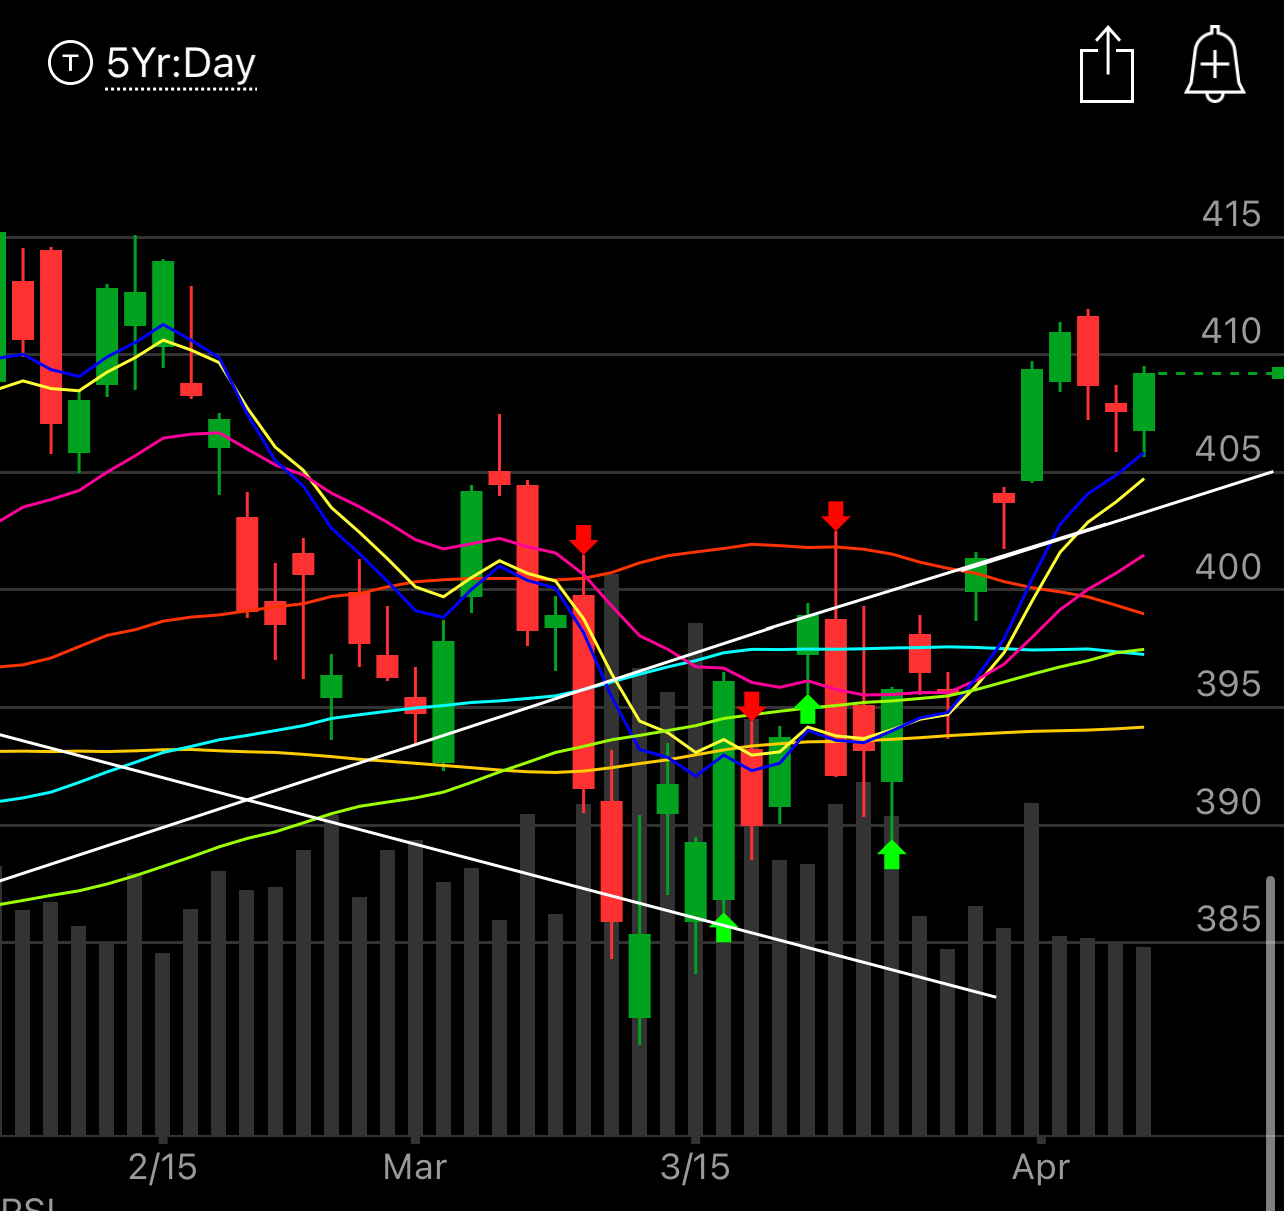
That breakdown(below) led to a month of sideways action which you can see below that didn’t resolve until we reclaimed the uptrend. Notice the strong reaction once we reclaimed the uptrend? That’s why I say it’s ok to press leverage in an uptrend, and I do, but you have to understand when we’re not in one and de-lever and move to more cash secured trades or nothing at all until a base forms.
So the point of what I said above is just to illustrate that market declines, big ones, typically do not just randomly occur, they are telegraphed. As I stated 9/11 was truly the only case I can remember where markets just shut down and opened lower. When the market decides it is going lower, you’re going to see a big trend breakdown first. In the current situation, that would be a move below that white line above. It could very well come next week on bad bank earnings, I don’t have an answer on when it’s coming, but I know that I’m going to see it the day it breaks down and massively de-risk my book at that time. As I always say, charts tell a story and it is up to us to listen. These pretty little candles are all smaller stories within a larger story simply showing us participants how money is flowing around. When money starts to exit, the process is usually prolonged, but we will see the initial breakdown. That is where we exit. Simple enough?
Earnings Previews
Earnings season kicks off this week, and while we do not have tons of names reporting, we have some big ones. I’m going to go over a few reporting this week and share their unusual option flows as I’ve noted them in my database along with their charts. Afterwards I will post other charts that look interesting to me for the time being.
Carmax should tell us alot about the health of the auto market and the retail buyer with these new interest rates. Delta Airlines should give us insights into the spending patterns of consumers and friday we get many of the big banks reporting. Let’s look at all those names, their charts and options flows.
CarMax
The options flows here are few and nothing stands out to me, this isn’t the type of name I trade anyhow.
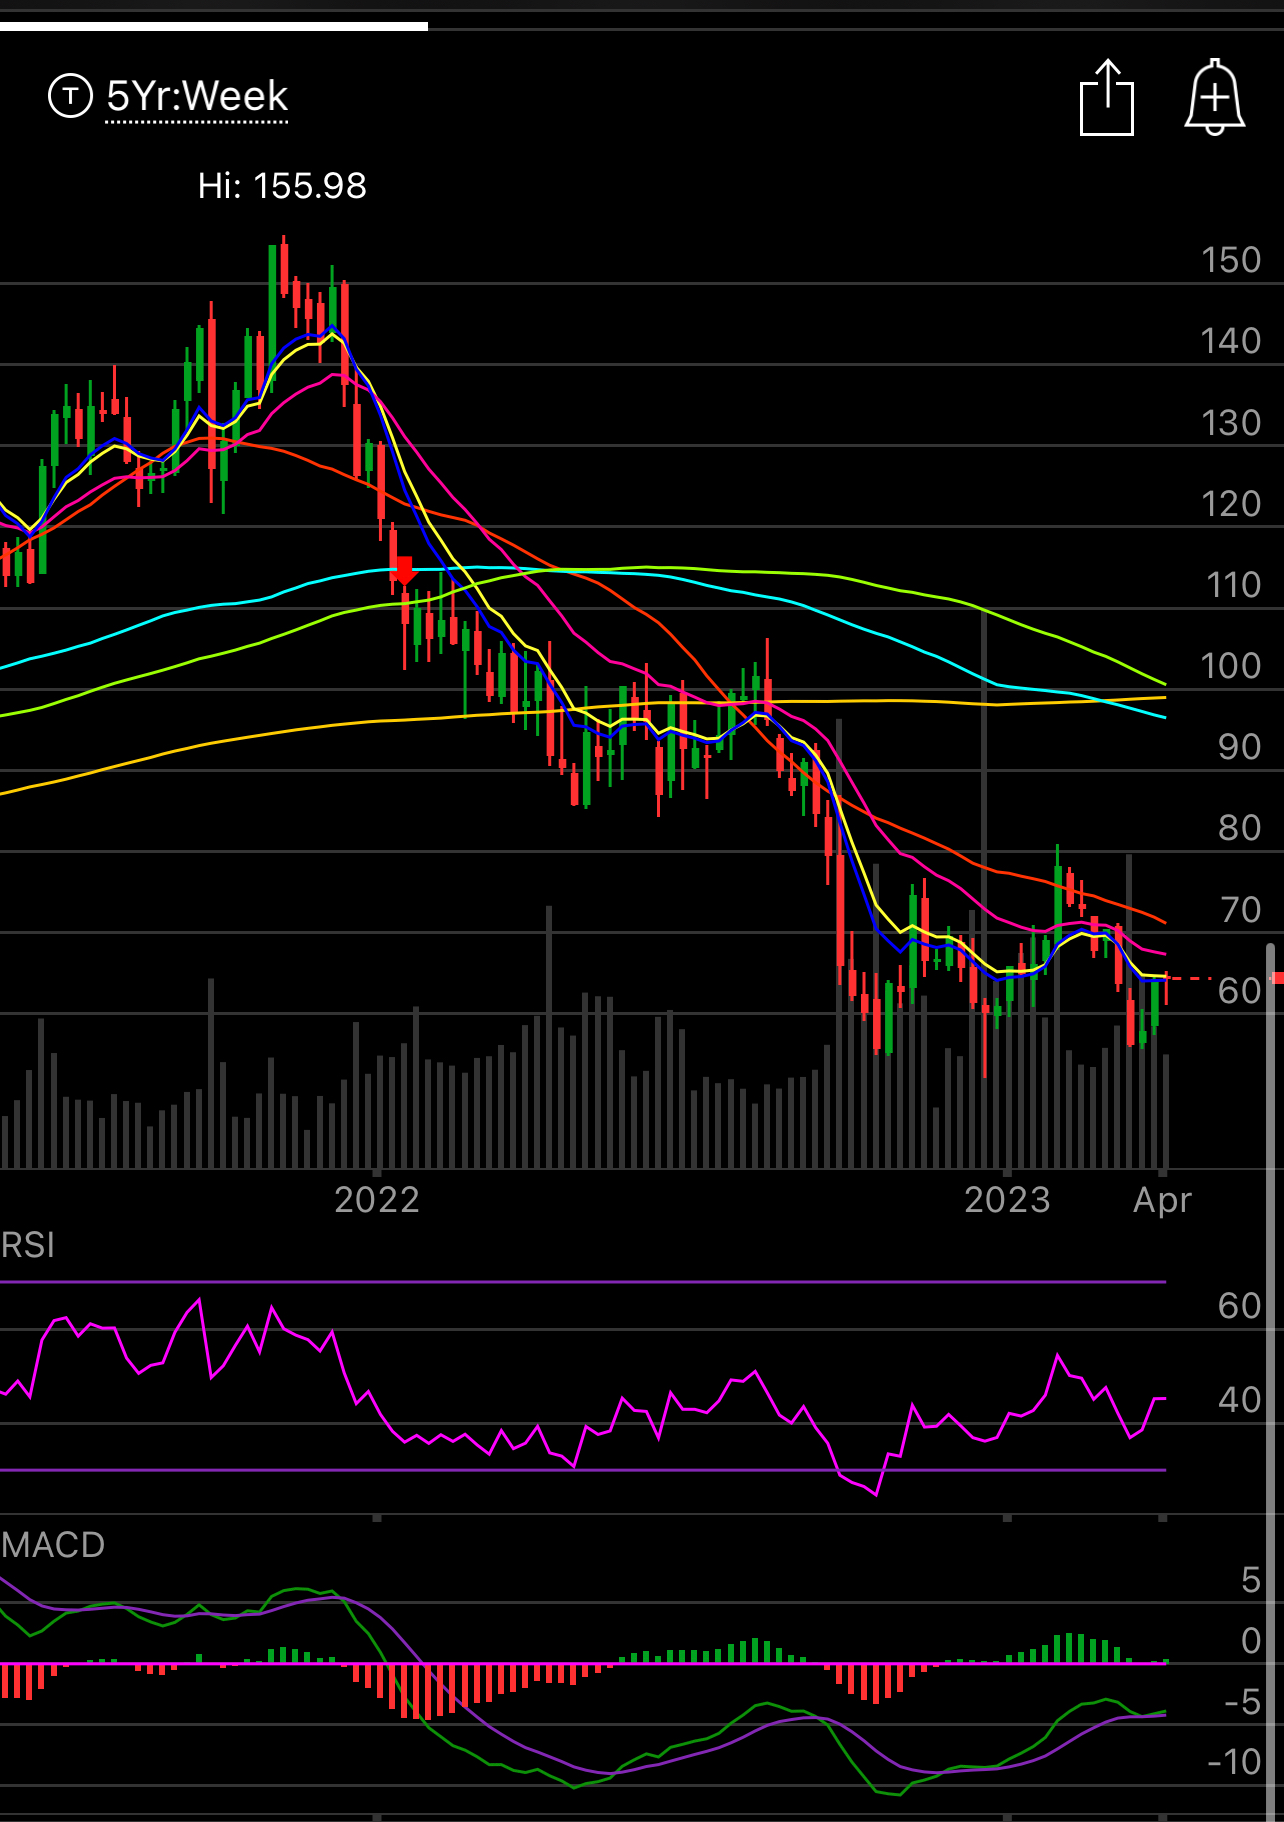
Chart wise you can see how far off the highs this is. I tend to believe lower credit borrowers now facing double digit interest rates pulled back on auto spend, the chart seems to agree with a real lack of buyers as the weekly chart is below all the key averages. There is just no strength here, but these names love to squeeze, so unless you’re a junkie looking for action, this isn’t anything I would touch, but what they say will have ripple effects through many other names.
Delta Airlines
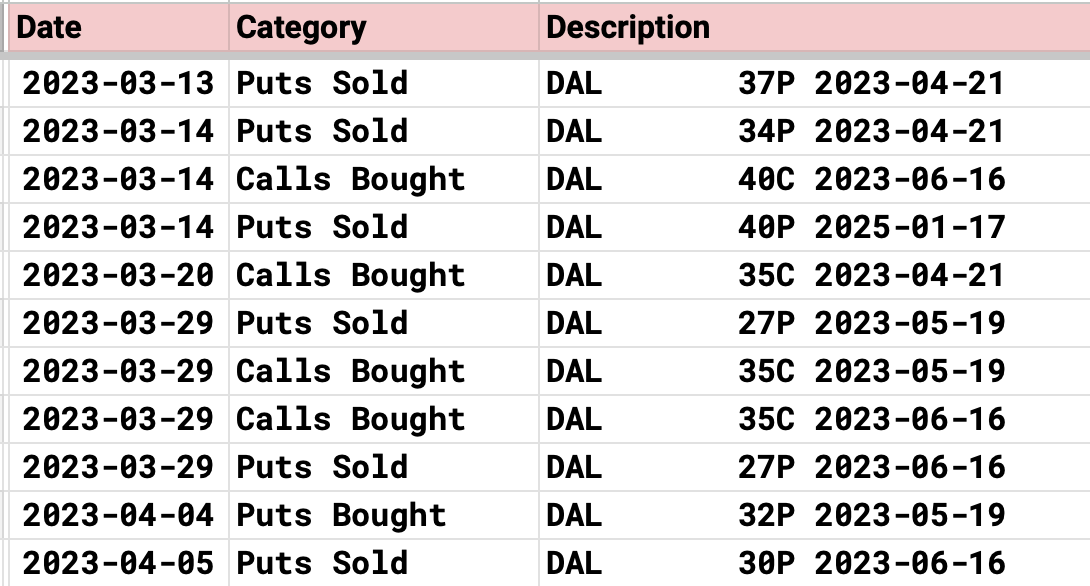
This name has seen 11 unusual sized trades that I’ve noted in the past month and 10 of the 11 have been bullish. It looks like from a level of insitutional support, large put sales were put on targeting $40, $27, $27, and $30. The $40 put sale was an in the money put sale looking for upside. So with names like this I like to look at the lowest put sale and that would be the May $27 puts sold on 3-29. If you insist on gambling, that is the trade that I would follow.
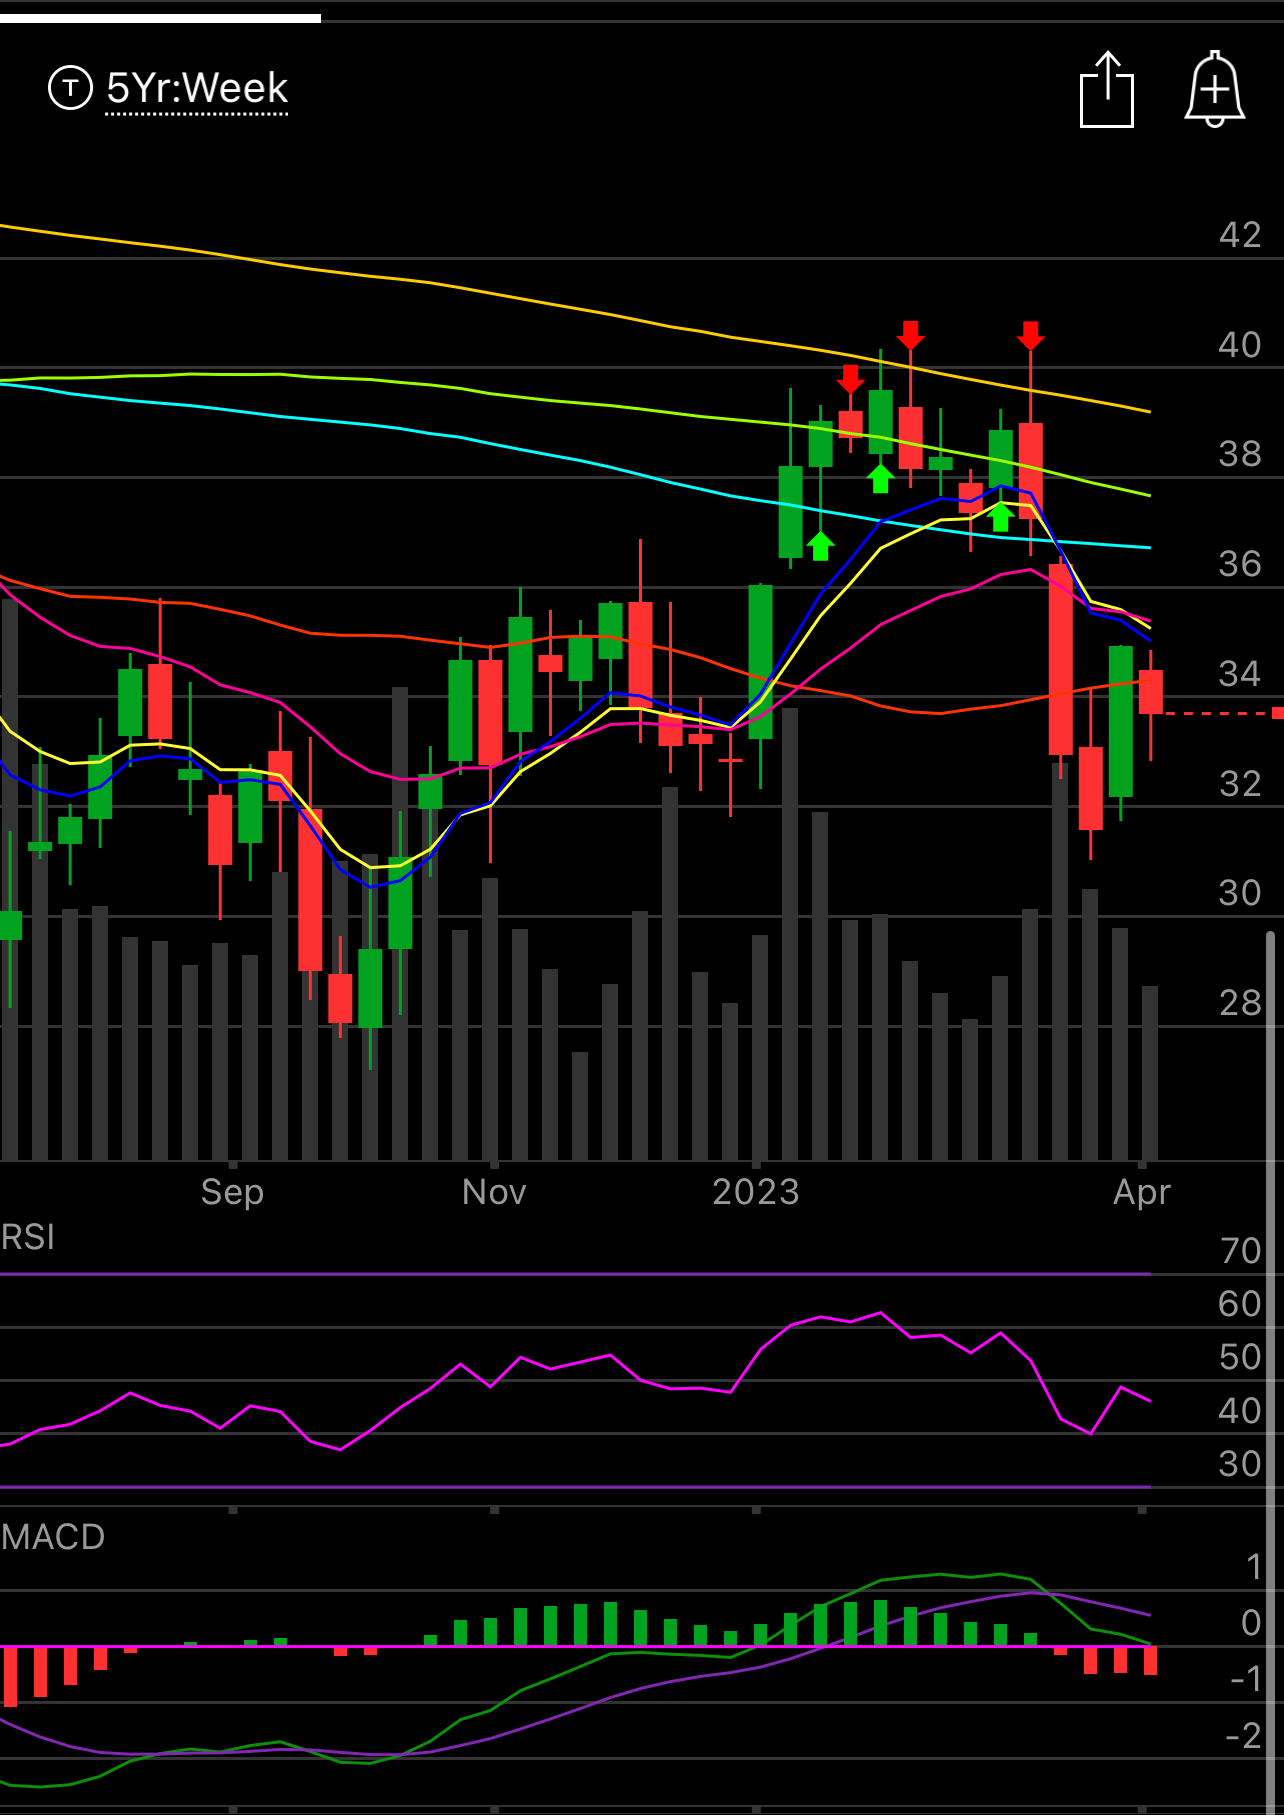
Chart wise, another ugly name. The airlines are just such a hit or miss sector, they’re not long term holds. This chart as you can see is also below all key moving averages on the weekly chart. There is just no strength here. The 27 short puts look to have good support as you can see below the support around the $28 level. I will have more in my daily posts if I do decide to take a shot here, for now I am not in this.
JP Morgan
The best bank in the country reports friday morning and the options flow here are very telling. Look at all those similar trades, what do you see?


