
4/8 Best Idea: A Big Monthly Breakout Is Unfolding.

SLV
Look at this monthly chart below, that is a clear breakout on a very long timeframe. The silver bulls are finally having their day in the sun. As silver continues to see bullish activity in size everyday, it’s time to play this precious metal. The MACD on the monthly is flipping green for the first time in 2 years and we have a clear trend to use as a stop loss.
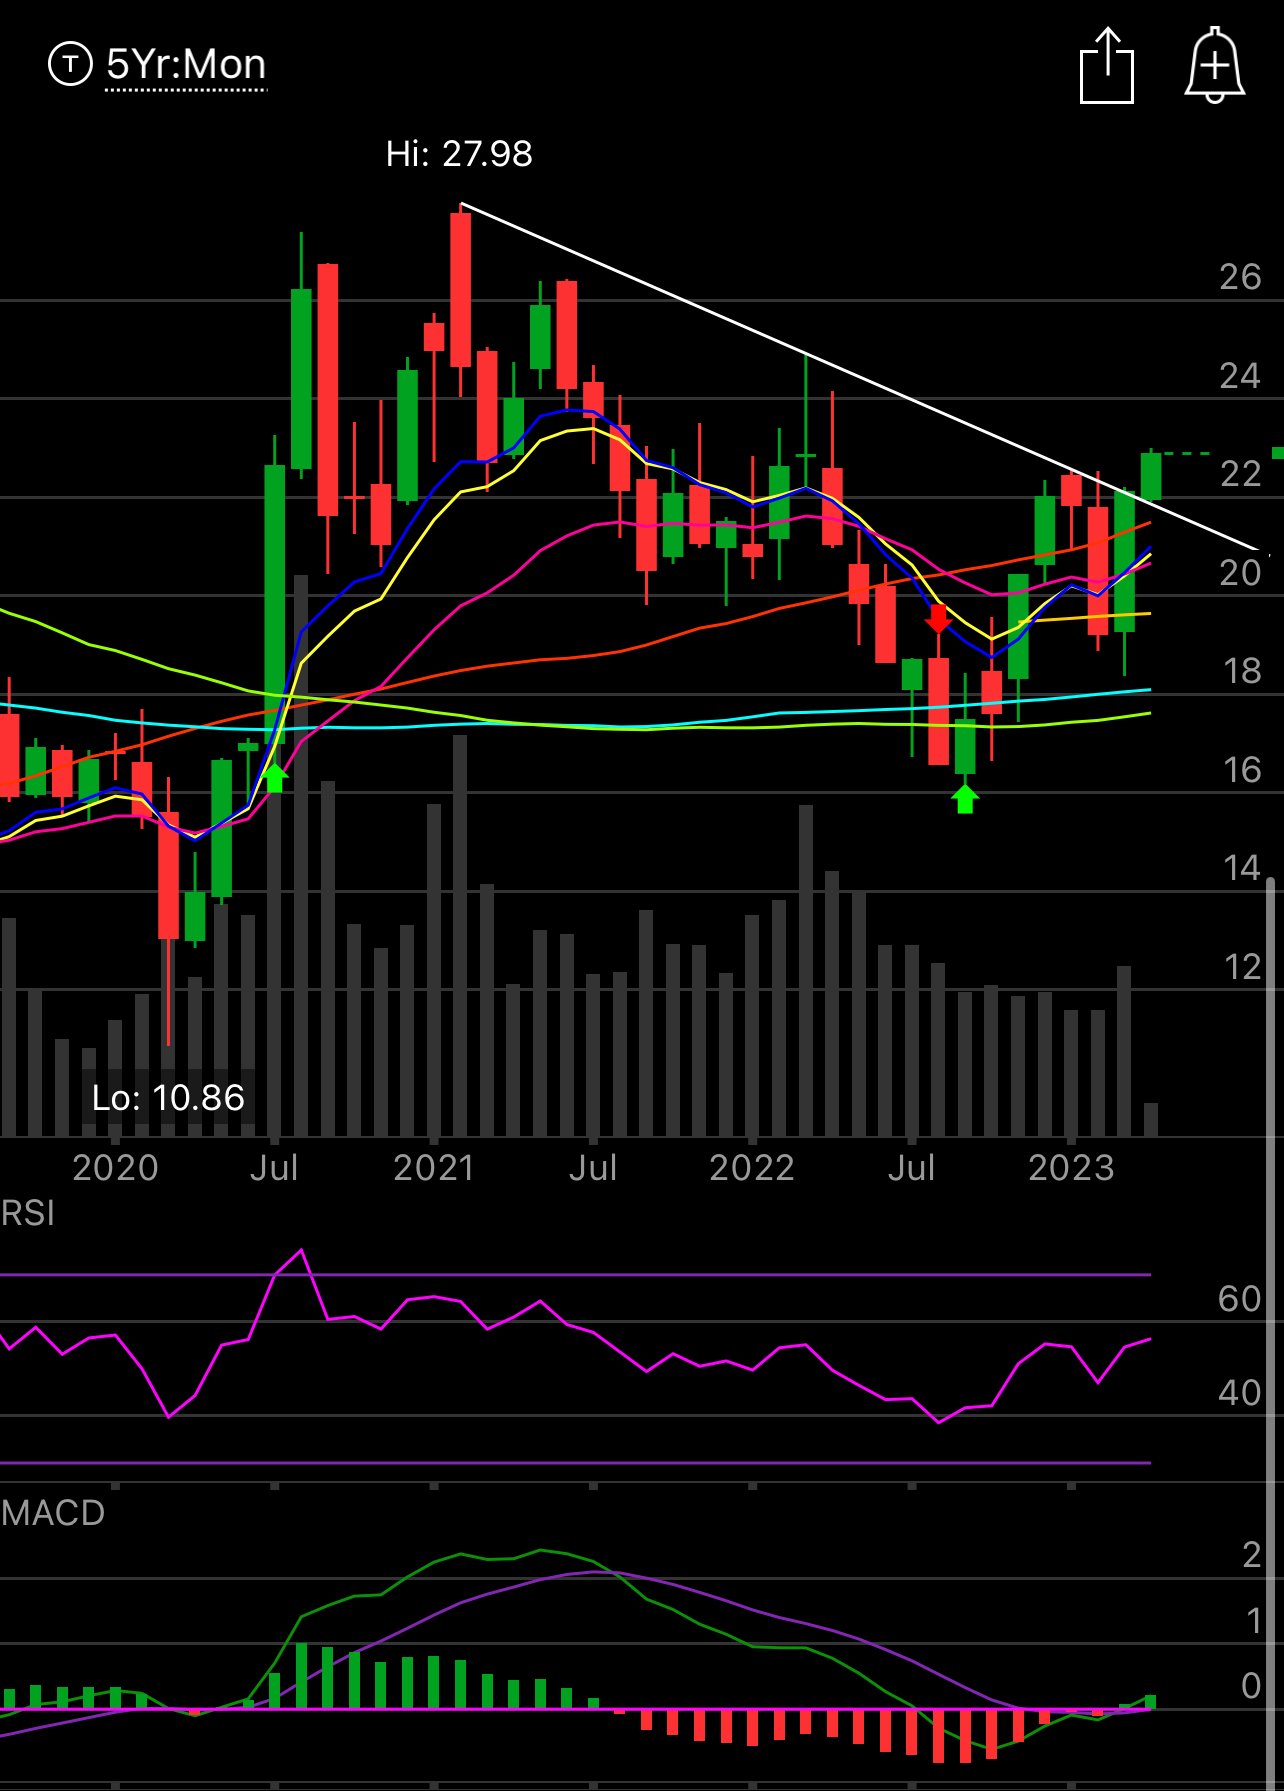
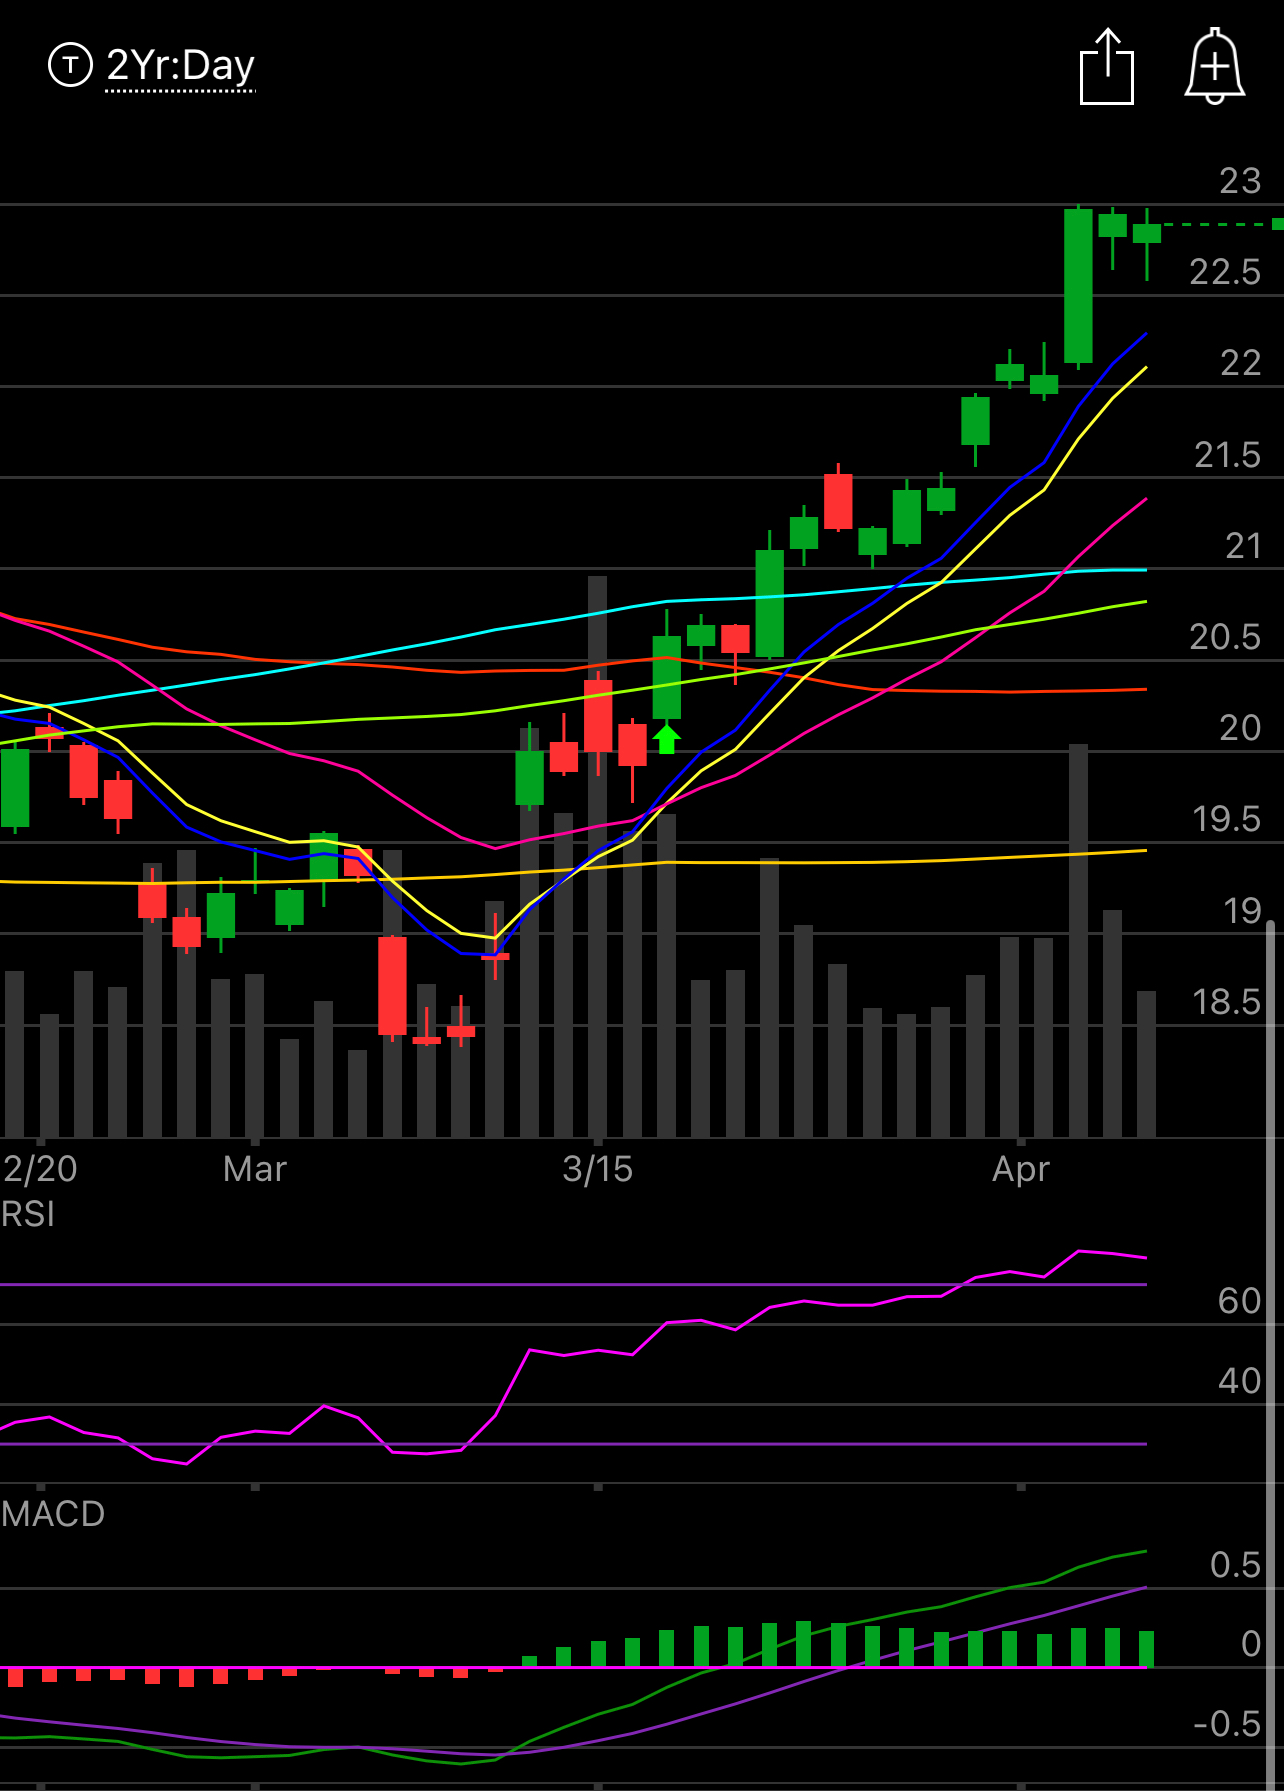
The daily chart is a little extended so a pullback wouldn’t be shocking. Look where the RSI is, it is off the charts, but the name seemingly can’t see a red candle anymore with 11 green ones in the last 12 sessions. When a name gets extended like this, but also breaking out in the process, the only way to play it is to sell puts lower and wait for the RSI to cool off. See the gaps below, I want to go below those somewhere around $18.60 as a worst case scenario.
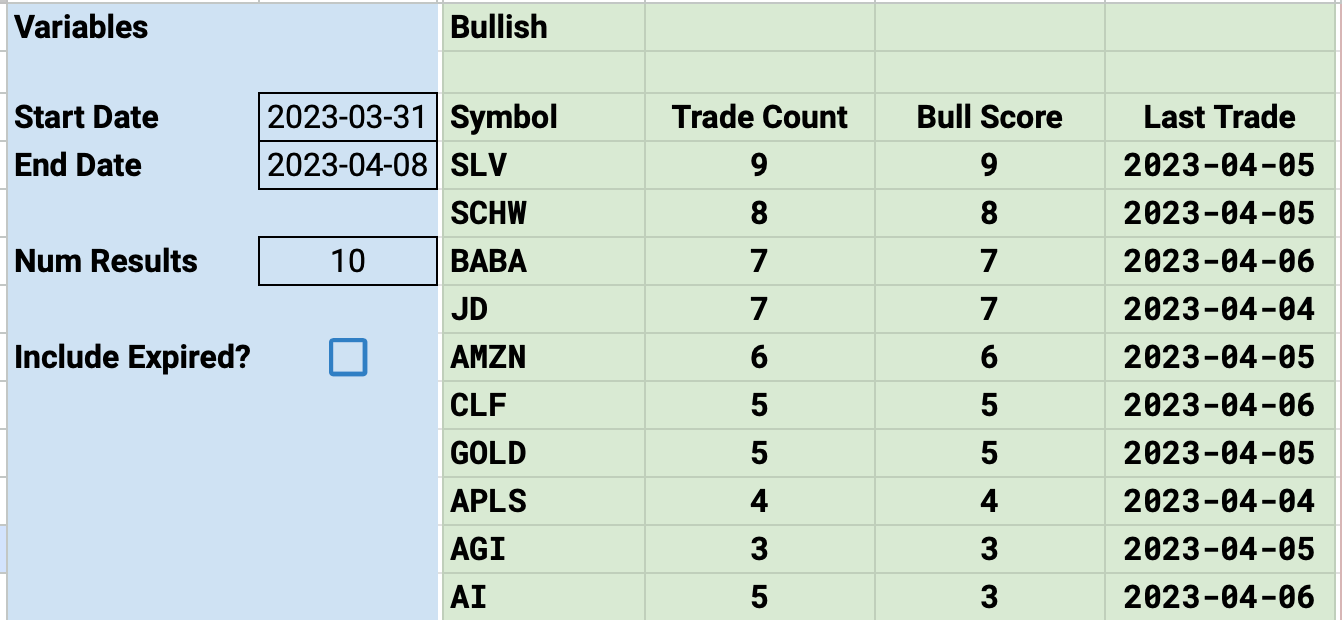
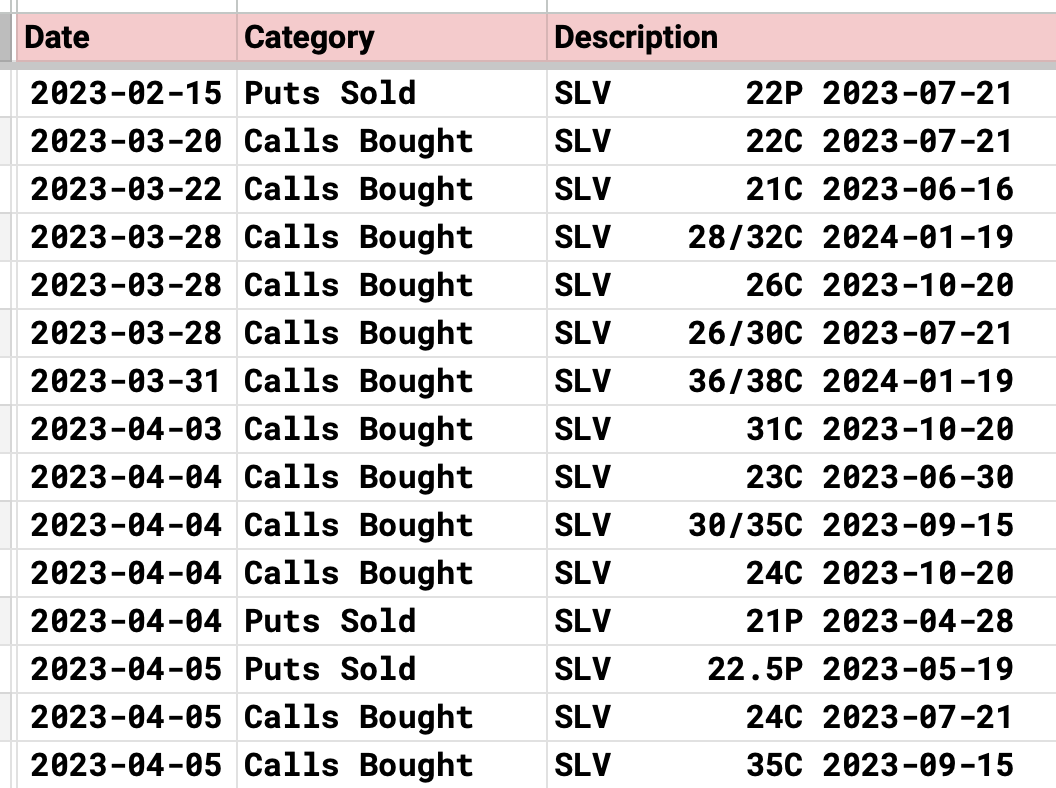
In my database over the past week, SLV was the clear leader in bullish activity.
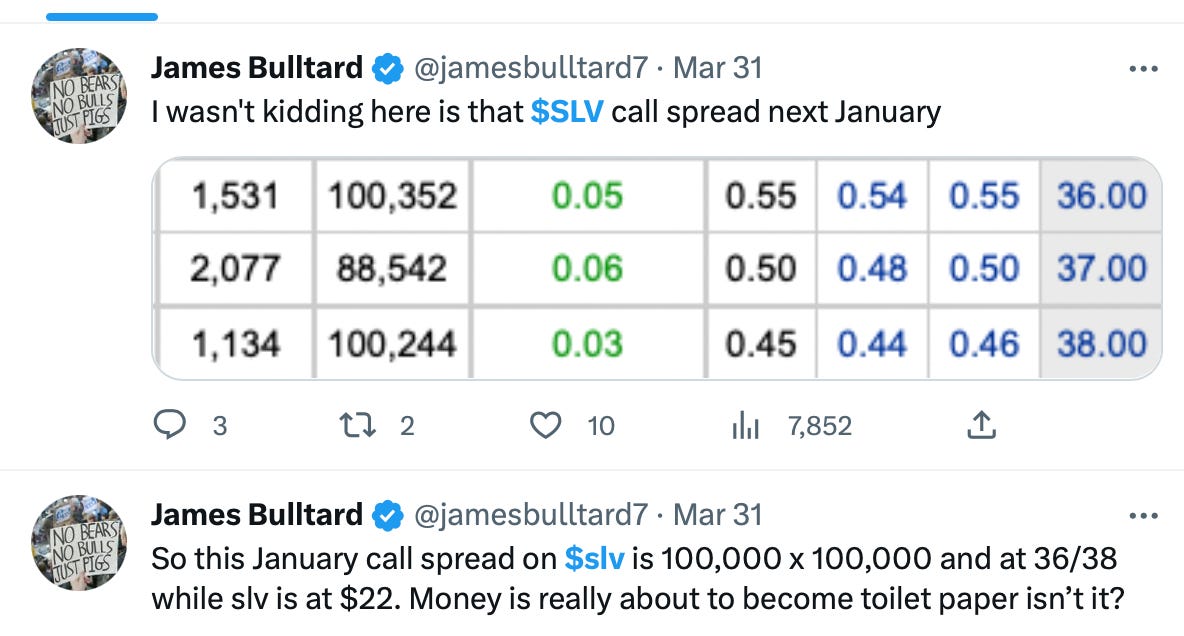
It almost felt nonstop, as you may remember the week before I noted this one monstrous trade at 36/38 where 100,000 call spreads were bought for .10 to potentially make $2 but the size and near 100% OTM nature of the trade was what caught my eye.
Over the last 2 months these were the unusual trades I noted in the name. The amount of calls 20% or more higher are staggering. The put sales are all at the money and that makes sense as the breakout should hold.
So how would I play this? Personally I’m very conservative with something like this because SLV is something that is a very highly manipulated paper market. While I’d love to think it just goes in a straight line over $30, I know it is never that easy.
Back to the monthly chart I posted above, a re-test of the breakout almost always occurs. The focus has to be on getting long along that breakout. You can sell shorter term puts along that because the risk/reward is favorable, a break back below that and you can close it and move on. Of course I like to lever up and sell leap puts in uptrends

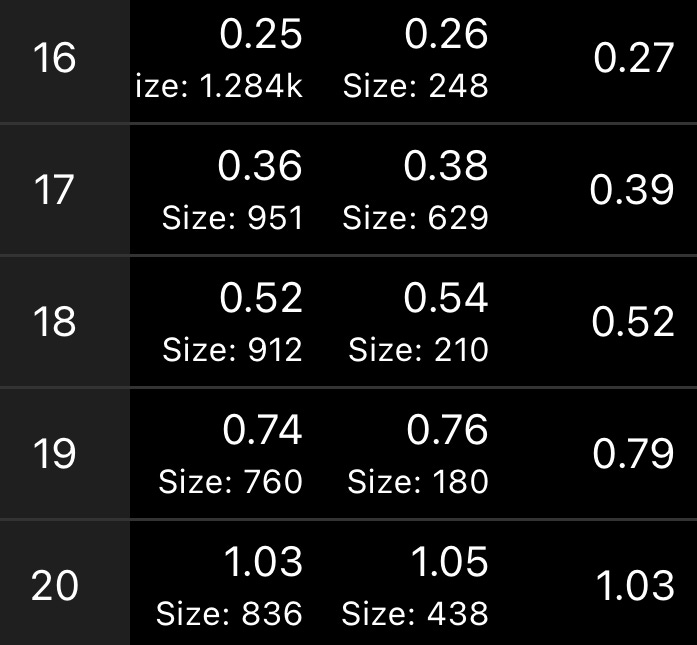
When I look at the put chains, going out to January, the $20 level should hold or the breakout failed. You could sell naked puts at $20 for $1.03 meaning your cost basis is $18.97, well below today’s price of almost $23. You could sell a put spread at something like $19/16 for a credit of .79 - .27 which is .52 that particular trade would mean you’re risking $2.48 at most to make .52 which is a 20%+ return on your risk assuming SLV stays over $19 come January.
There are many ways to play a name like this, but the bottom line is the trends are bullish, the charts are bullish, and we want to play names with both in their favor.
As I said last week, tomorrow morning, sunday April 9th at midnight, the price of my substack will be increasing by quite a bit. So for those on the fence this is your last 24 hours to decide. This will have no effect on existing users. All of you will forever remain at whatever price you signed up for. For many that is $19/month for others its $29,39,49. Your pricing never changes it is just for new users.
Also I’m going to try to split this up so saturdays will be strictly the best idea and sunday mornings I will post the chart setups I like into the following week just to keep things separate and more organized.
This platform has alot of cool stuff coming up that I’m lucky enough to be in the beta testing for, soon they’re going to be releasing notes which is basically a more curated version of Twitter. That move is what upset Elon Musk to the point that he banned Substack today. No more links from Twitter can be shared here, no more substack links can be posted on Twitter, etc. It’s a shame he did that, but it is what it is.
Anyways I hope you all have a great day and I will see you tomorrow morning with all my best charts for the week ahead.
Thank you.
I am a new member, and I am happy I joined.