5/29 Recap
We gapped down below the 8 ema this morning on the SPY, you can see it right below the dark blue line. I’ve always said my personal barometer of trend is the 21 ema, the light blue line below, as long as you’re over that, you can press longs, sell puts, whatever but when that breaks like it did in April, you saw what happened then. We have alot of economic data this week that will determine where we go next but consider today a warning sign when you break below a big short term trend like that.
The yellow arrow at the bottom is the negative divergence I’ve been pointing to since last week you can see momentum is about to flip negative. I’m not saying sell everything but again, like April, I would begin to lighten up things you aren’t interested in. We’ve had some crazy moves recently with NVDA gaining $500B in 3 days, basically an entire Exxon Mobil, and the warning signs are slowly emerging in the technicals. Longer term, things are fine and I fully expect ATH still by election time in 5 months. I don’t like to get bearish until there’s confirmation on a chart, we haven’t broken the 21 ema as simple as that, nothing to worry about yet, we’re close so exercise caution is all.
Today was really weak buying, below was $TICK today, that is a measure of upticks minus downticks in the market. You can see at the open we had a massively overdone -1500 print which is very extreme selling but more concerning is the high TICK so far is 315, meaning there was very little buying today and stocks really aren’t down. More of the selling going on under the hood even as the market isn’t declining.
Recent Trades
In the 5/20 recap I highlighted these odd CHWY calls bought at for the last week of June for 1.24, Chewy is up 30% right now to $22 and those calls just traded for 5.30 for a quadruple and some in just 9 days. Yes I know there were puts bought too, but I rarely ever look at puts bought or think much of them because the majority of the time put buys are just hedges.
If you utilized the risk reversal I laid out below you got paid to put this trade on and can now close those short puts for .44 from 1.50 and add in the calls over $5, that is a very big win for less than 10 days.
Trends
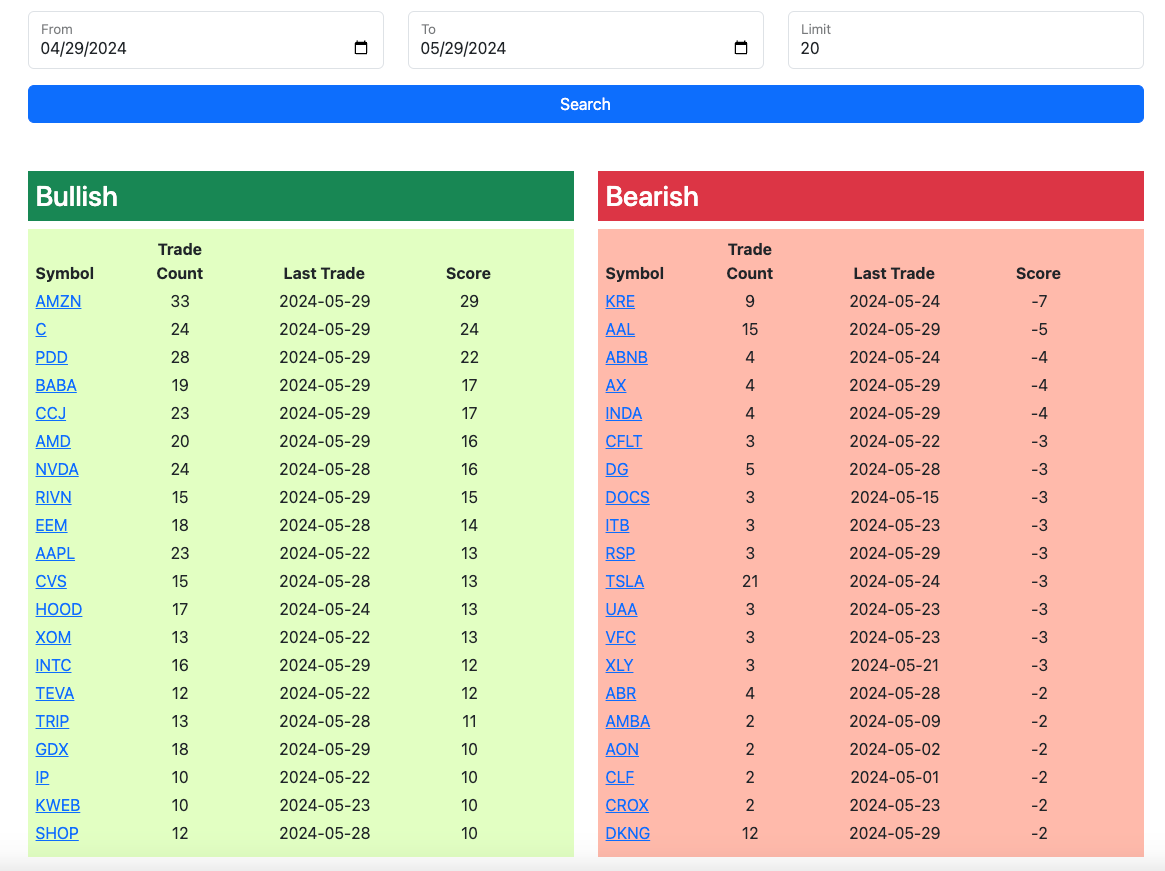
These trends continue to catch moves with AAL being the 2nd most bearish name over the past month and sure enough today it is down 14.5% right now. AX also was the most bearish name over the last week and it is down 3% today, those puts I highlighted friday were up quite a bit this week. It’s so hard to play the short side of the market with everything constantly being bought but these trends can help you see where the put buying is coming in over and over and the American Airlines repeat put buyers were on the money.
1 Week
2 Week
1 Month
Today’s Unusual Options Activity
Here is today’s link to the database, as always it expires at the open tomorrow, I will have the rest of today’s trades logged throughout the afternoon.


