
6/8/25 Best Idea For The Week Ahead

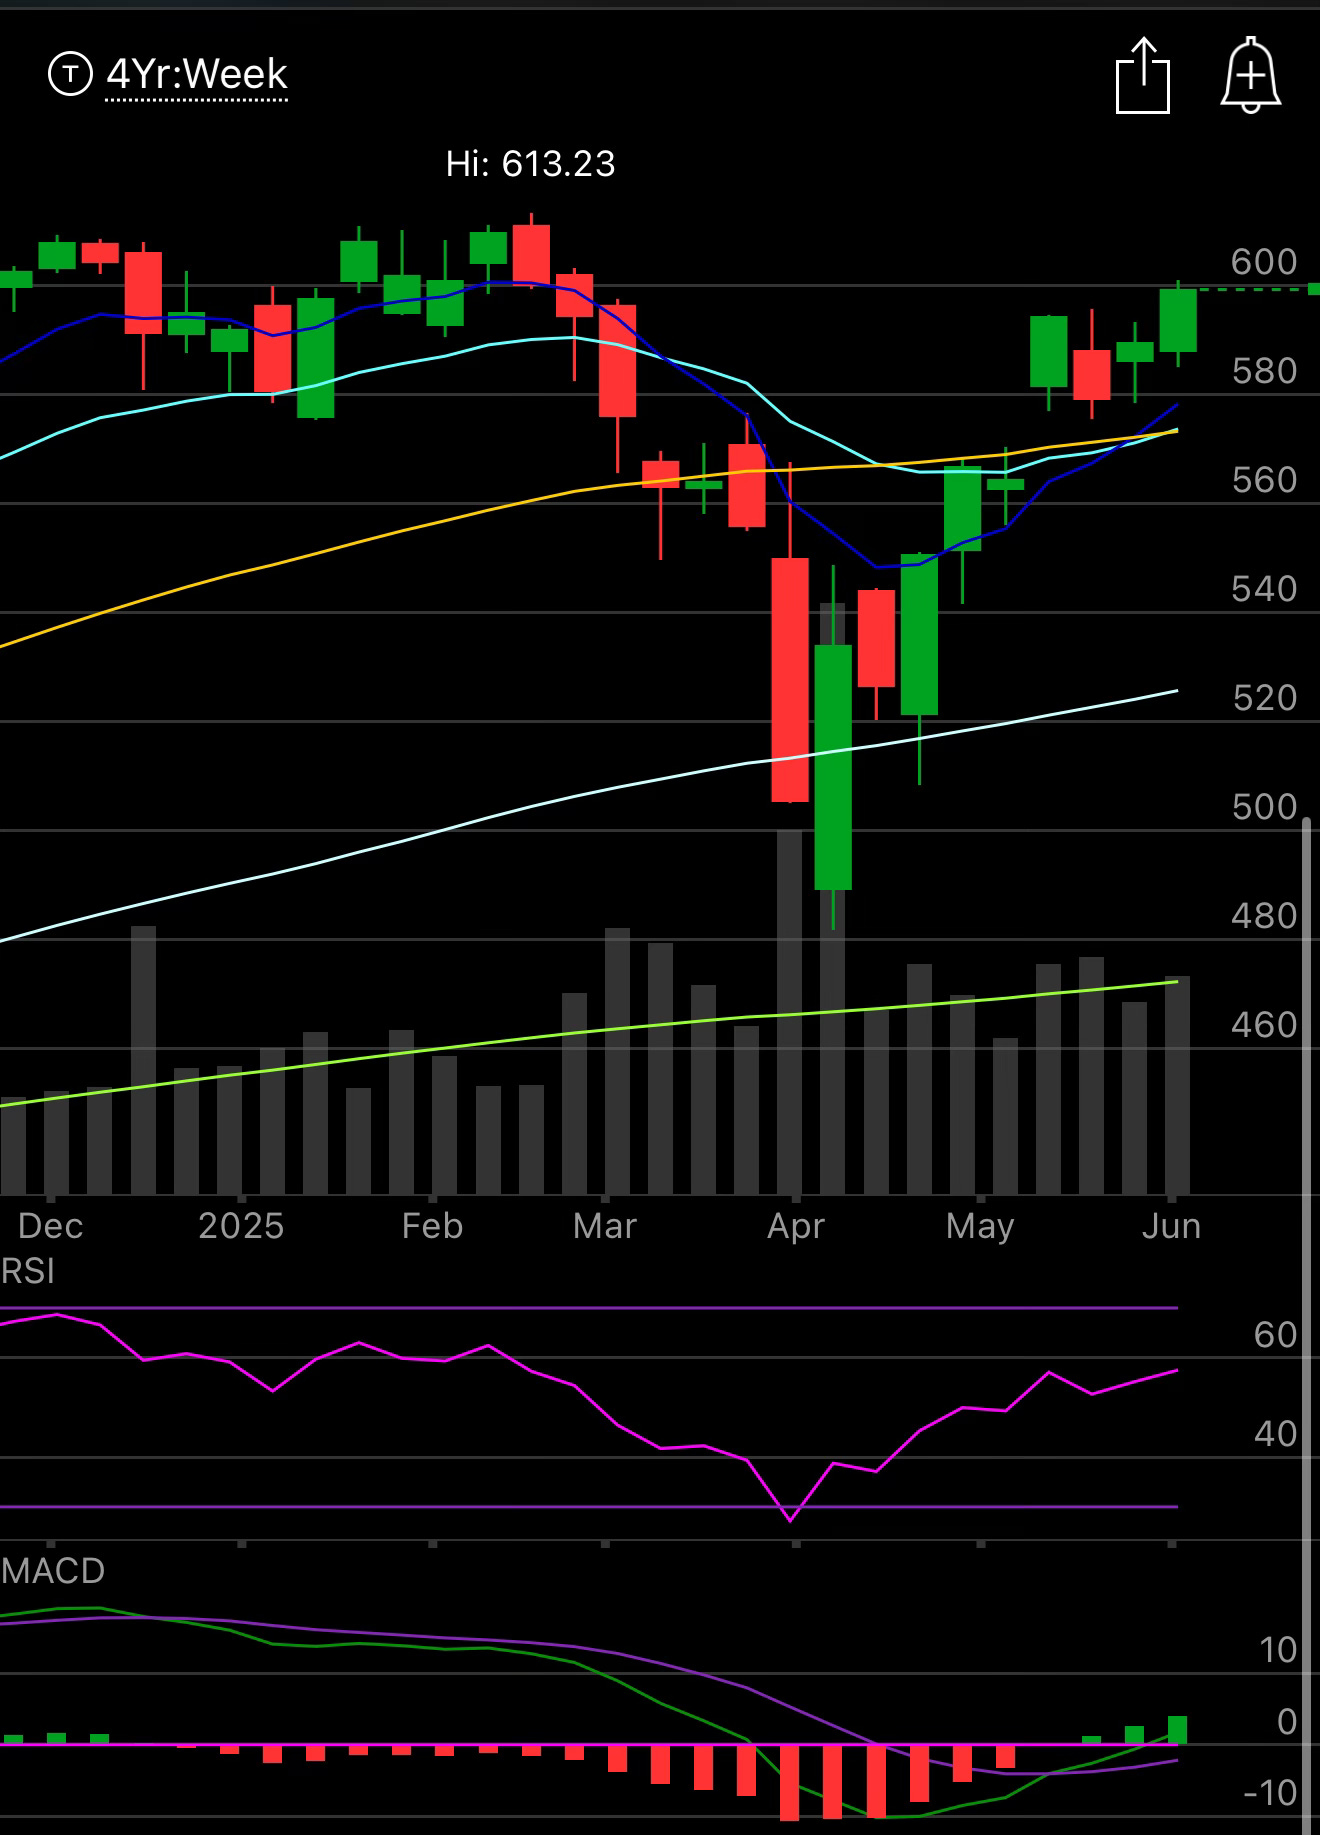
As we look at the weekly chart of the market below, the SPY is breaking up from a small sideways consolidation the last 3 weeks and now nothing is stopping it from testing those 613.23 highs. Use that 8 week around 580 as your level to add on dips, but right now this market is looking very strong. Trump said today we are pretty far along in our framework with China on a deal, the bulls will love that one next week. For now though, the pump is on in the low volume summer months when lots of the big money is on the sideline. This is a mess for all those who decided to wait as they will be forced to chase when they get back from summer vacation. Don’t look now but we are even higher than we were when 2025 opened, and considering all that has transpired since, bears have to be deflated right now.
This weeks best idea is the hottest name in my database over the last week, I have some short puts on it myself, but there is some heavily bullish action going on and we are going to look at 3 different options trades to play it depending on what you’re trying to accomplish. Alot of you are new and always ask me why I mention the combo risk reversals so often.My stance is simple, calls are risky, the only way to play them is using short puts to offset the costs of buying them. Every stock is a buy at some level and your short puts should always be at those key spots. You can tilt everything into your favor as much as you’d like with how many short puts you end up selling to drive more of a credit to yourself. You don’t have to just buy calls and lose money if you’re wrong, when a trade is placed for a credit you can be wrong on the calls and still profit. That is a very powerful thing. You are tilting probabilities in your favor now.
SLV
What Is It
This is the best way to track the spot price of silver with an etf.
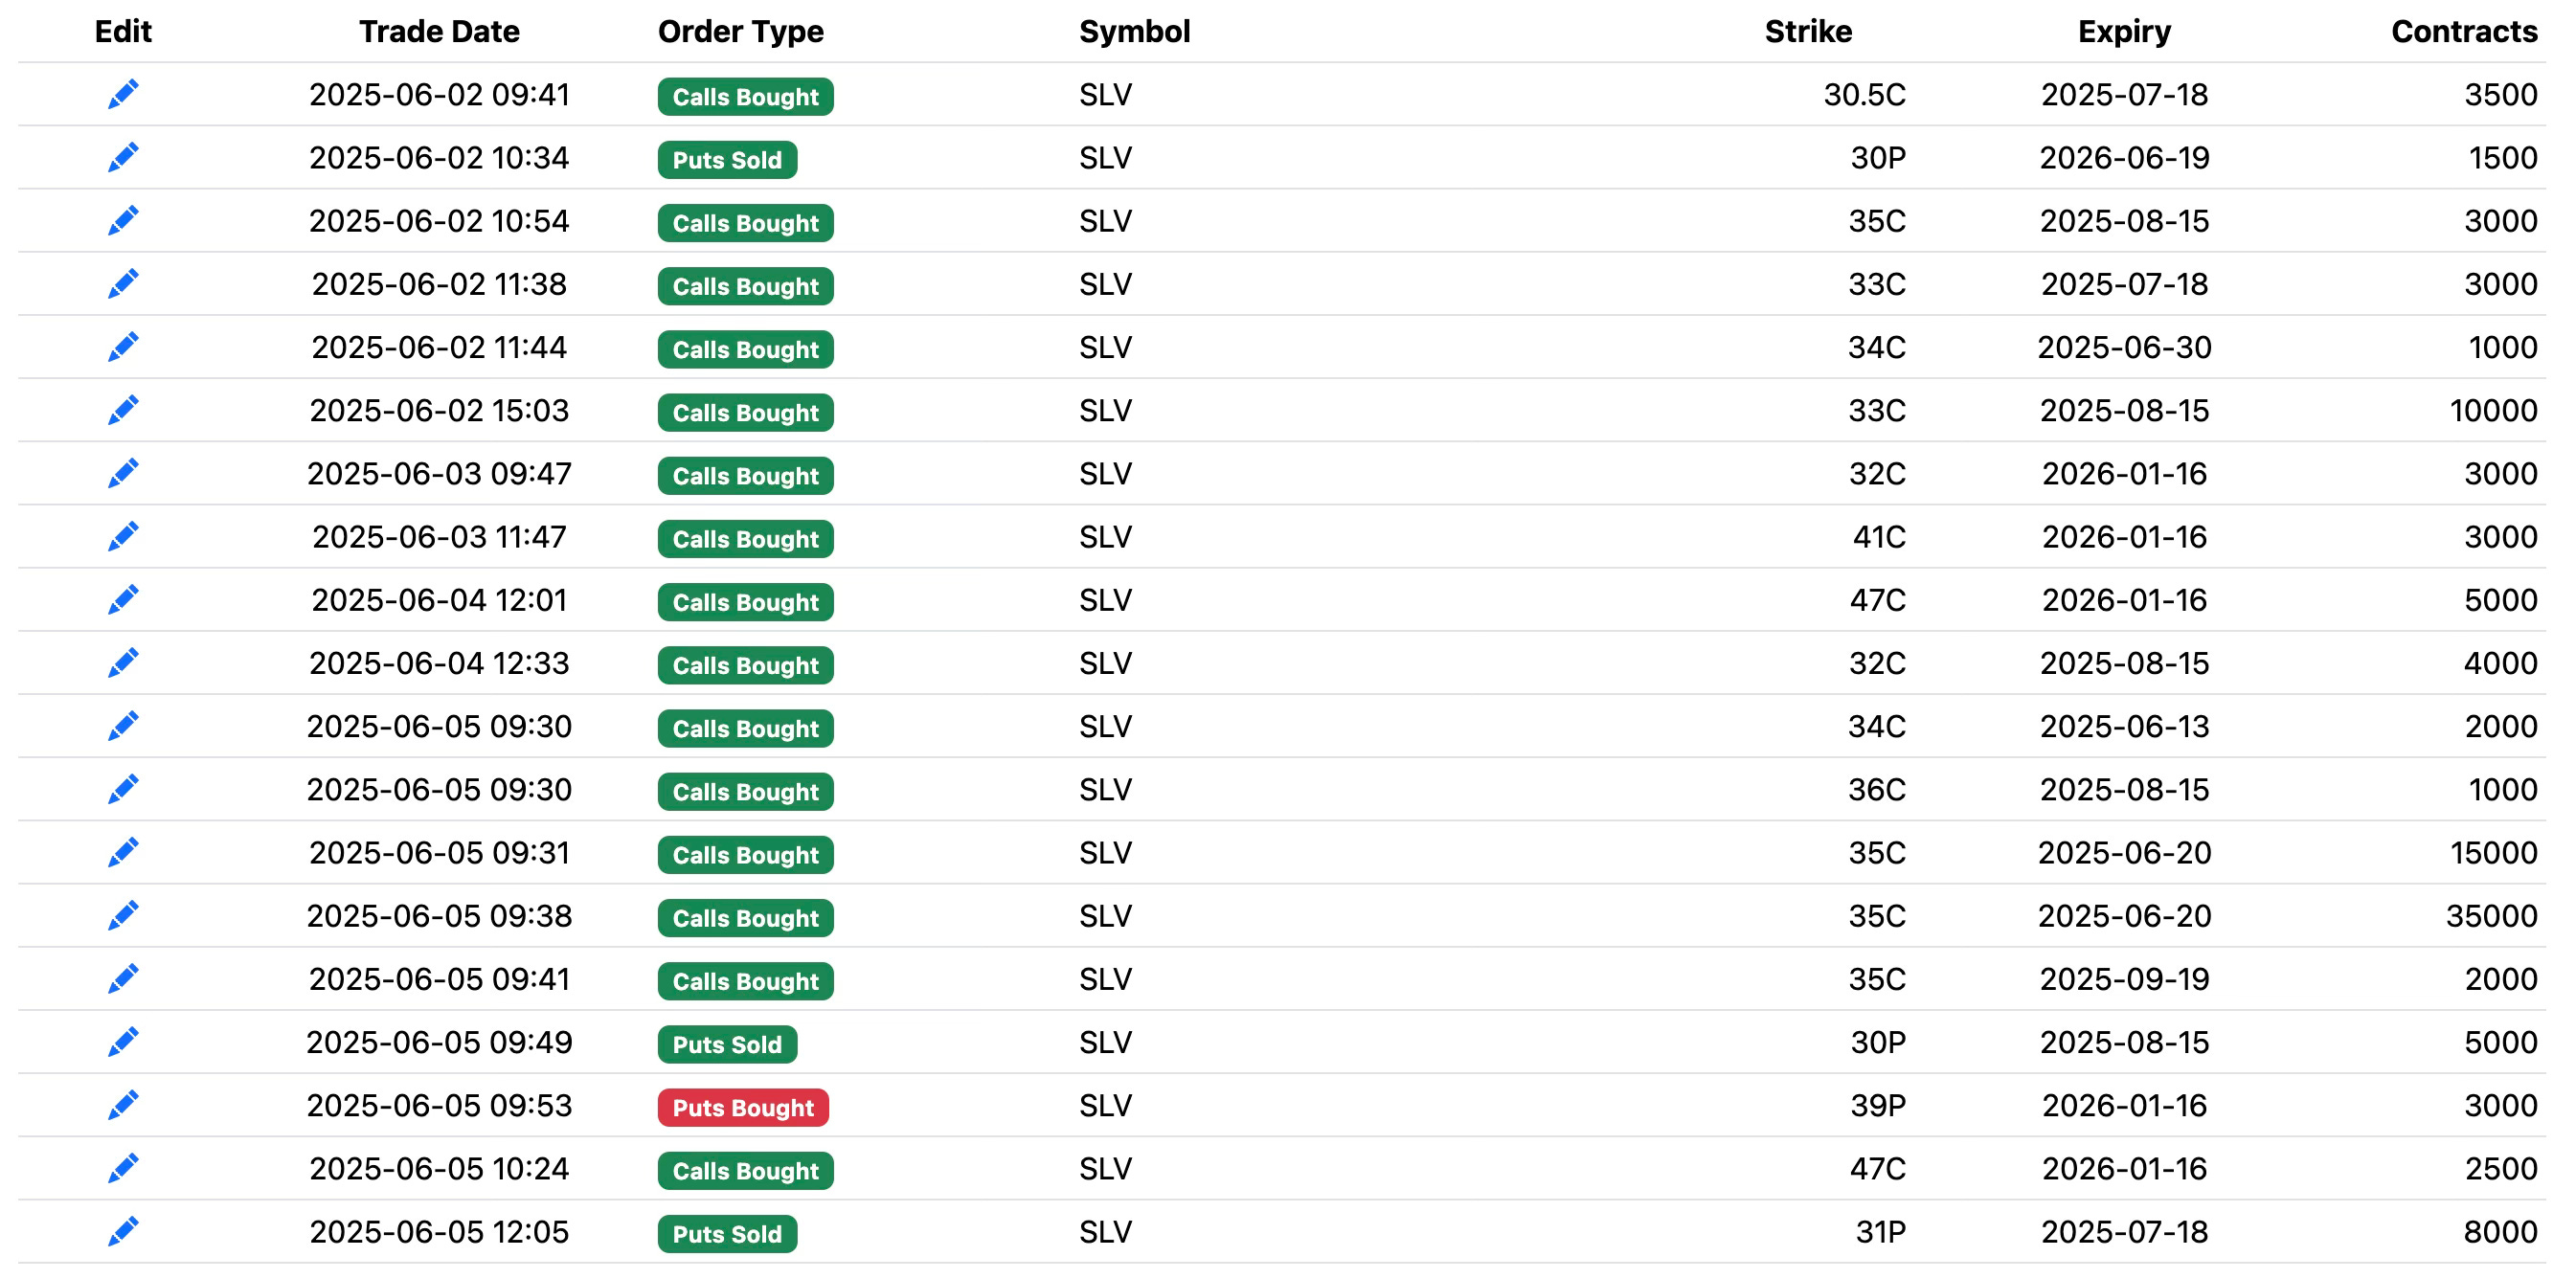
Option Flow
This is just what I flagged this past week. There are tons more trades to see in the database. This had 18 bullish trades of unusual size this past week.
Charts
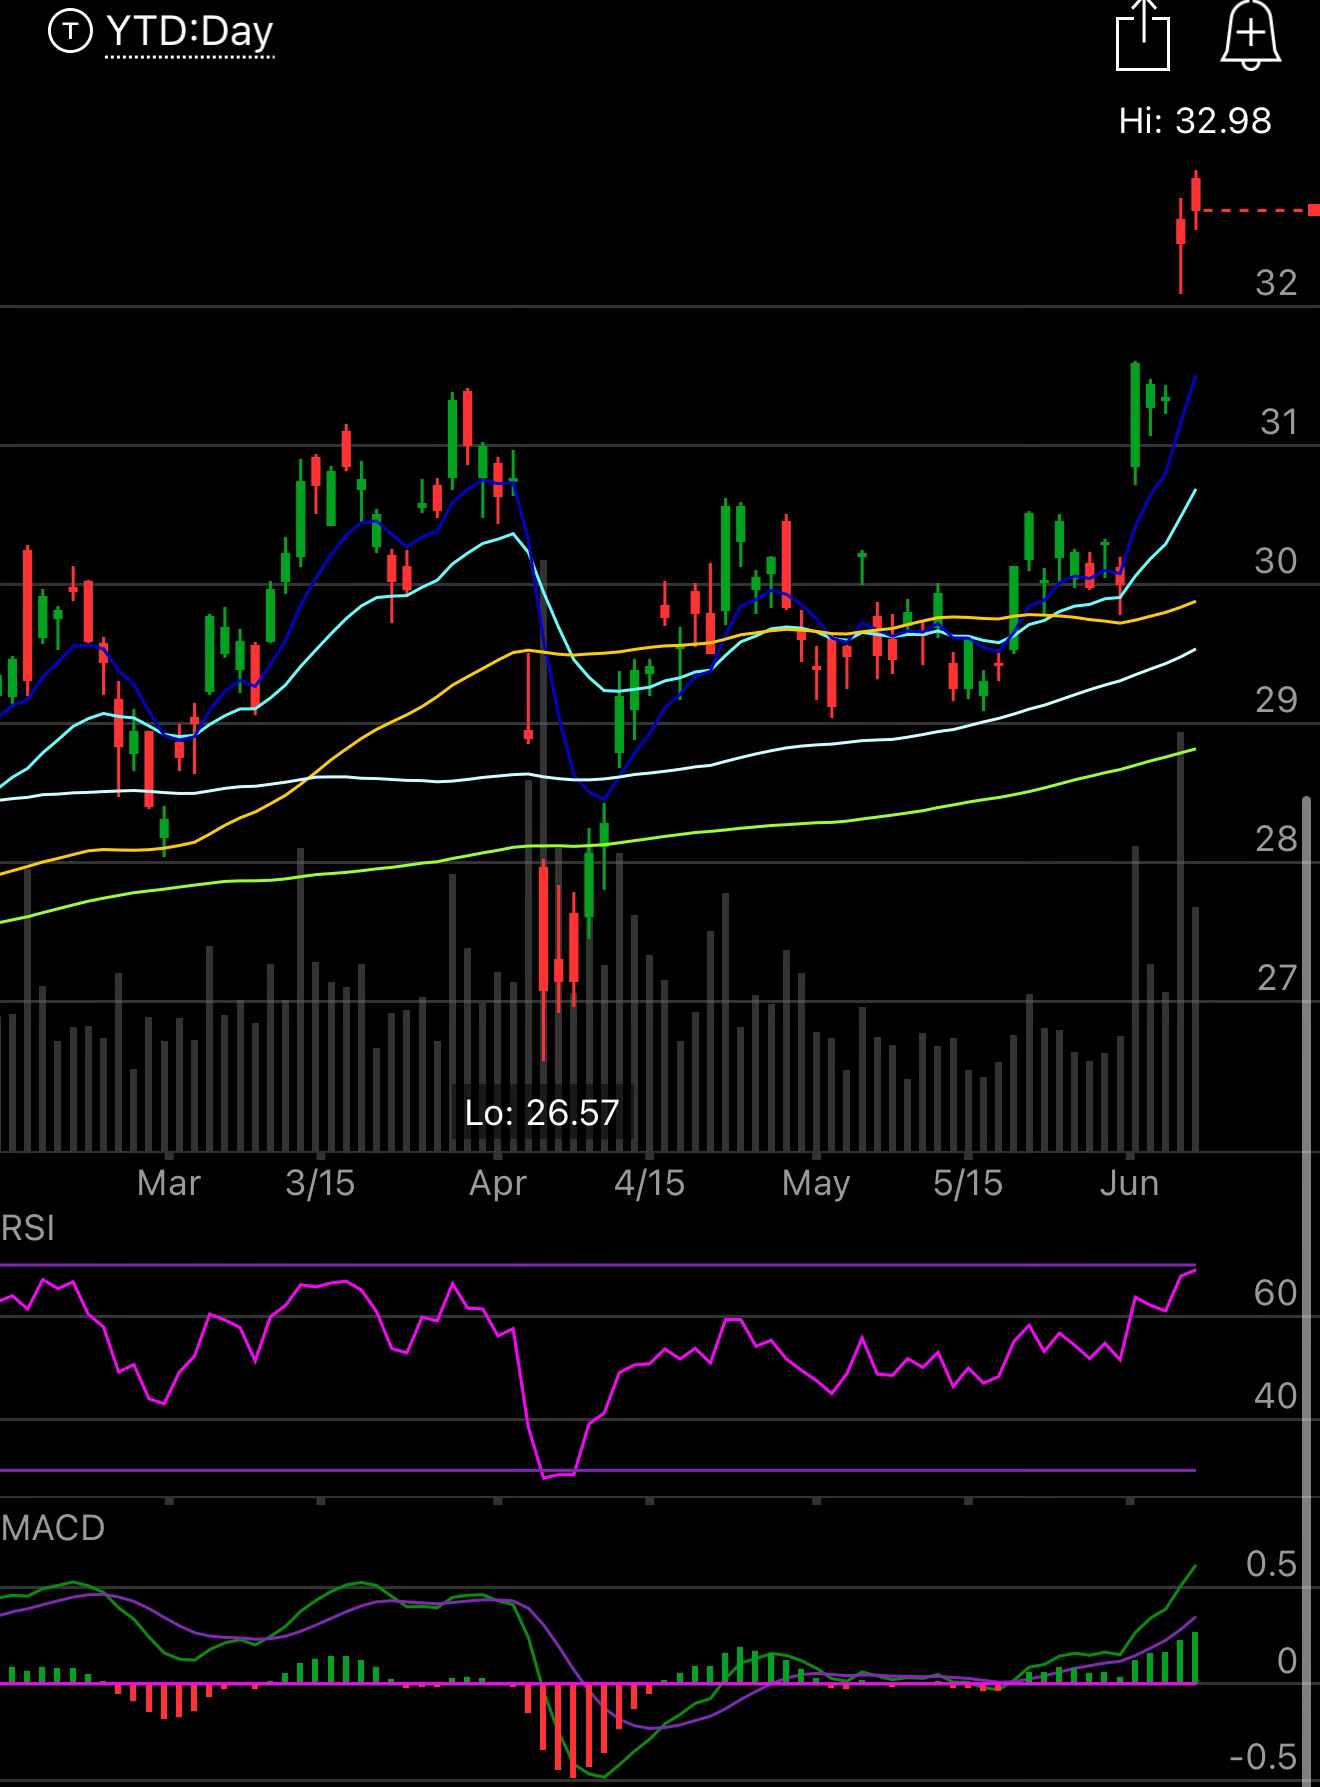
Daily - The daily had a ton of gaps below, one around 31.5, another near 30, and one near 28.5. I targeted 28.5 with my puts sold in January for that reason, with the 200 day beginning to slope up under 29, I don’t see a reason those would be put to me in the near future.
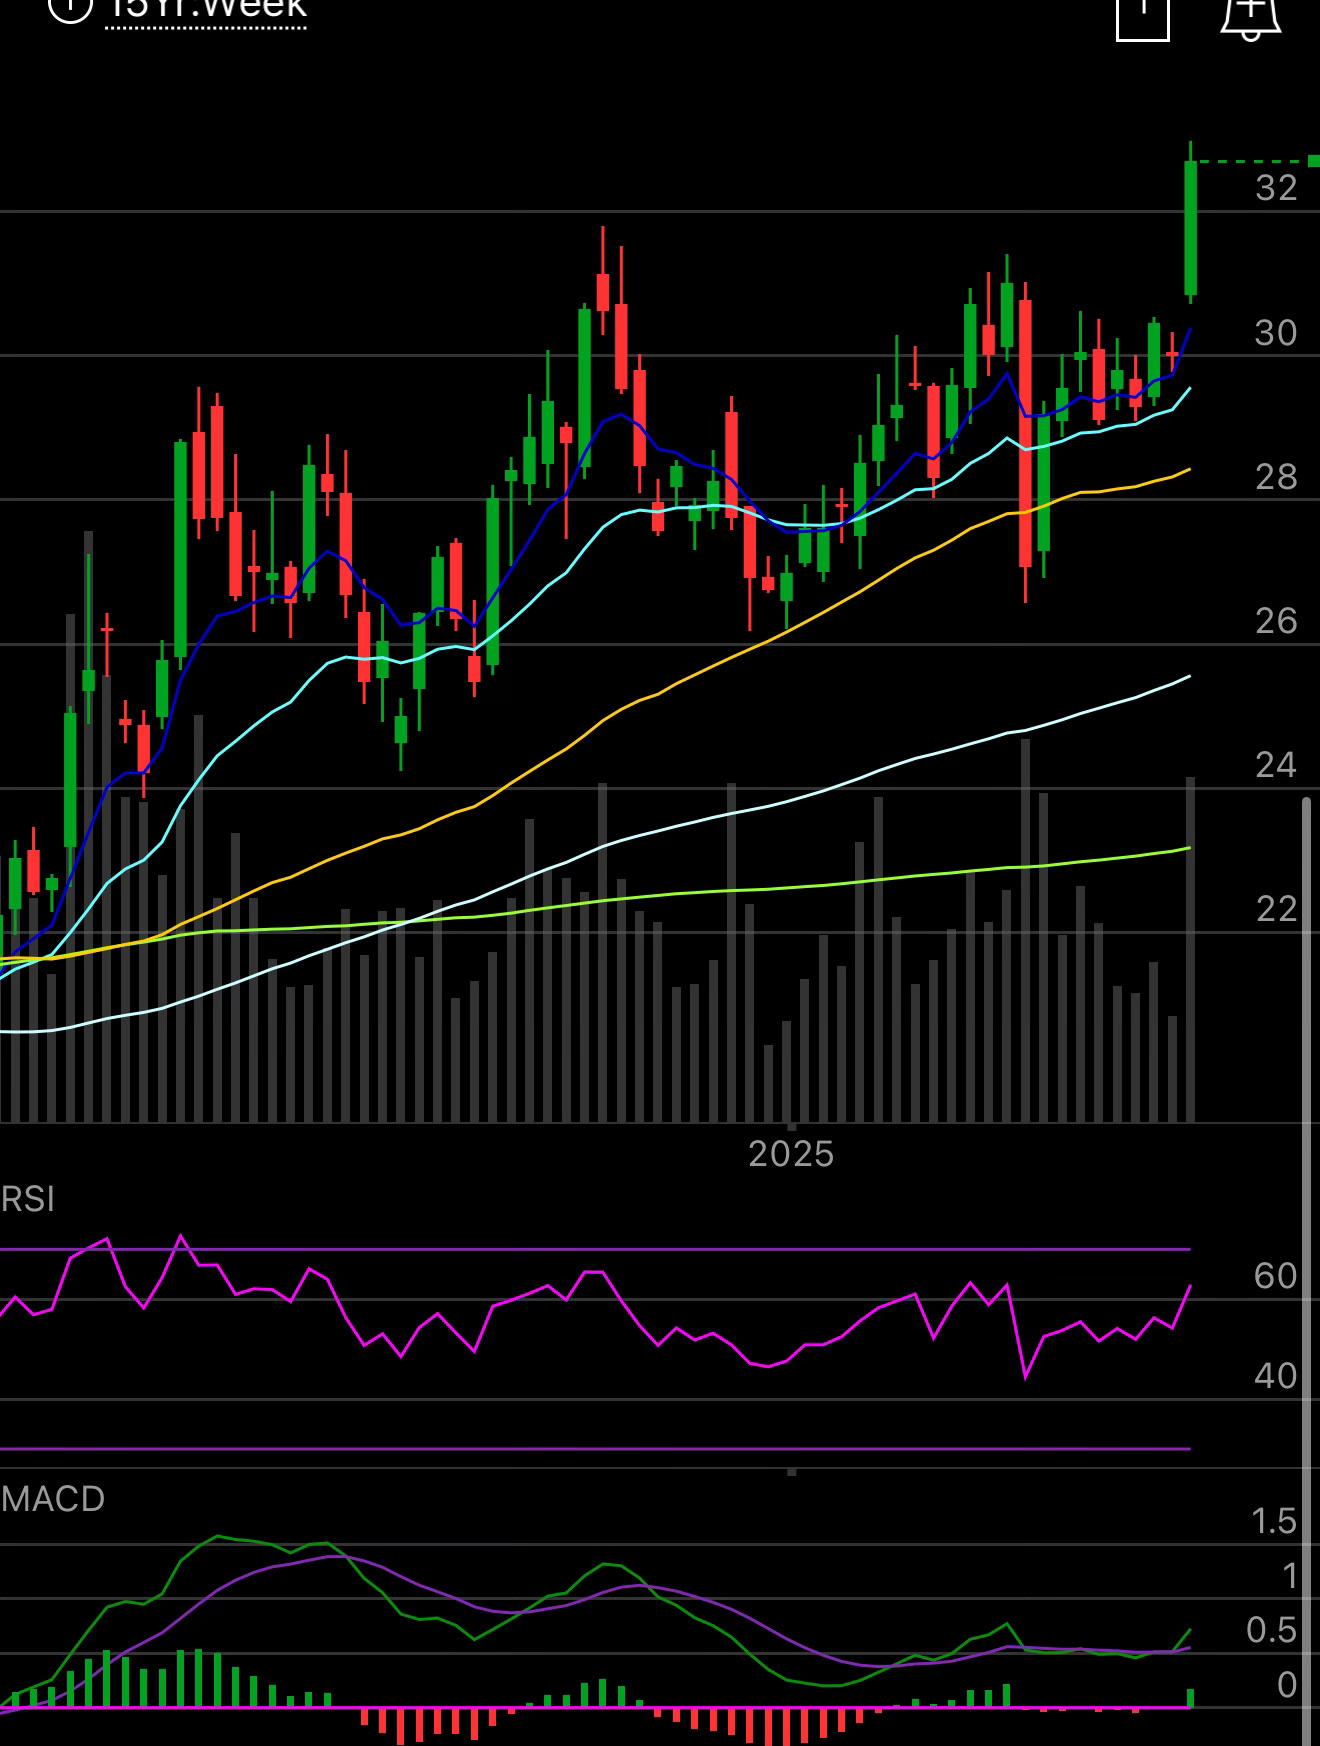
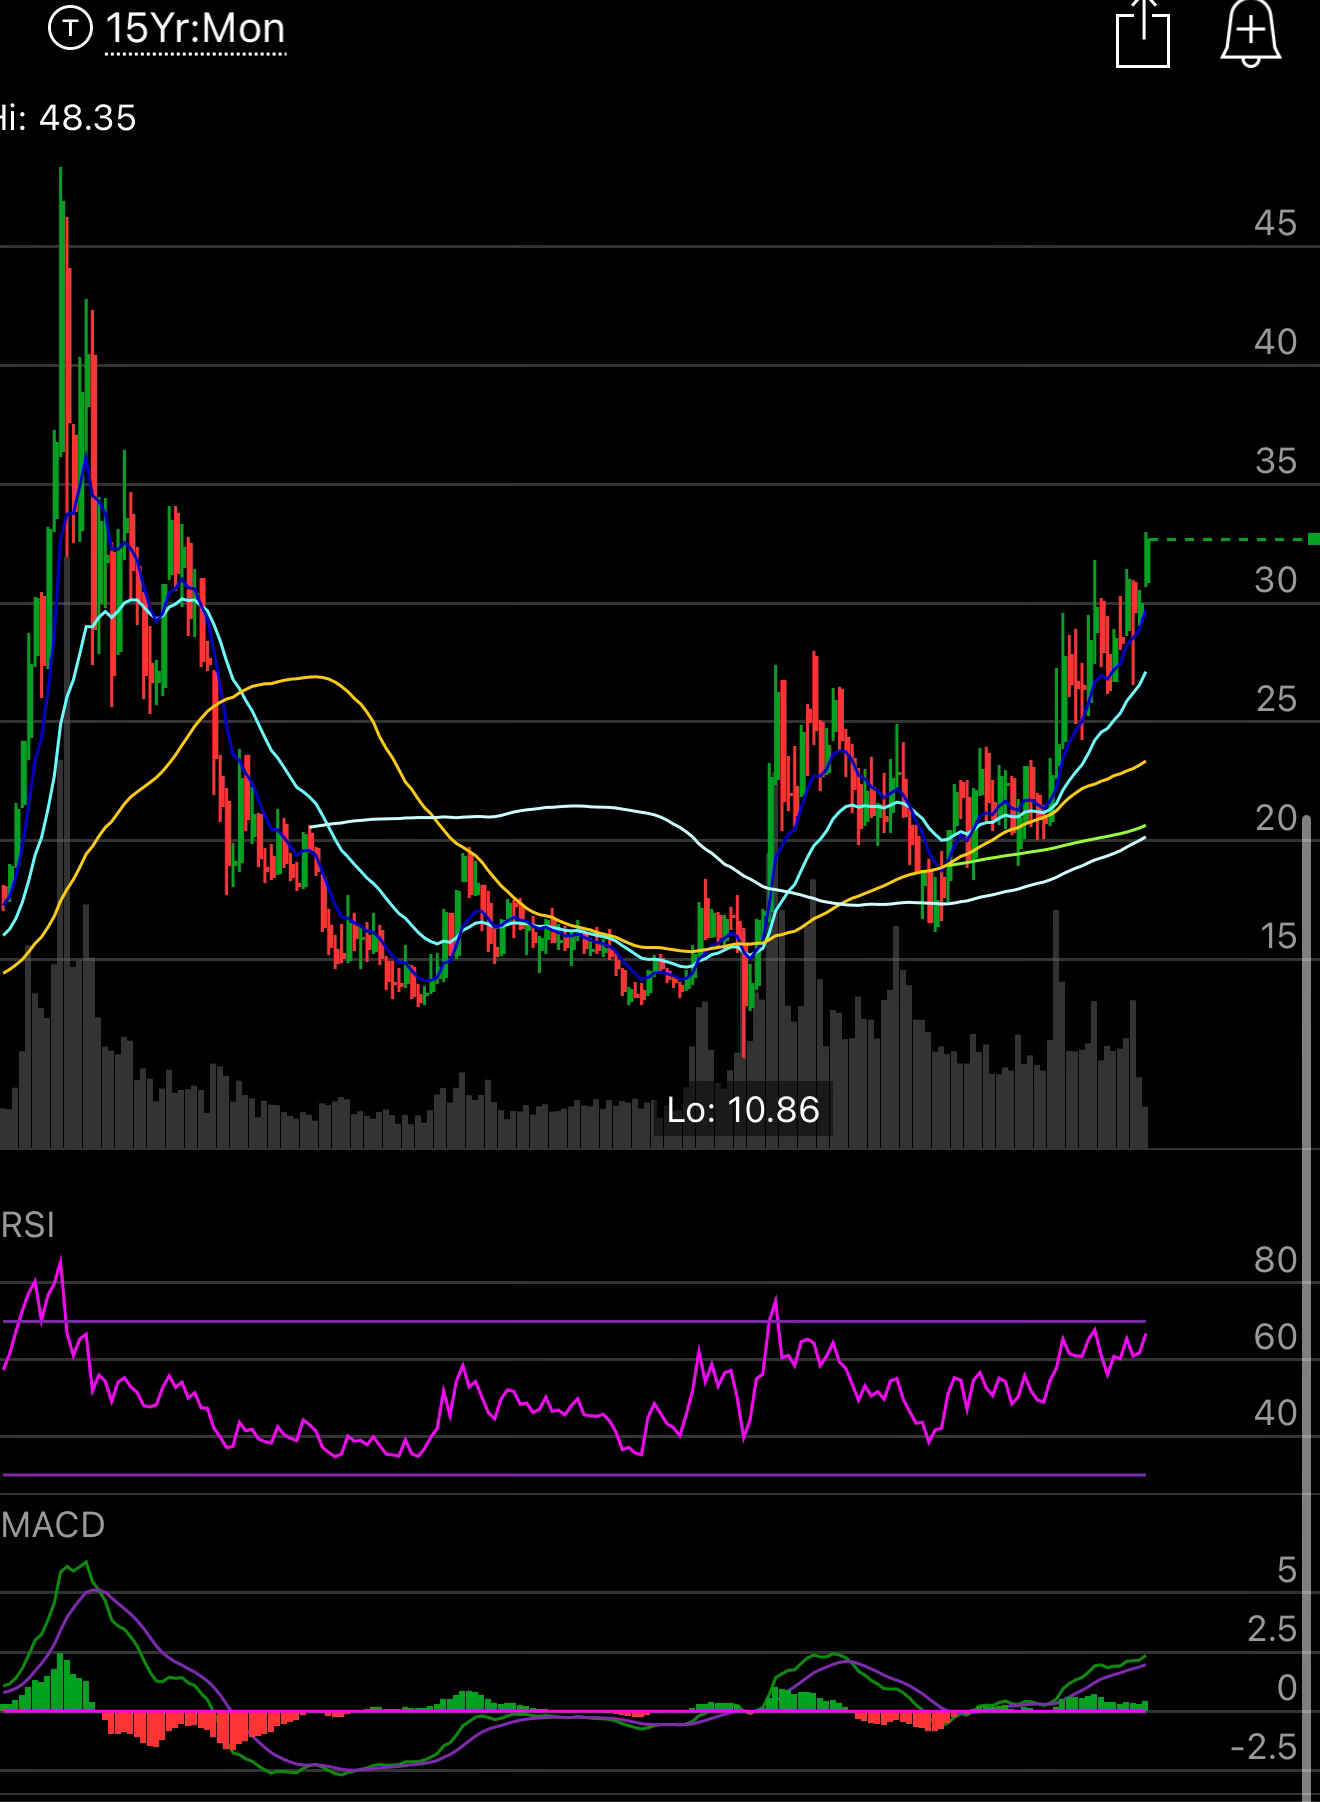
Weekly - This just saw its highest weekly close in over a decade, 13 years almost to be exact. There isn’t anything to say about a chart like this other than breakouts this big don’t usually fade quick. This has major support now down at 30.
Monthly - This is a thing of beauty with nothing in the way of this touching all time highs at 48.35. You have record money printing, record deficits, and this chart just look like it wants to go much higher, remember this is a monthly chart, these candles are very long timeframes.
Trade Ideas
Going long silver commons here is probably wise, although it isn’t the greatest long term holding, right now, I think if you buy it and sell upside covered calls, I think you will do well. You can sell weekly puts to scale in, whatever you want to do but the monthly chart is clearly breaking out and this is a name you want to be in right now.
Let’s look at some other trade ideas using a 6 month time frame, you may want to go even further out, but for the sake of this let us use January giving you 7 months.
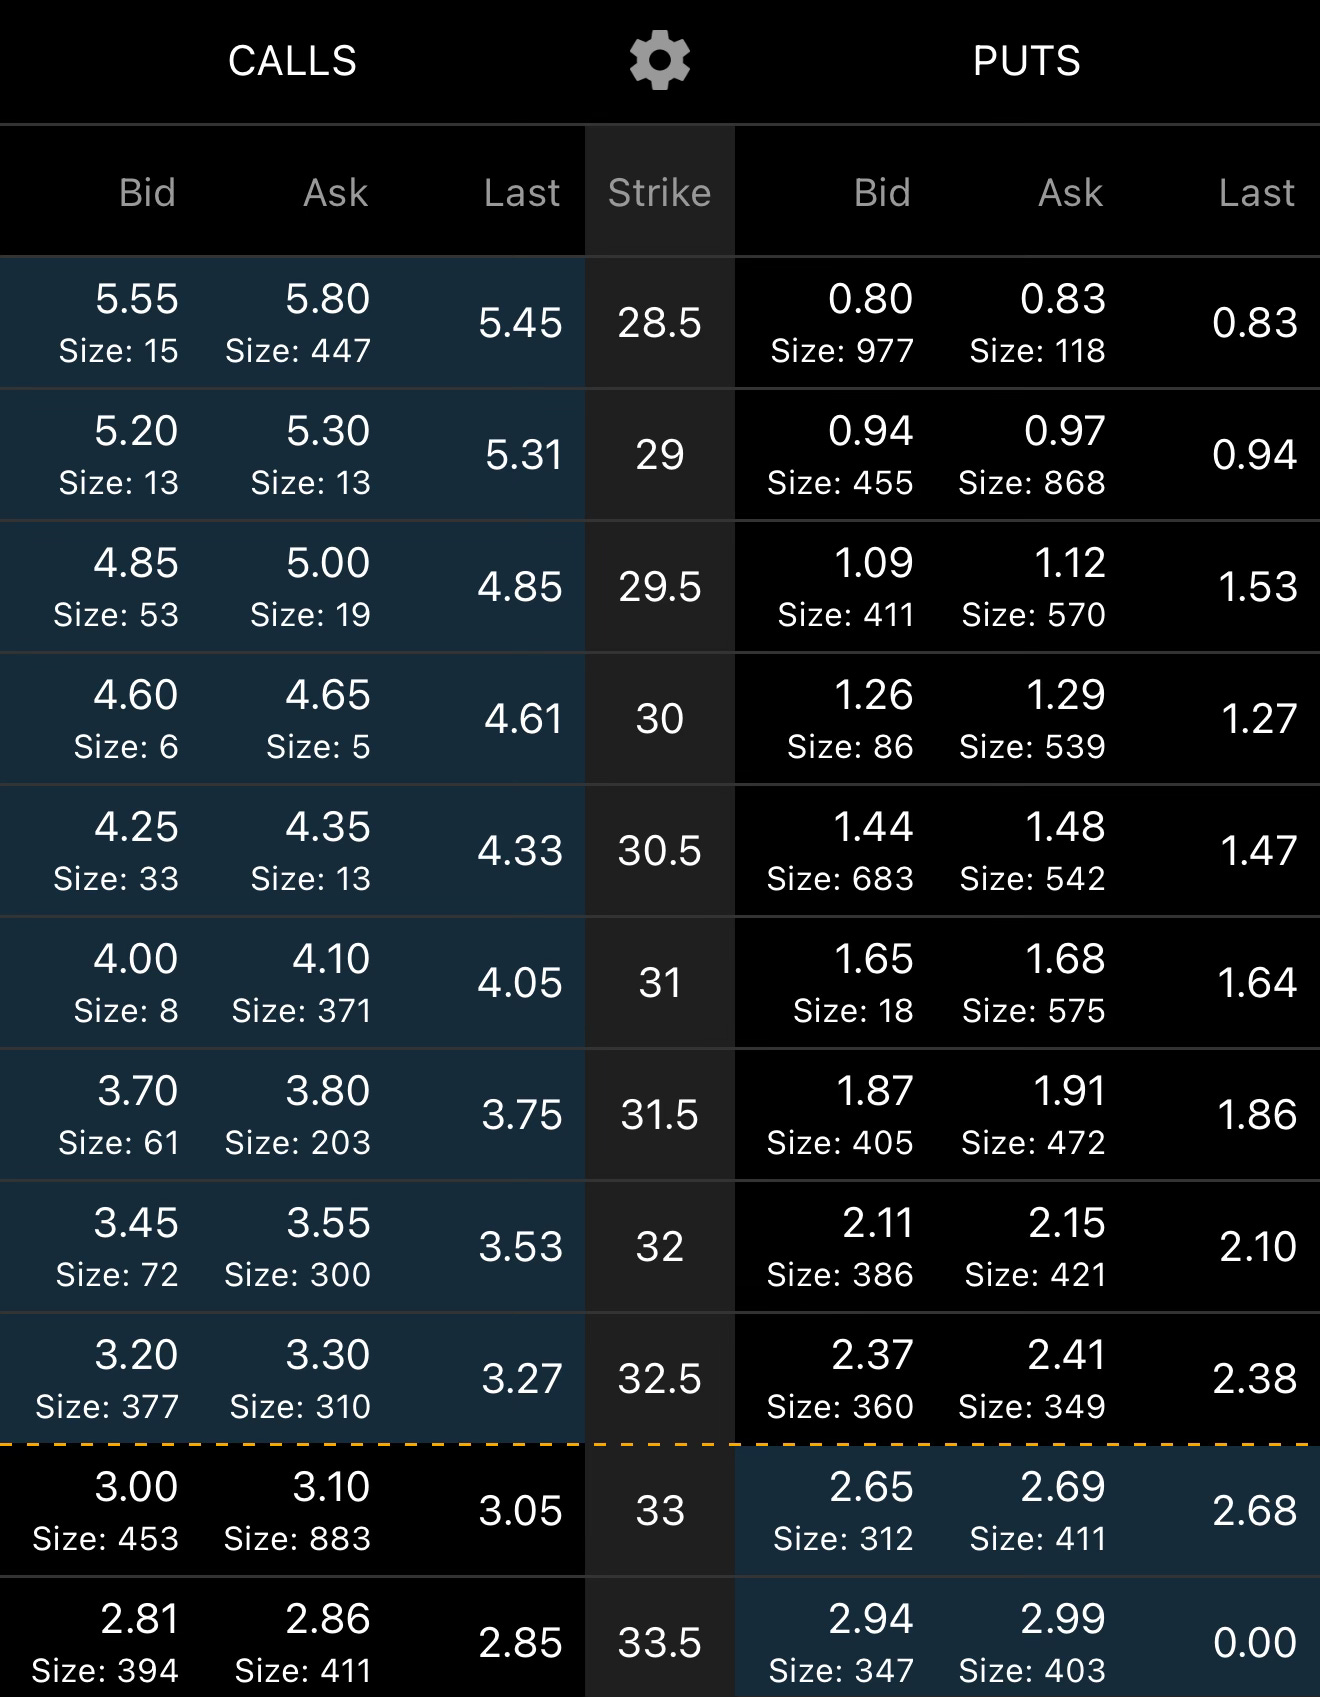
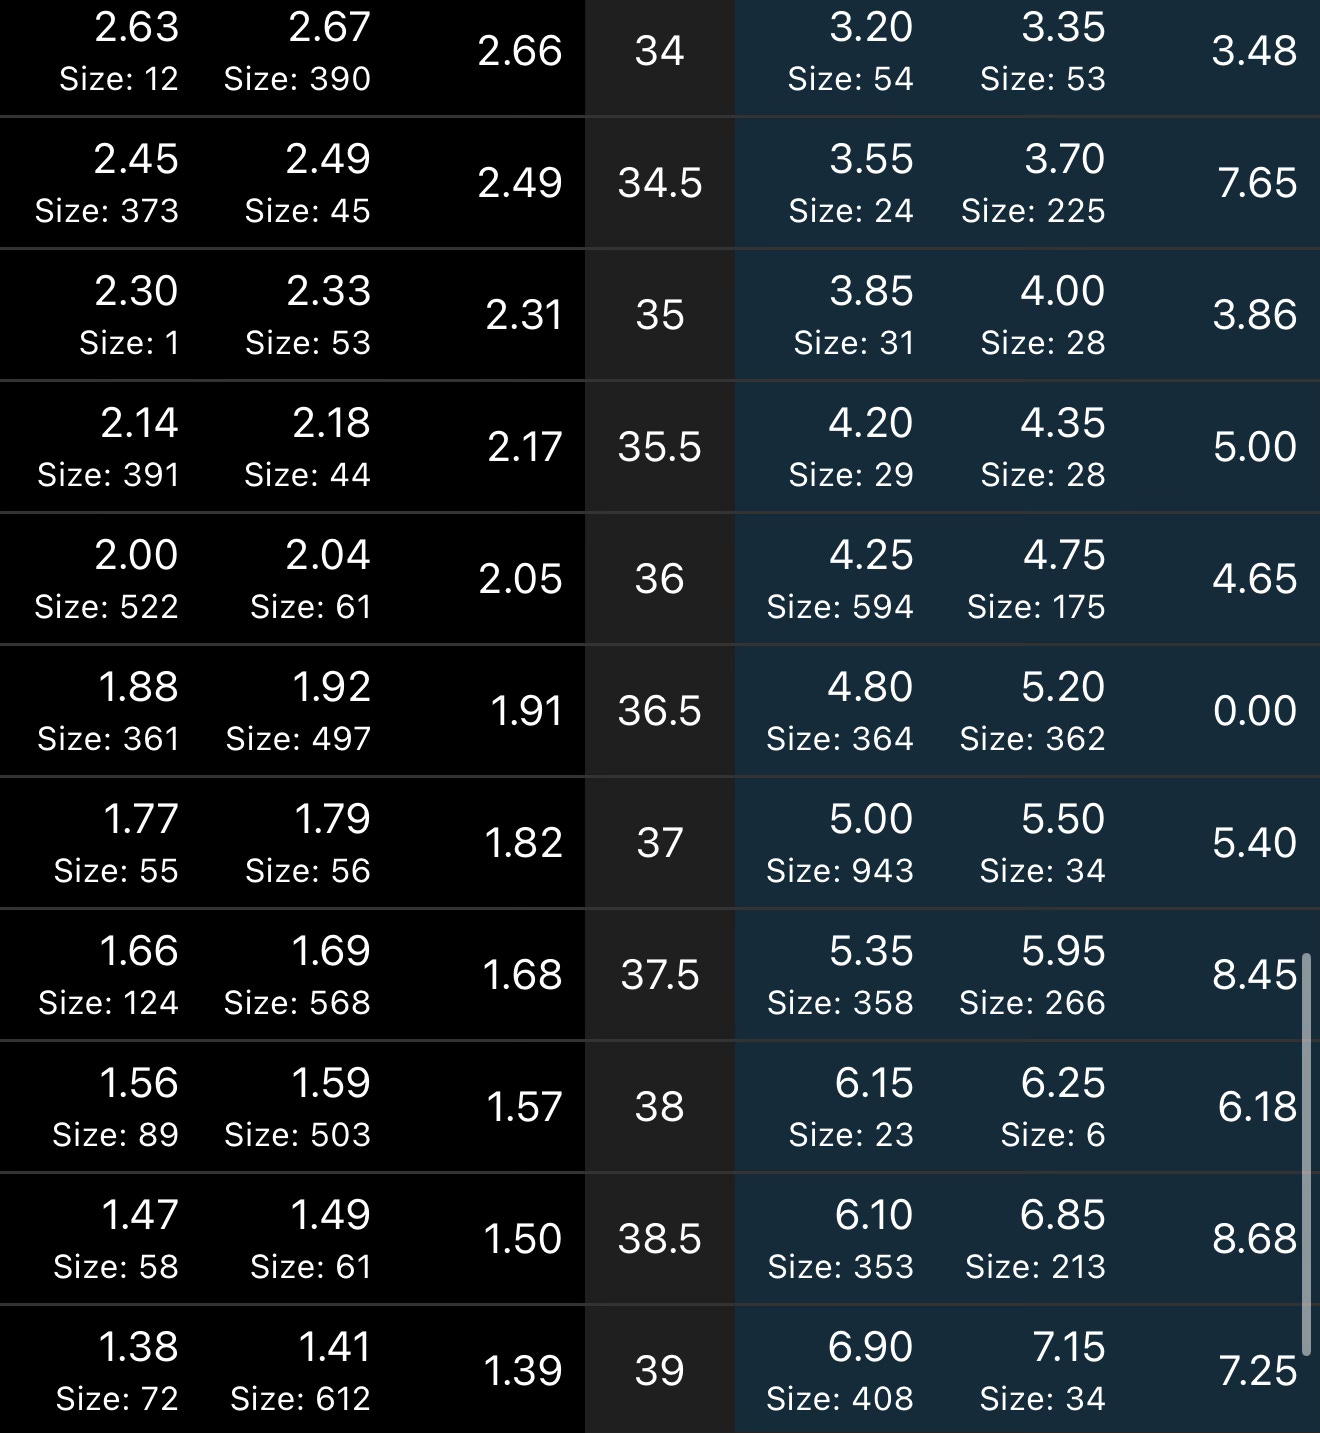
Risk Reversal - A good option for a 1:1 risk reversal would be looking at the 28.5 puts I sold as an idea because of the gap fill there, but there’s other gaps higher, the 30 puts for instance in January are 1.27. If you sell those and buy calls at 39 for 1.40 your outlay is only .13 per contract. Not a horrible debit letting you get long at a gap fill level.
Selling Puts/Put Spreads - You want to go long at a level, what level just depends on how aggressive you want to be. Maybe you want to get long this week and sell puts at 32 aggressively, maybe you sell puts at 30 a month out, or maybe even selling them 3-6 months out. If you want to reduce margin you could sell something like a 30/28.5 put spread in January for 1.27 - .81 leaving you with a .46 credit risking 1.04 for a max loss because the max loss is the total distance between the two. That trade would give you a 44% return based on the risk you took. The put spreads a good option for someone not looking to utilize a ton of margin and having a max risk defined, in this case the most you could lose is $1.04 per spread.
Ratio - I think the best option here is targeting that gap fill I chose myself at 28.5. Those short puts can be sold for .81. Selling 2 of them for 1.62 credit and then buying 1 call at 39 for 1.40. You would then be left with a .22 credit and if the trade doesn’t work, as long as it stays over 28.5 you will profit. Silver is a slow mover, even if it is breaking out, this doesn’t move that violently. Honestly I think you can sell as many puts as you want at 28.5, it is below the 200 day and exactly where you want to go long, you could generate a massive credit just depends how you structure it, could be a 3x1, 5x1, whatever you want.
For instance
10 puts sold at 28.50 - $8.10 in credit
3 calls bought at 39 - $4.20 in debit
Credit of $3.90
Now if Silver flies higher you will profit immensely as the short decline, hopefully to zero in time and the calls rise, if it is flat you will still profit because the trade was placed for a credit, and if it does go down, 28.50 is where you want to be assigned commons anyways. That is a winning trade on all fronts in my opinion and how you want to think of every name you trade.
Have a good rest of your weekend and I will see you Monday.
Thanks JB. Would a similar idea still apply to SILJ?