7/16 Recap
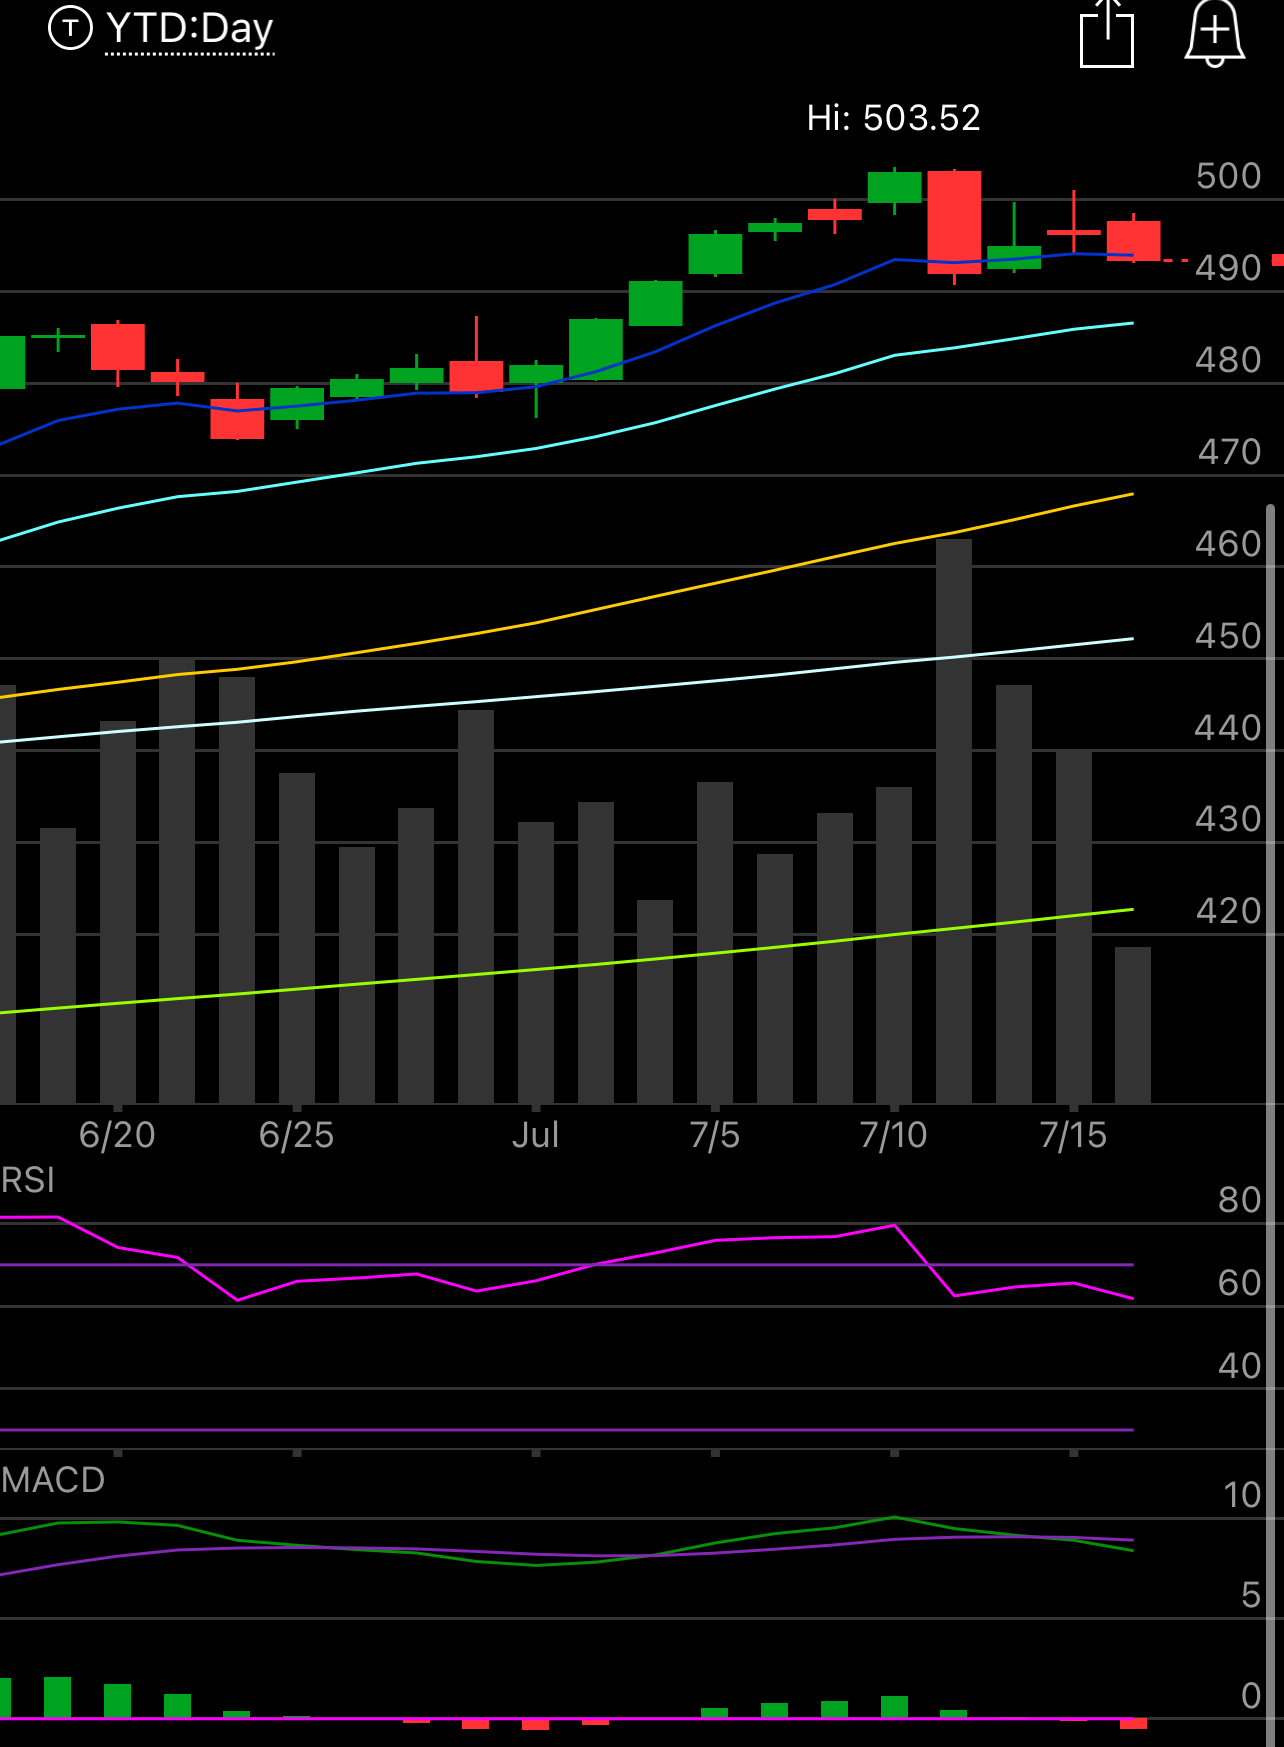
Another day of IWM outperformance, this has been impressive. The thing with the market is there is always a bull market somewhere, my focus in here is always trying to find that sector that will outperform and I think I did a good job here pointing to the IWM rotation coming a week ago. The IWM is up 10% in that week since. It has particularly outperformed the SPY and the QQQ dramatically in that timeframe. Again, it doesn’t mean tech is bad or tech is done, it just means that for a little timeframe, small caps would likely outperform and they did. The QQQ is red today and the IWM is up 2.36% right now. Is the trade overdone? Probably, look at all the gaps on the chart below, but that’s what happens with unloved tickers is that they are heavily underweighted, key weight underweight, not shorted. Fintwit loves to use the word “short” because they’re ignorant, almost nobody is short anything real. Even Tesla it is the most heavily shorted name in dollar terms but as a percentage, it isn’t that big a short and look at the recent sharp move up on there as an example. Unless something is a true pile of junk, most real stocks aren’t shorted heavily, people are underweight and rotate quickly to them.
The QQQ does not look good right now, it is losing the 8 ema and in a classic bear flag. That isn’t the end of the world but they’re simply buying other things than big tech for the time being. They will circle back here because they always do. I suspect after a couple monster earnings prints in a few weeks. There is nothing to panic over, the market wasn’t going to be lead by big tech every week the last 18 months have been crazy, a few weeks of IWM leading is perfectly normal.
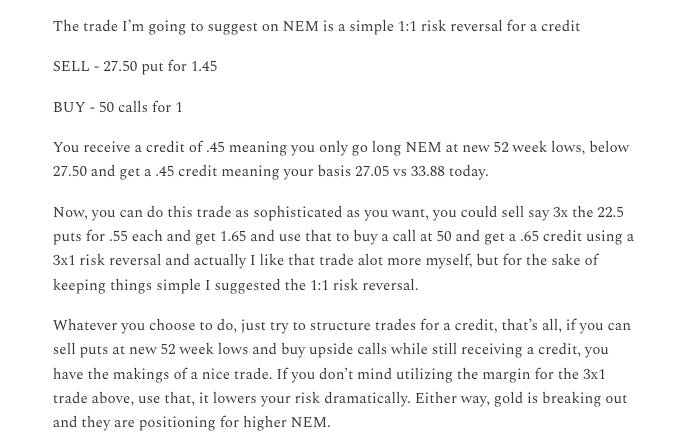
I know there’s constantly a new influx of people here and I don’t know how to really explain how to trade all this data in 1 set way to newer traders, but I would say you just have to let the flow unfold like the IWM above. People who trade short term calls and puts are gambling, I’m not a junkie, I let bigger money make their bets, I form a thesis based on option flow and I design trades around it. Take this NEM trade I wrote up as a weekend best idea back in March here
At the time NEM was around $34 and the flows into it were hot. Gold miners don’t really move quickly, seeing OTM calls repeatedly was a very odd thing to me. So I designed this trade below where even if I was wrong, I still would have gotten paid to take shares of NEM 20% lower. Today 4 months later to the day, those calls are up almost 5x with NEM near $50 a near 50% move The short puts have collapsed to only .12 for a huge profit and the trade went perfectly. Simply put, if you see repeated action, you have to be patient with it. Maybe you sit in shares, maybe you buy calls, maybe you average down, but don’t be scared of what you’re seeing. More often than not you will be right, but they key lifehack I try to hammer home is structuring your trade to where you get a credit every time. That way in the event you’re wrong, you can still profit.
Recent Trades
Yesterday we had 2 that went well overnight RSI and SRCE. RSI is up over $10 now and was $9.20 when I logged those calls yesterday in the live chat, so a quick 10% move. SRCE is a small cap bank that is moving like a tech stock up 3.5% right now to over 61. Crazy overnight moves aligning with the flow highlighted. I try my best to feature what I think are the oddest ones, but if you see some obscure tickers I missed, those are such incredible pockets of alpha overall.
Trends
1 Week
2 Week
1 Month
Today’s Unusual Options Activity
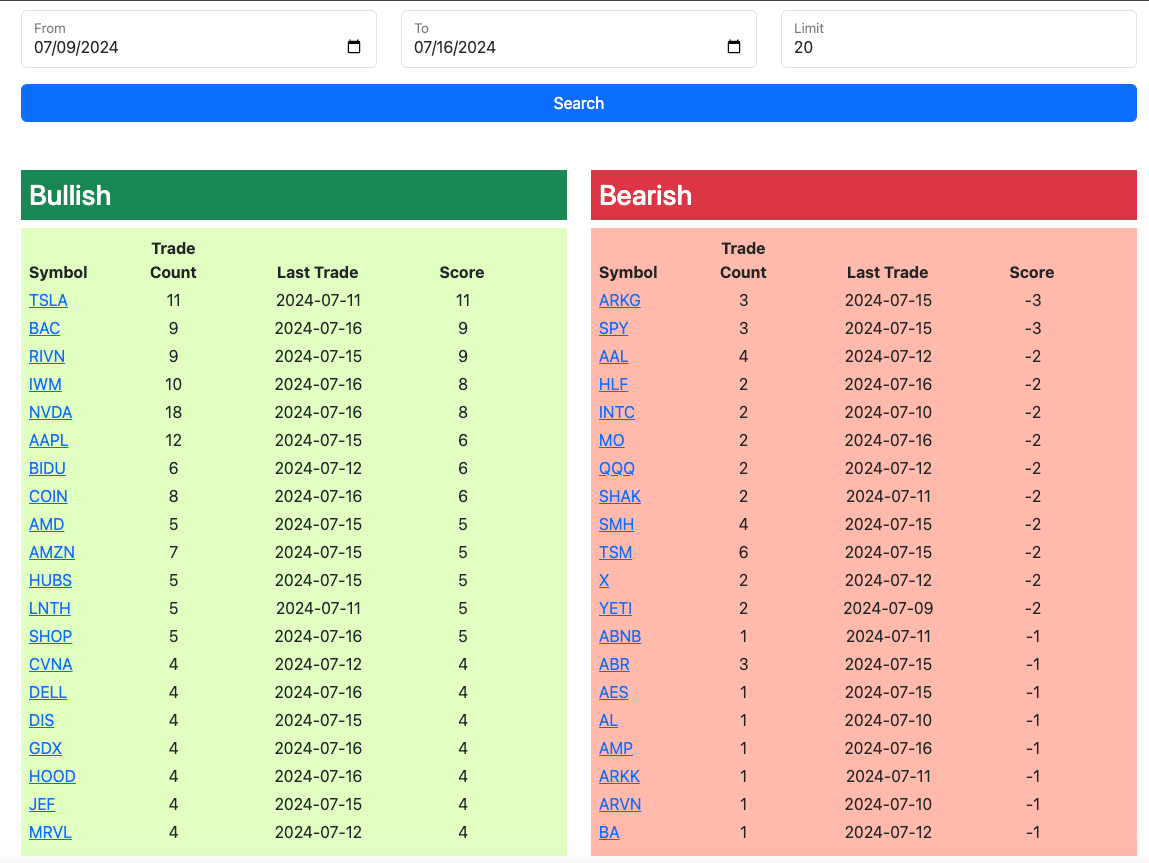
Here is today’s link to the database, as always it expires tomorrow morning at the open and I will update the rest of the day’s action by tonight. There were too many calls bought today so you’ll have to check the link below to see them all.


