
7/18 Recap

How about that trade of the week idea PINS up 5% today? I have alot to say about that below but lets start with the big news, AI saves the day again! Midday we got a headline out of Microsoft which lifted the Nasdaq from deep red to green. These AI pump headlines are getting to be comical, even this news today is for a $30/user per month AI product from Microsoft. I find it hard to believe companies are going to be tripping over themselves to pay for this en masse. We will see, but all these AI products are just not anything material and companies are pricing in all this future potential revenue today. Microsoft gained about $120b in market cap in minutes, that is insane. Then again, the flows were all pointing up there for awhile, here’s what I have noted since June on it. It’s at $364 right now and those 5000 365 calls bought 8 days ago for August expiry were right on the money. As usual the positioning was in the option flows before the move.

Let’s talk about SCHW and the move it had today up 13%. The whole point of this substack is to organize and display option flows within names and if I go back to the beginning of the year and pull up trends from then Schwab is 7th in total bullish flow

Most of that obviously came in March after the banking crisis we had but if you go back to Saturday’s earnings preview I sent out and look at all the bullish flow that was within SCHW you would see today’s move was not that shocking that is just how funds were positioned into today. The flows were mostly bullish, look at that huge risk reversal on 6-21 selling 14,000 in the money puts at 60 to buy 14,000 calls at 60. How much did that payout today? Look at all those call buys and put sales in general, the flows were pointing in this direction for a long time and it culminated in today’s move up. The point is, what I’m looking for within this data is how much is going to 1 side. I’m not looking at 1 specific trade, I’m not looking at a few trades, I’m trying to look at all the data I have, and within it see the levels of interest to try and help gain an edge in how I position myself.

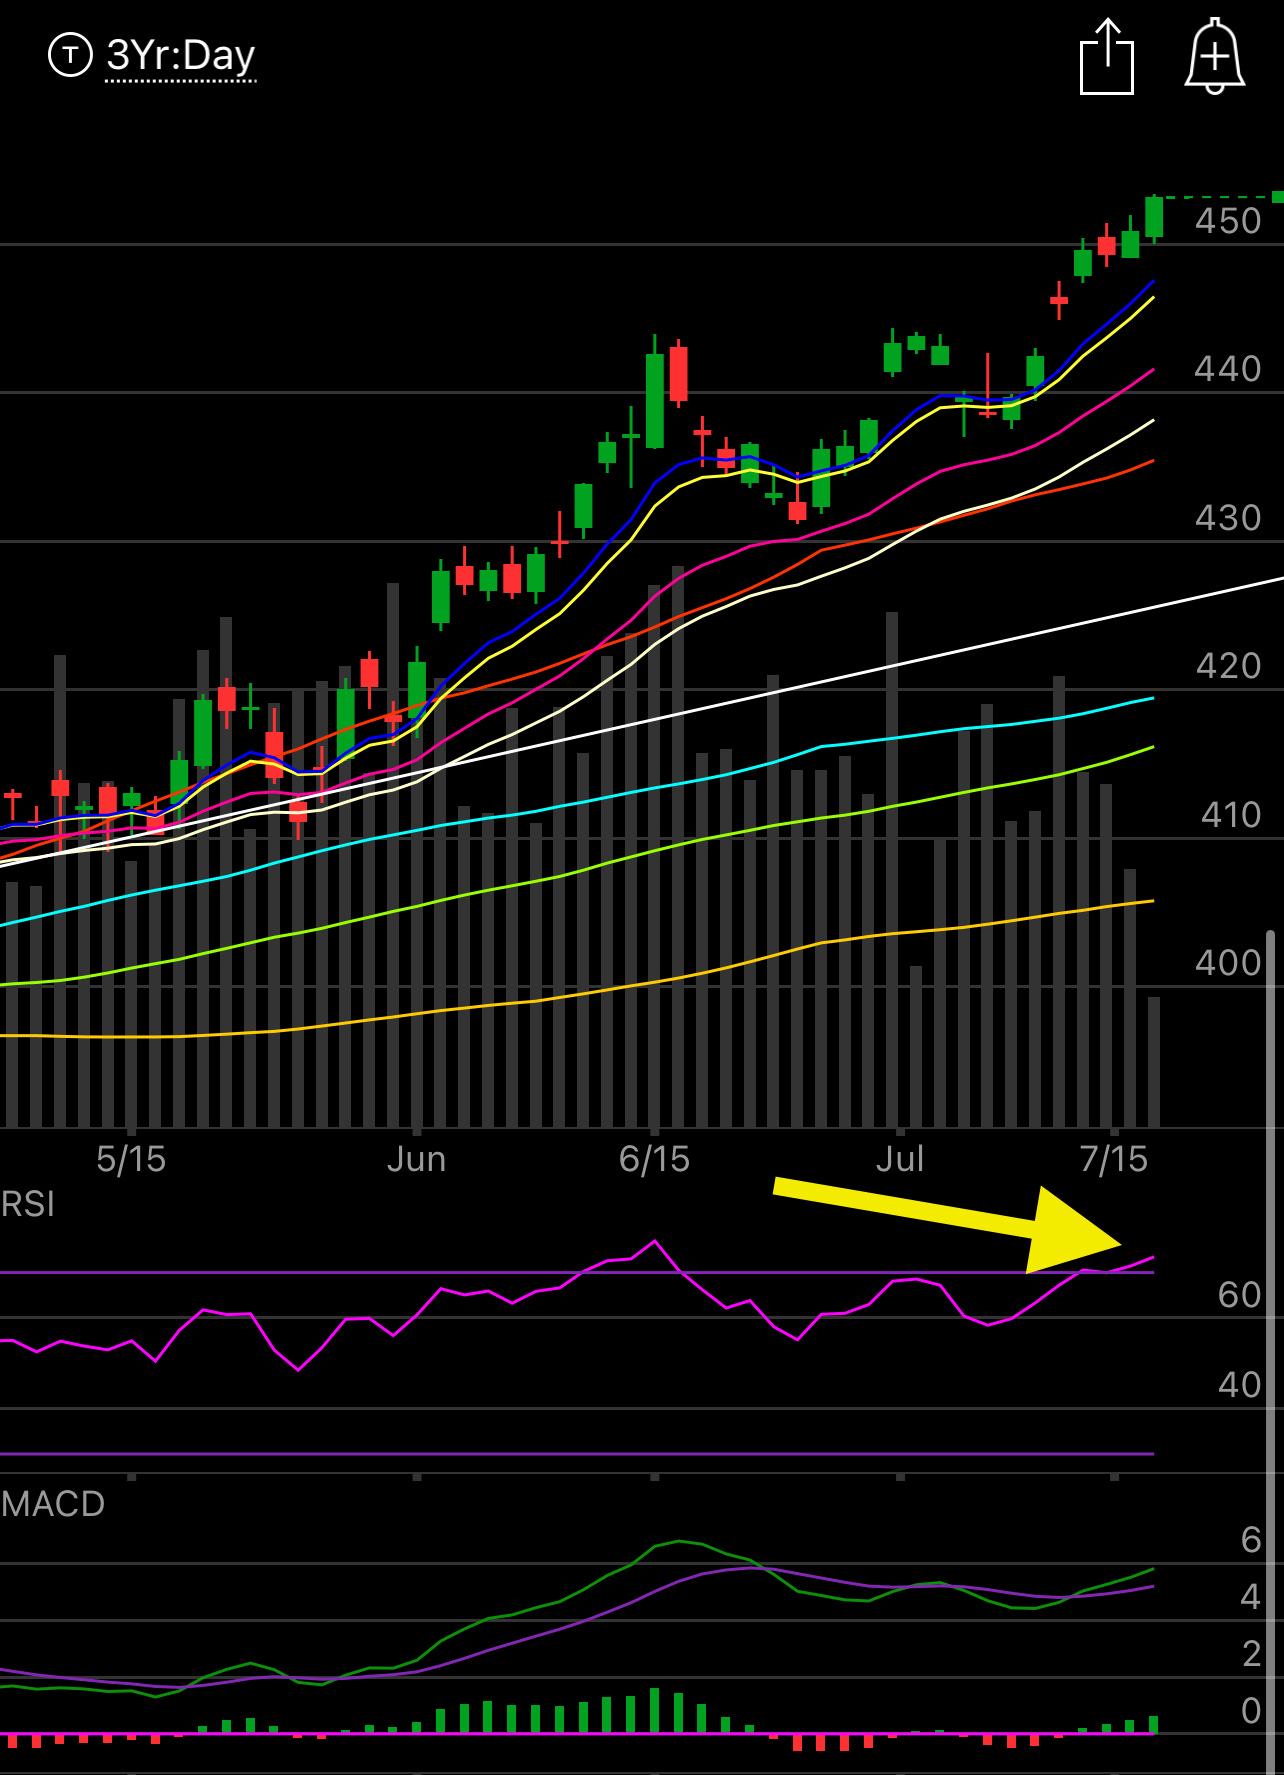
The SPY pushes up again naturally as one of its largest components is up almost 5% now but it remains very overbought now as you can see where the arrow I put is pointing. How long will we stay overbought before we cool off? I don’t know but I know nothing stays overbought for long. So we will see what comes the next few sessions. That gap below from 5 days back is a natural spot to look to if/when this pulls back.
Trends
GRPN,SNAP, and T are 3 of the top 4. Yikes not the high quality names that usually lead the way. Other smaller names like BALL and NICE showed up here. NICE had that risk reversal I noted yesterday and is up 3.5% today that was a great trade overnight. COIN had those really odd 112 calls bought yesterday and it rocketed up to 109.xx today and then crashed to 103.xx. The calls worked and they probably cashed them in, but these names move like penny stocks. NTRS reports tomorrow morning and had some nice put buying, but with earnings you never know if those are hedges. Nothing is really standing out to me in these trends right now.
Week To Date

2 Week

1 Month

Today’s Unusual Options Flow & What Stood Out
107 Trades Today.
Sorry for the small font again, it only happens when there are too many calls and I can’t fit it all into one image. Just a sight of the market we’re in, too many calls is a thing.
