7/28 Recap
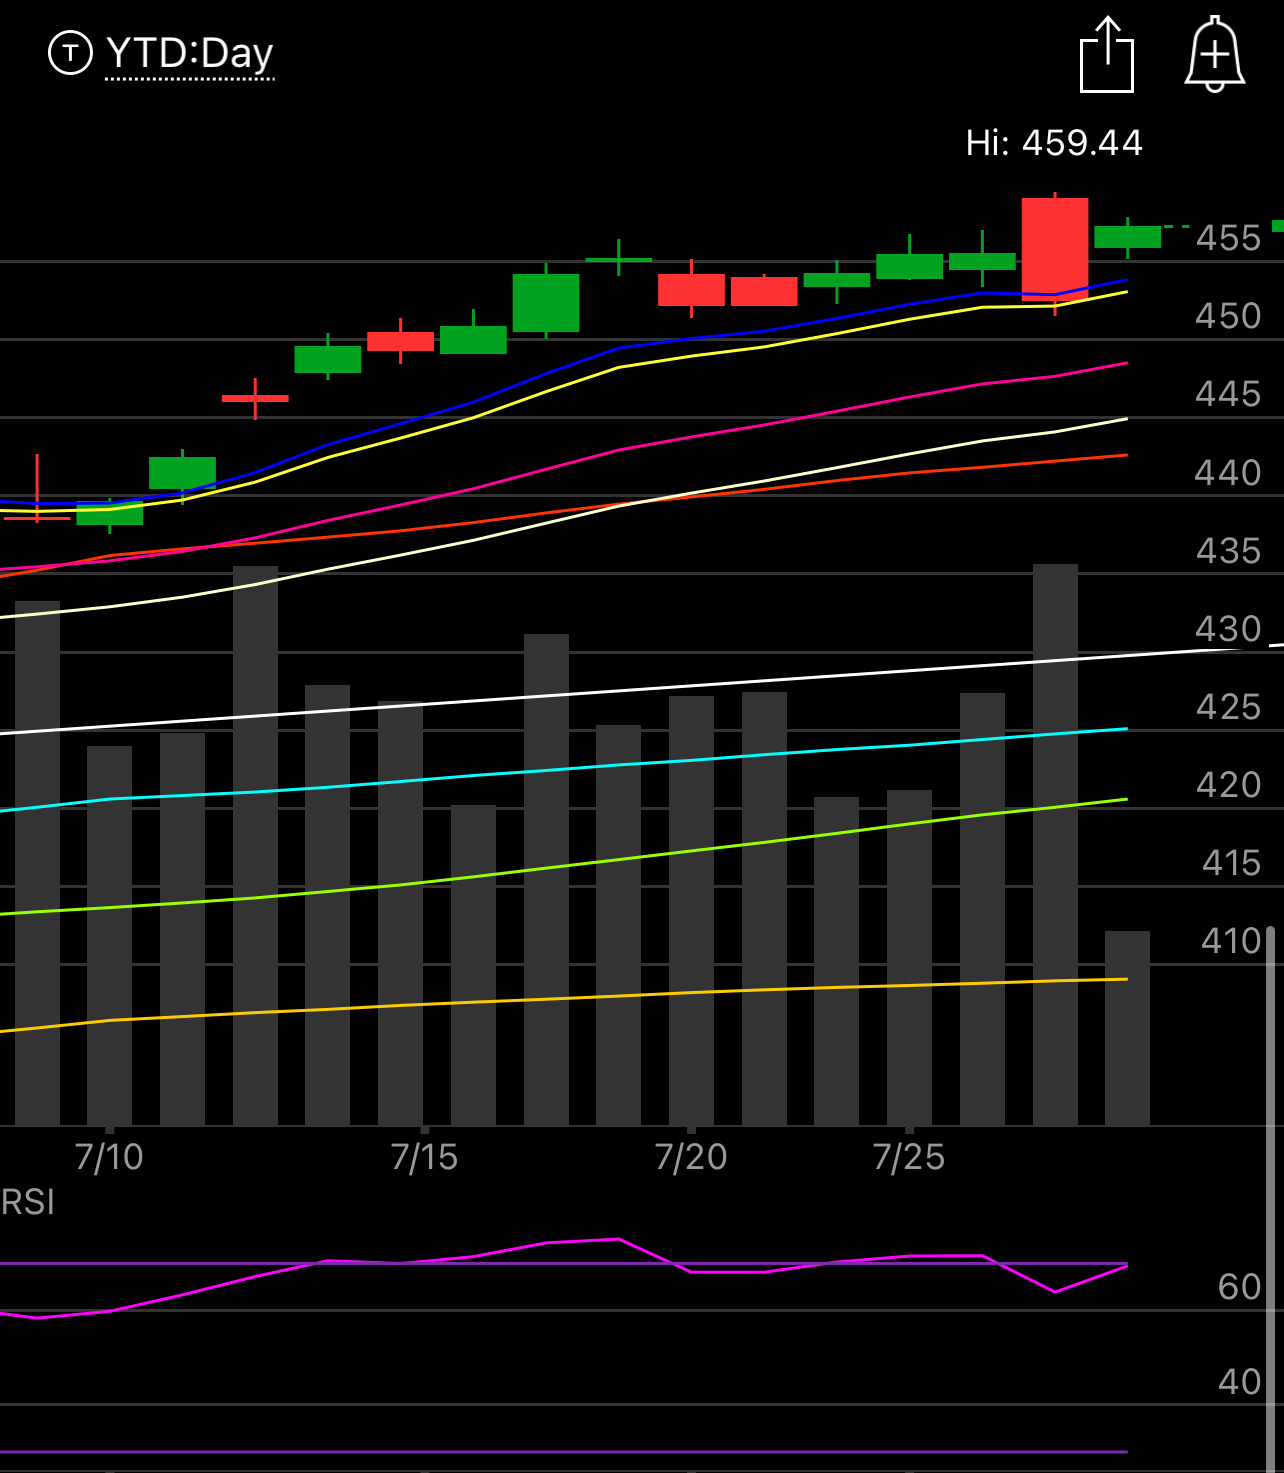
Believe it or not we closed below the 8 ema yesterday with that massive late day flush. That was our first close in a very long time. In normal times, that would signal a trend shift possibly beginning, but as we’ve all learned in 2023, nearly every time a chart looks bearish, we’re met with a gap up the next day. I’m sure many of you remember the multiple trend breaks back in Q2 where I got short on a breakdown only to be met with some huge gap up. I still can’t believe I returned so much last quarter with all those losses from trying to short a trend break added in.
If you ever read a “How To Trade For Dummies” type book, the opening chapter on how to approaching going short stocks would say something to the extent of “ a bearish engulfing candle closing below the 8 ema is a dream setup” and that is what we got yesterday as you can see below but the /NQ is up 300 points today as yesterday’s worries are now history.
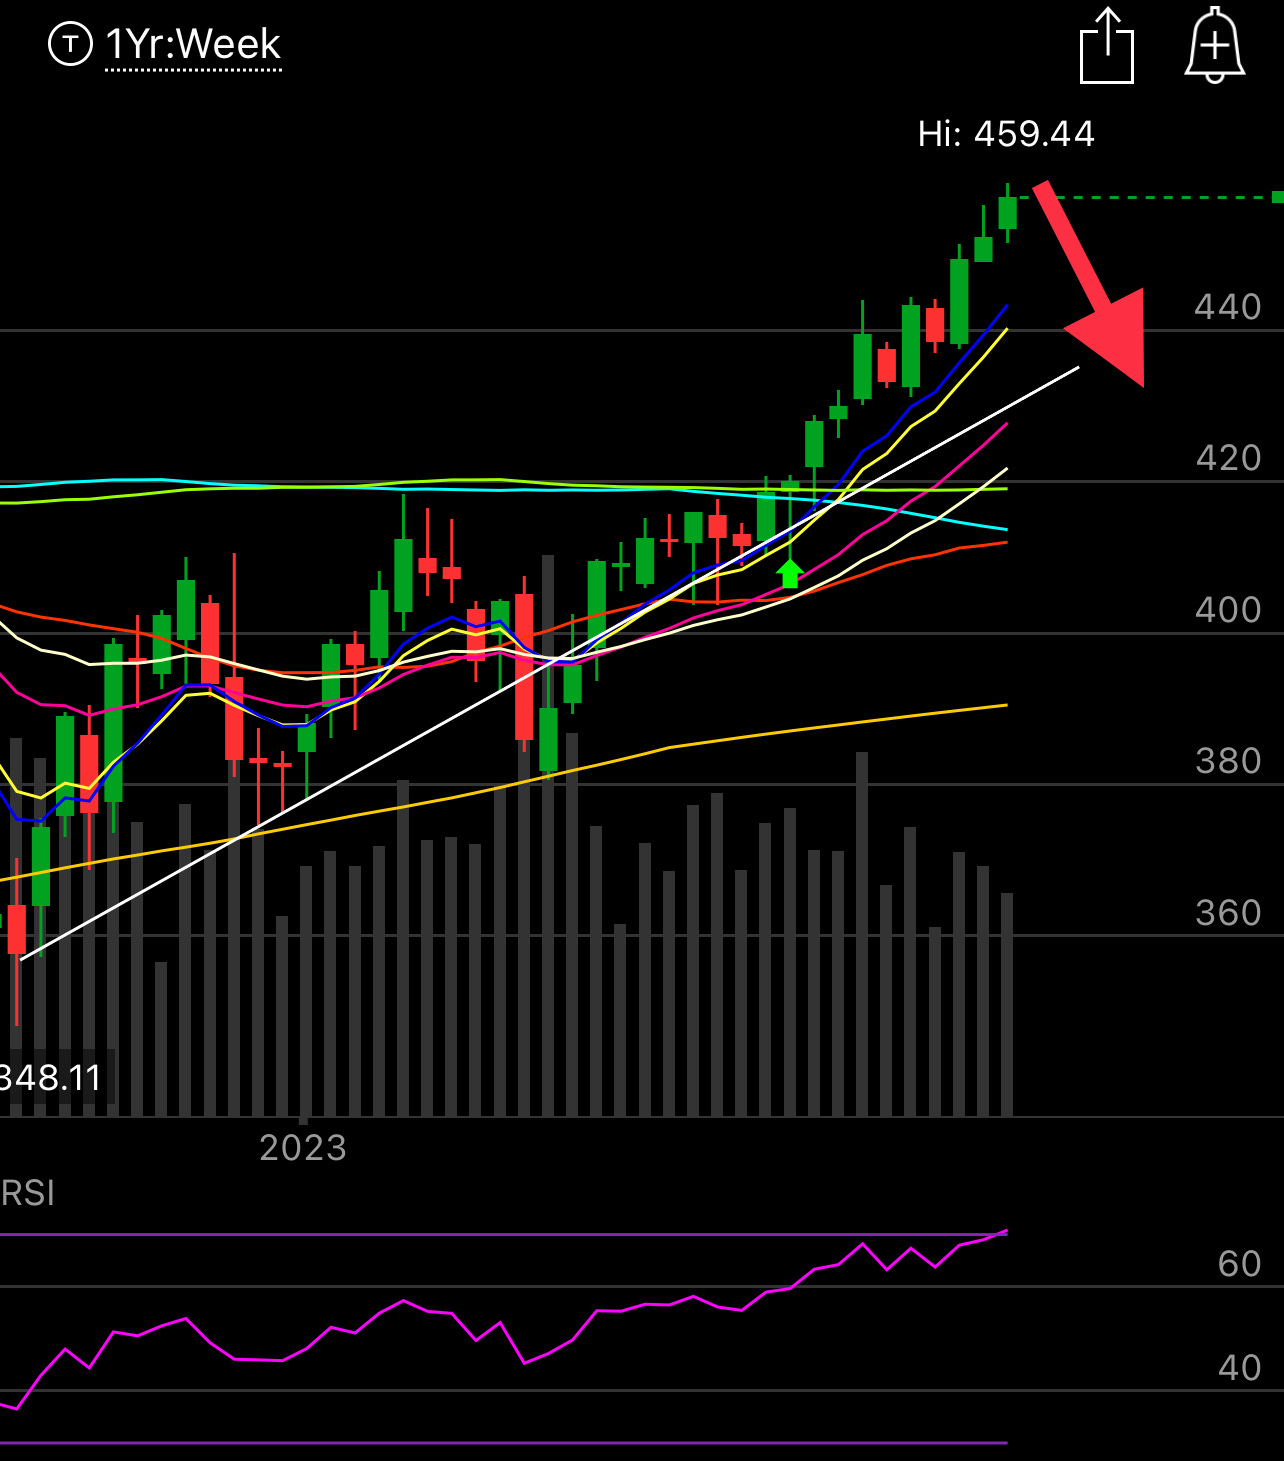
The weekly candle is back to closing near highs. What I want you to see is that red arrow pointing at the trendline from the current trend that is now nearing 11 months. Even if we did pullback say 4% to that trendline, the uptrend would still be intact so until that breaks you really have nothing to worry about. Trying to short here is futile even thought we’re overbought and you’ll only pick up a few extra dollars if you’re right, your best bet if you’re bearish is to just wait for the trend to break and then press it. Right now, as nuts as this move has been, it is just a continued move up within a larger trend.
If there is something to be concerned with it is the breakout on TNX. Treasuries breaking out while stocks do is quite the rare phenomenon. So something has to give soon but TNX did break out a month back and gave it back right after.
Trends
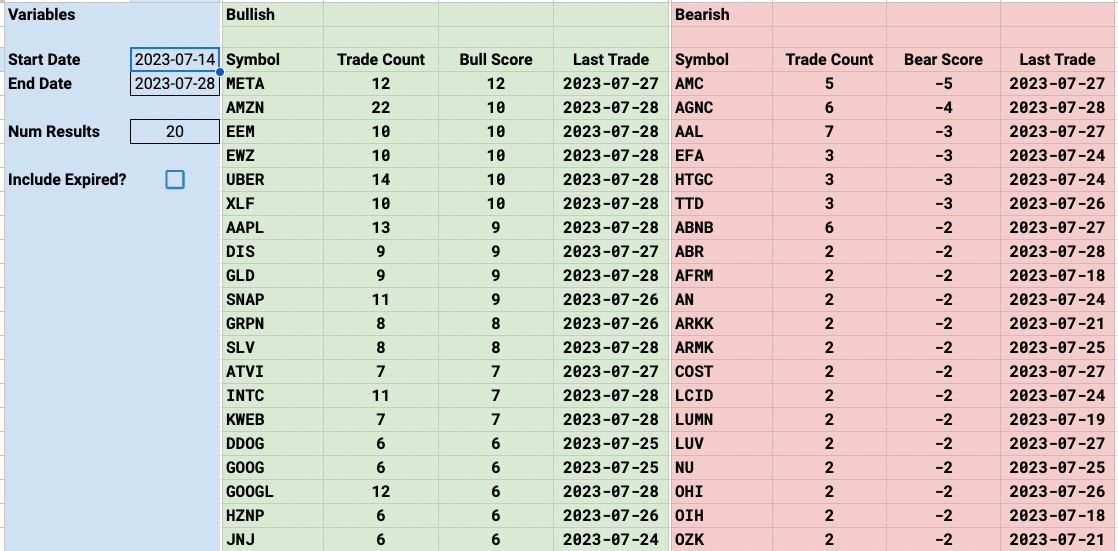
Short term it looks like alot of bullish positioning in INTC,BMY,CCL, and DDOG among individual names. GLD is the ETF with the most unusual flow followed by the EEM,EWZ, and KWEB. The EEM is up almost 4% this week but that’s been one that has been showing up in these trends for weeks so you shouldn’t be surprised. SHEL is another name that is showing up alot in the past few sessions. I added in the 3 month trends today, you can see the majority of the names there have been the names that have really run hard the last few months. This trend system is very powerful in capturing names based on their positioning if you pay attention.
Week To Date
2 Week
1 Month
3 Month
Today’s Unusual Options Flow
The one that stood out today was no doubt INTC, there were 30 open trades in my database on it and 26 were bullish with only 4 bearish, today it rallied 6% after earnings. Here were all the trades leading into the print, you can see all of the ones before this week posted in the earnings preview last Friday. This was one of the most bullish positioned names into the print and like we saw with SCHW the week before, the smart money won again.
109 Trades Today


