8/29/25 Recap
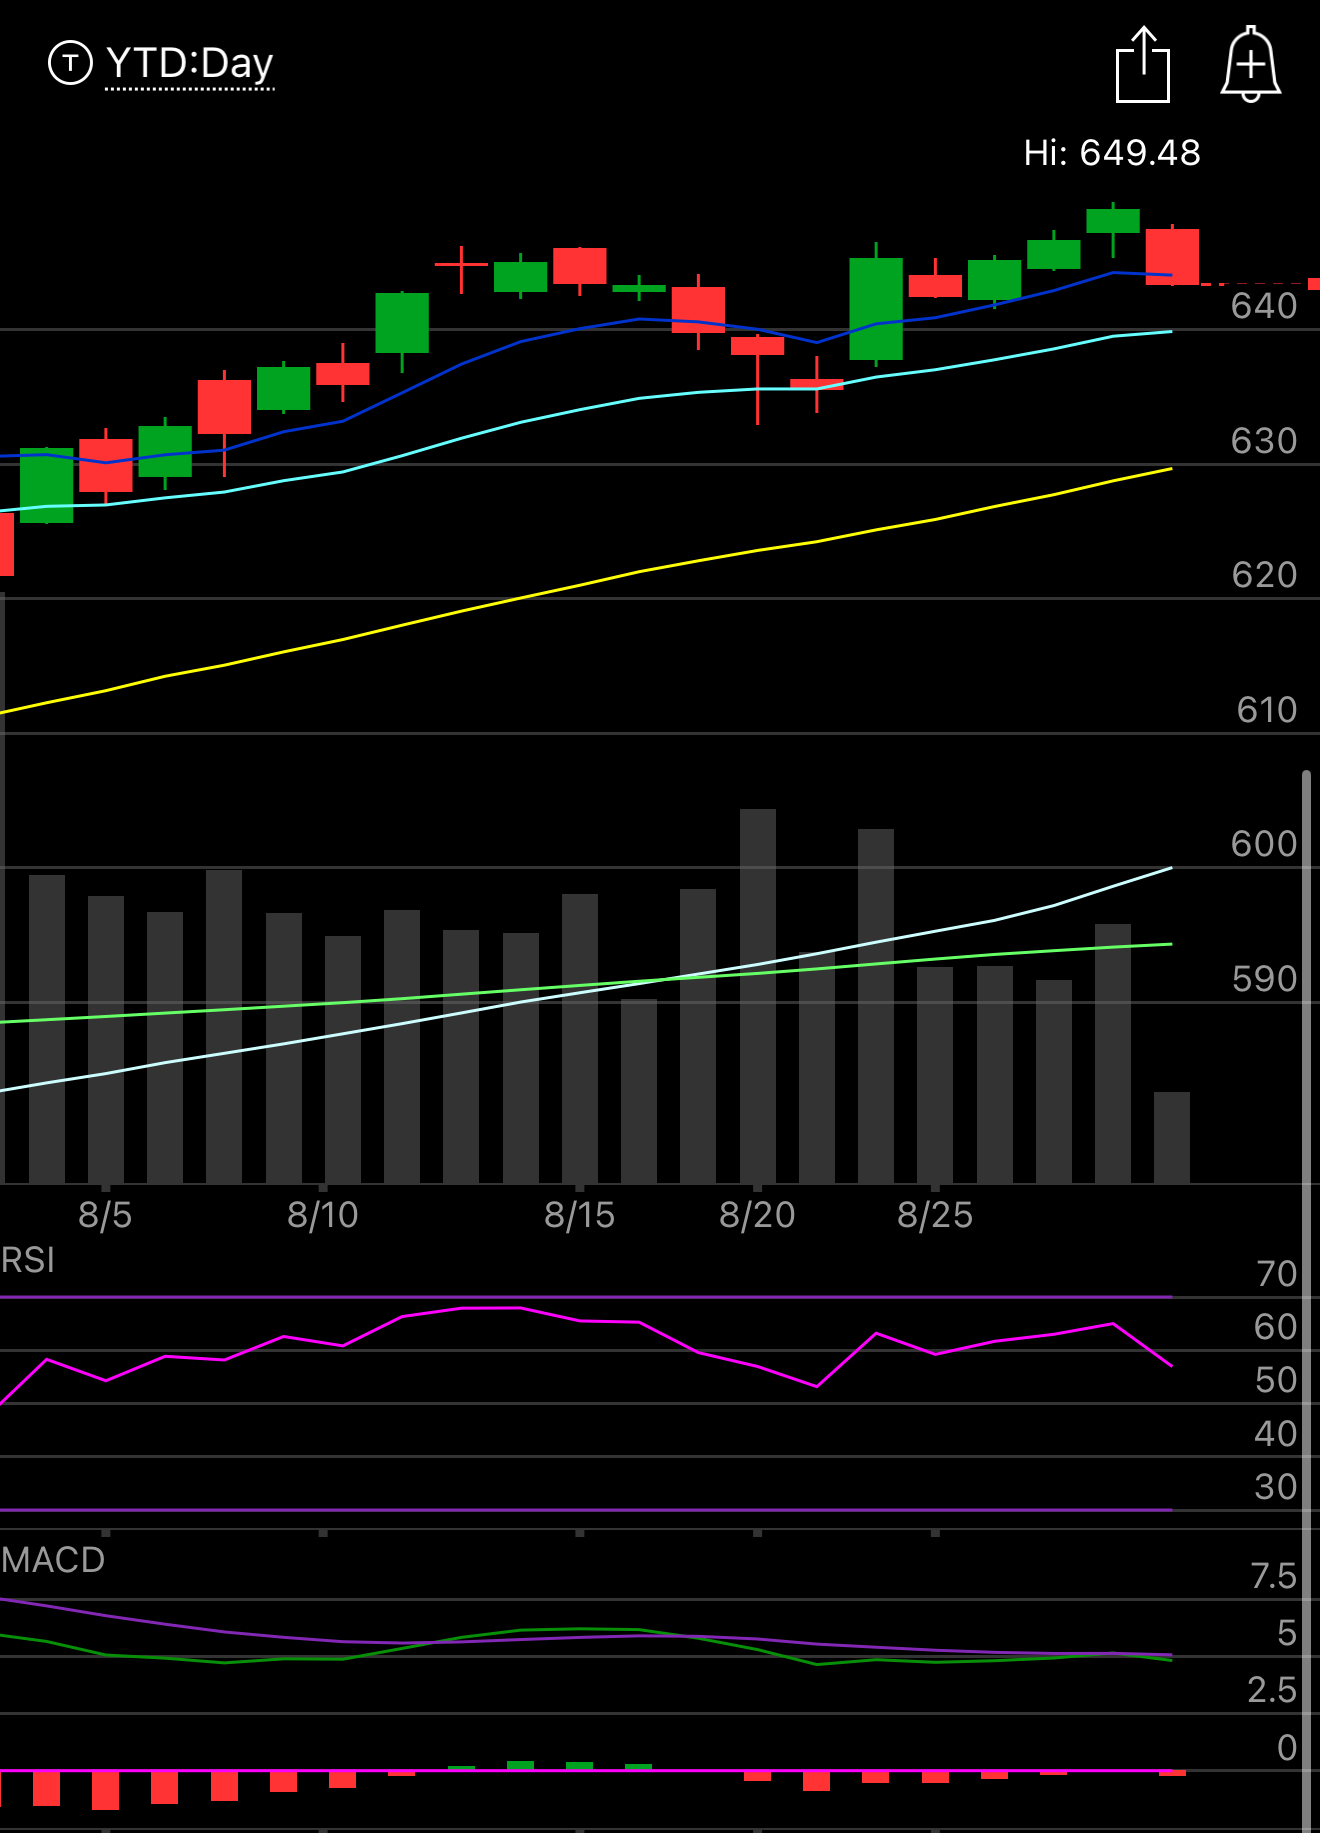
The SPY is losing the 8 ema early in this session, is it end of the month games or is it something bigger, I don’t know. I mentioned yesterday I just wasn’t feeling good about the market and you probably should close up short term trades. What I know is you’re getting your first warning sign that you need to take a little risk off today. The 21 ema isn’t far behind about another .5% lower, if we lose that, you need close alot up. I have a few charts to go over with you below and why you need to be exercising alot of caution right now. When markets look weak, it doesn’t have to mean a big selloff. It just means maybe we don’t go straight up everyday. Maybe we chop for a bit. The most painful move for most traders would be a period of nothing, bears and bulls would get hurt as only premium sellers would win in that environment.
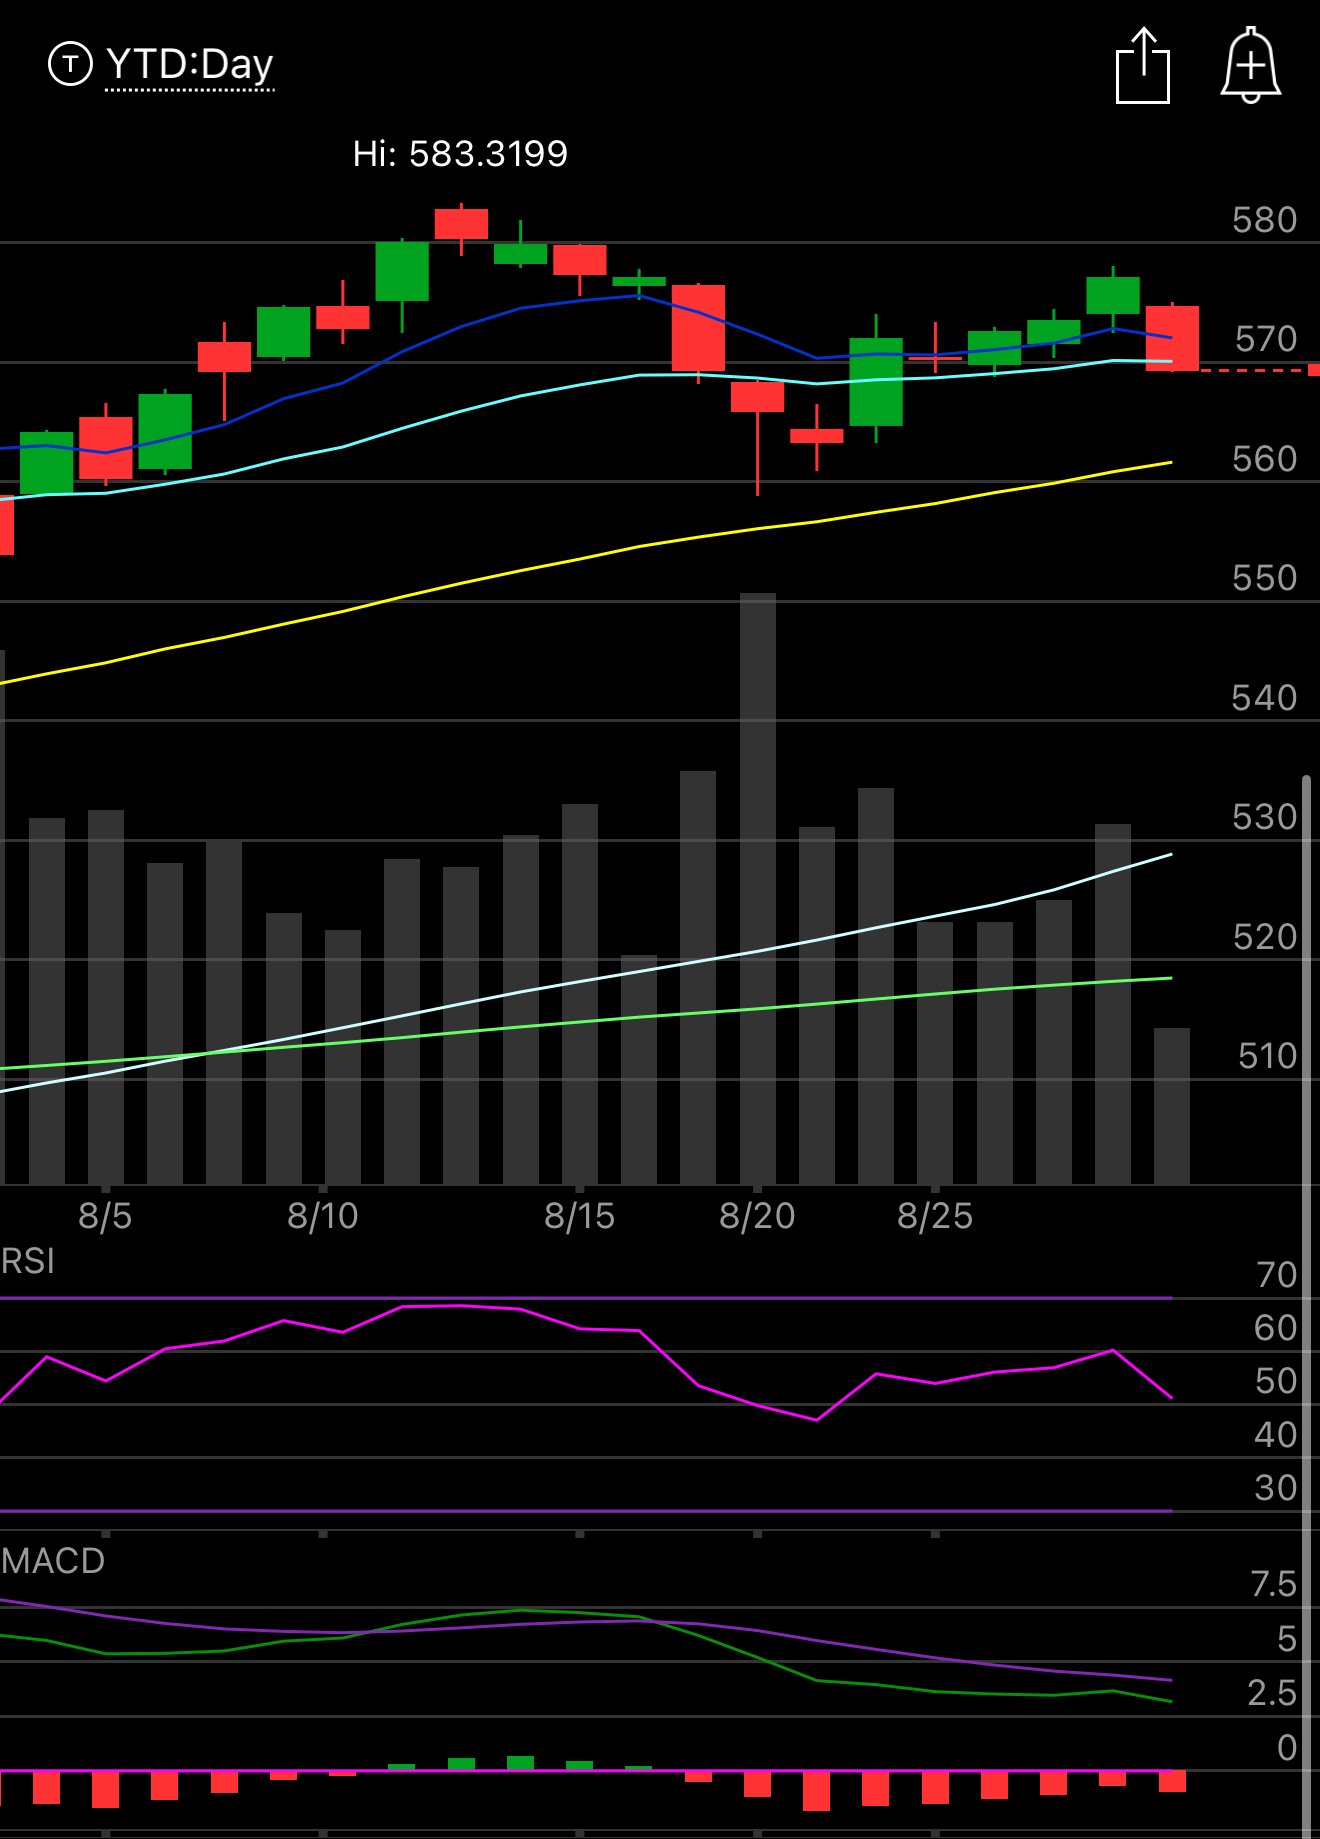
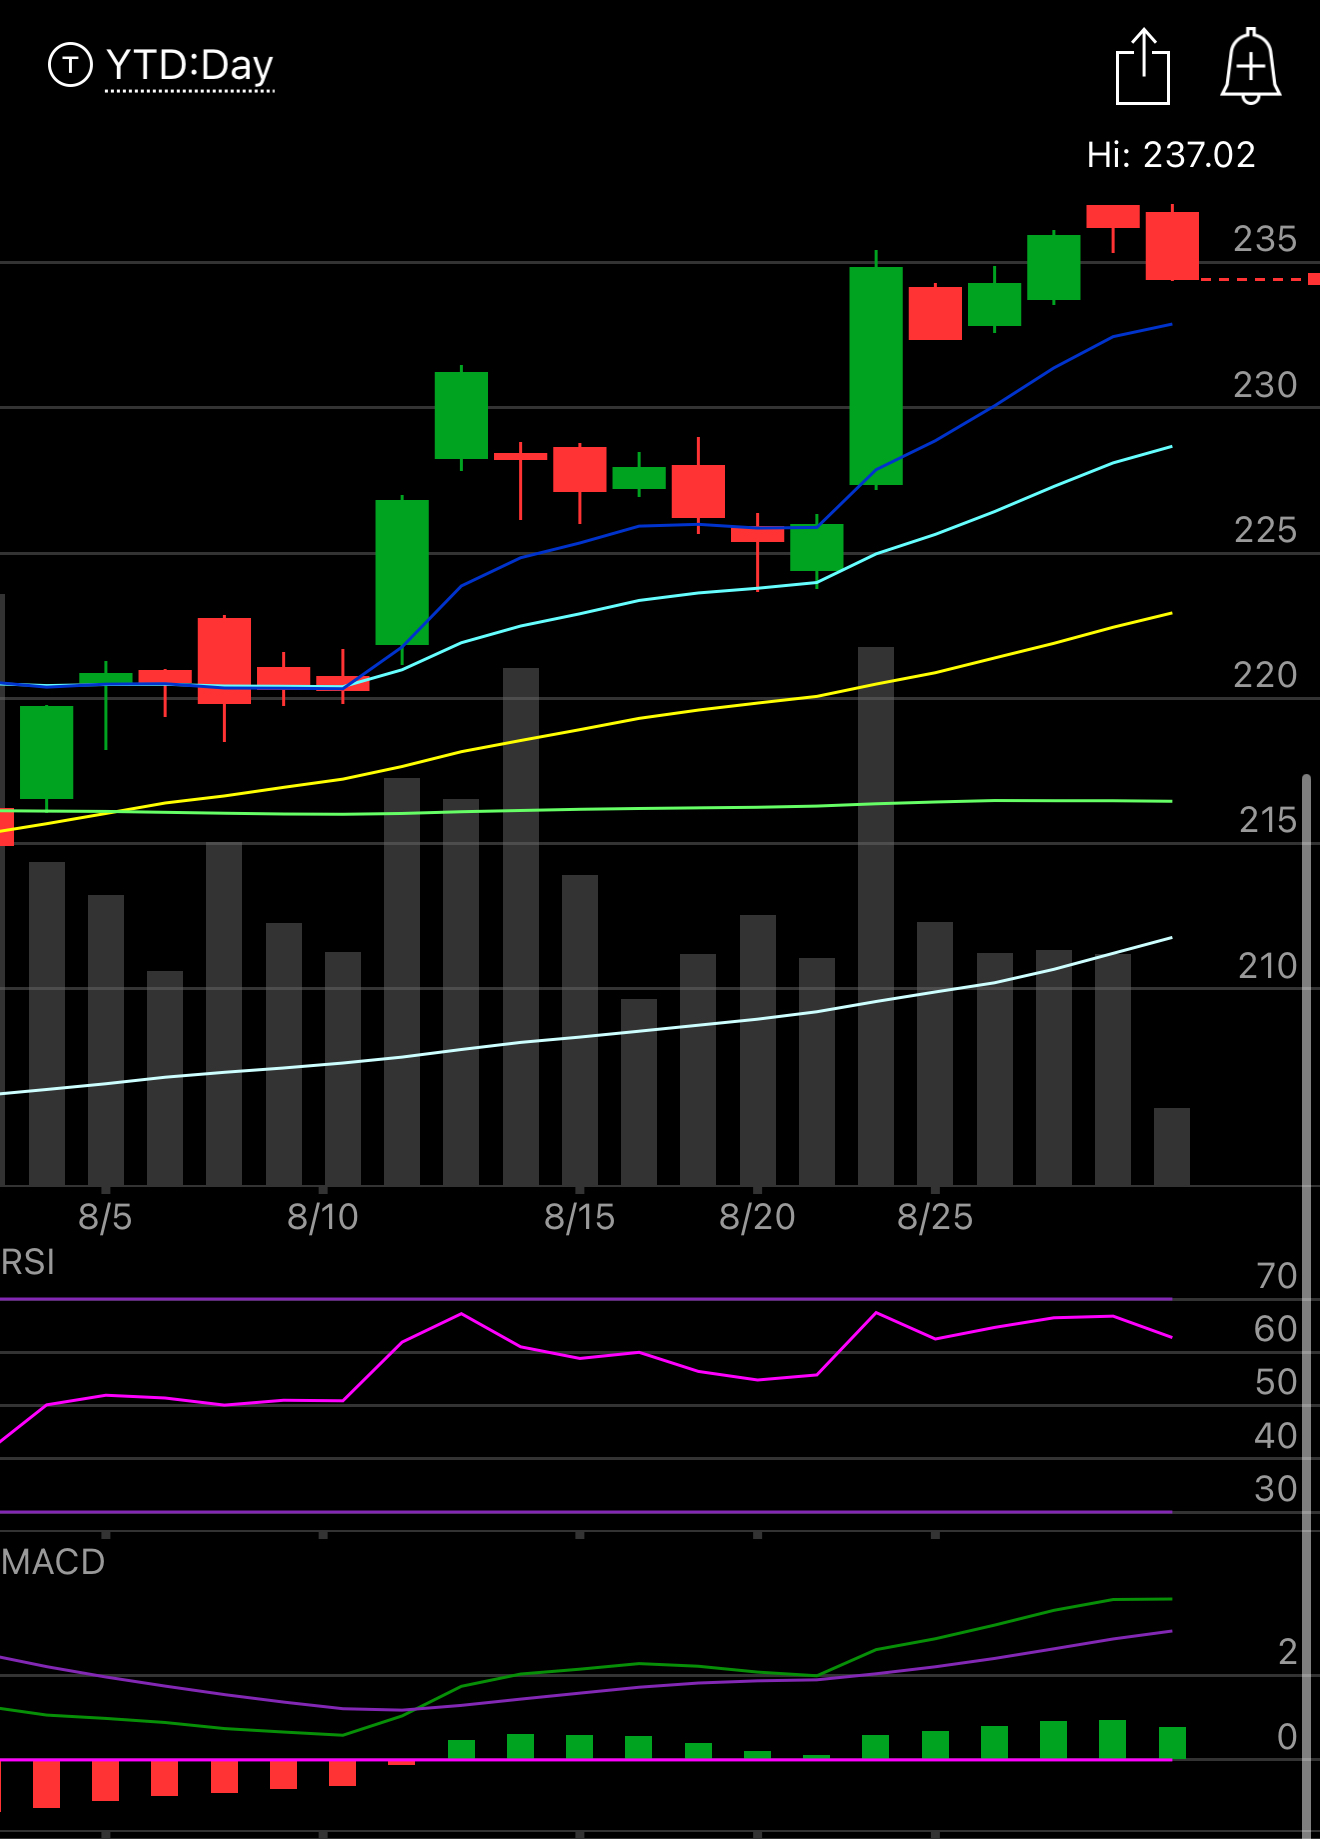
The QQQ is losing the 21 ema as you can see below, will we close above it today? We will have to see, but right now 570.09 is the level to watch today. If you look at megacaps, outside of Google and Apple, everything is weak and has been for some time. Our entire market depends on tech stocks going up and when they run into patches of weakness, which a close under this 21 would normally indicate, then the overall market struggles. NVDA broke the 21 ema in a big way today and this is very notable as it is 8% of our market and while it sits at 173.50 right now, the 50 day is just 3 dollars lower, if it breaks that, the market is going to be in trouble.
The IWM remains the only chart over the 8 ema in our indices. Small caps look like the best spot to be as money has been rotating there for a few weeks now. These are nowhere near the 21 ema today but they could be quickly if we have sustained market weakness from the large caps.
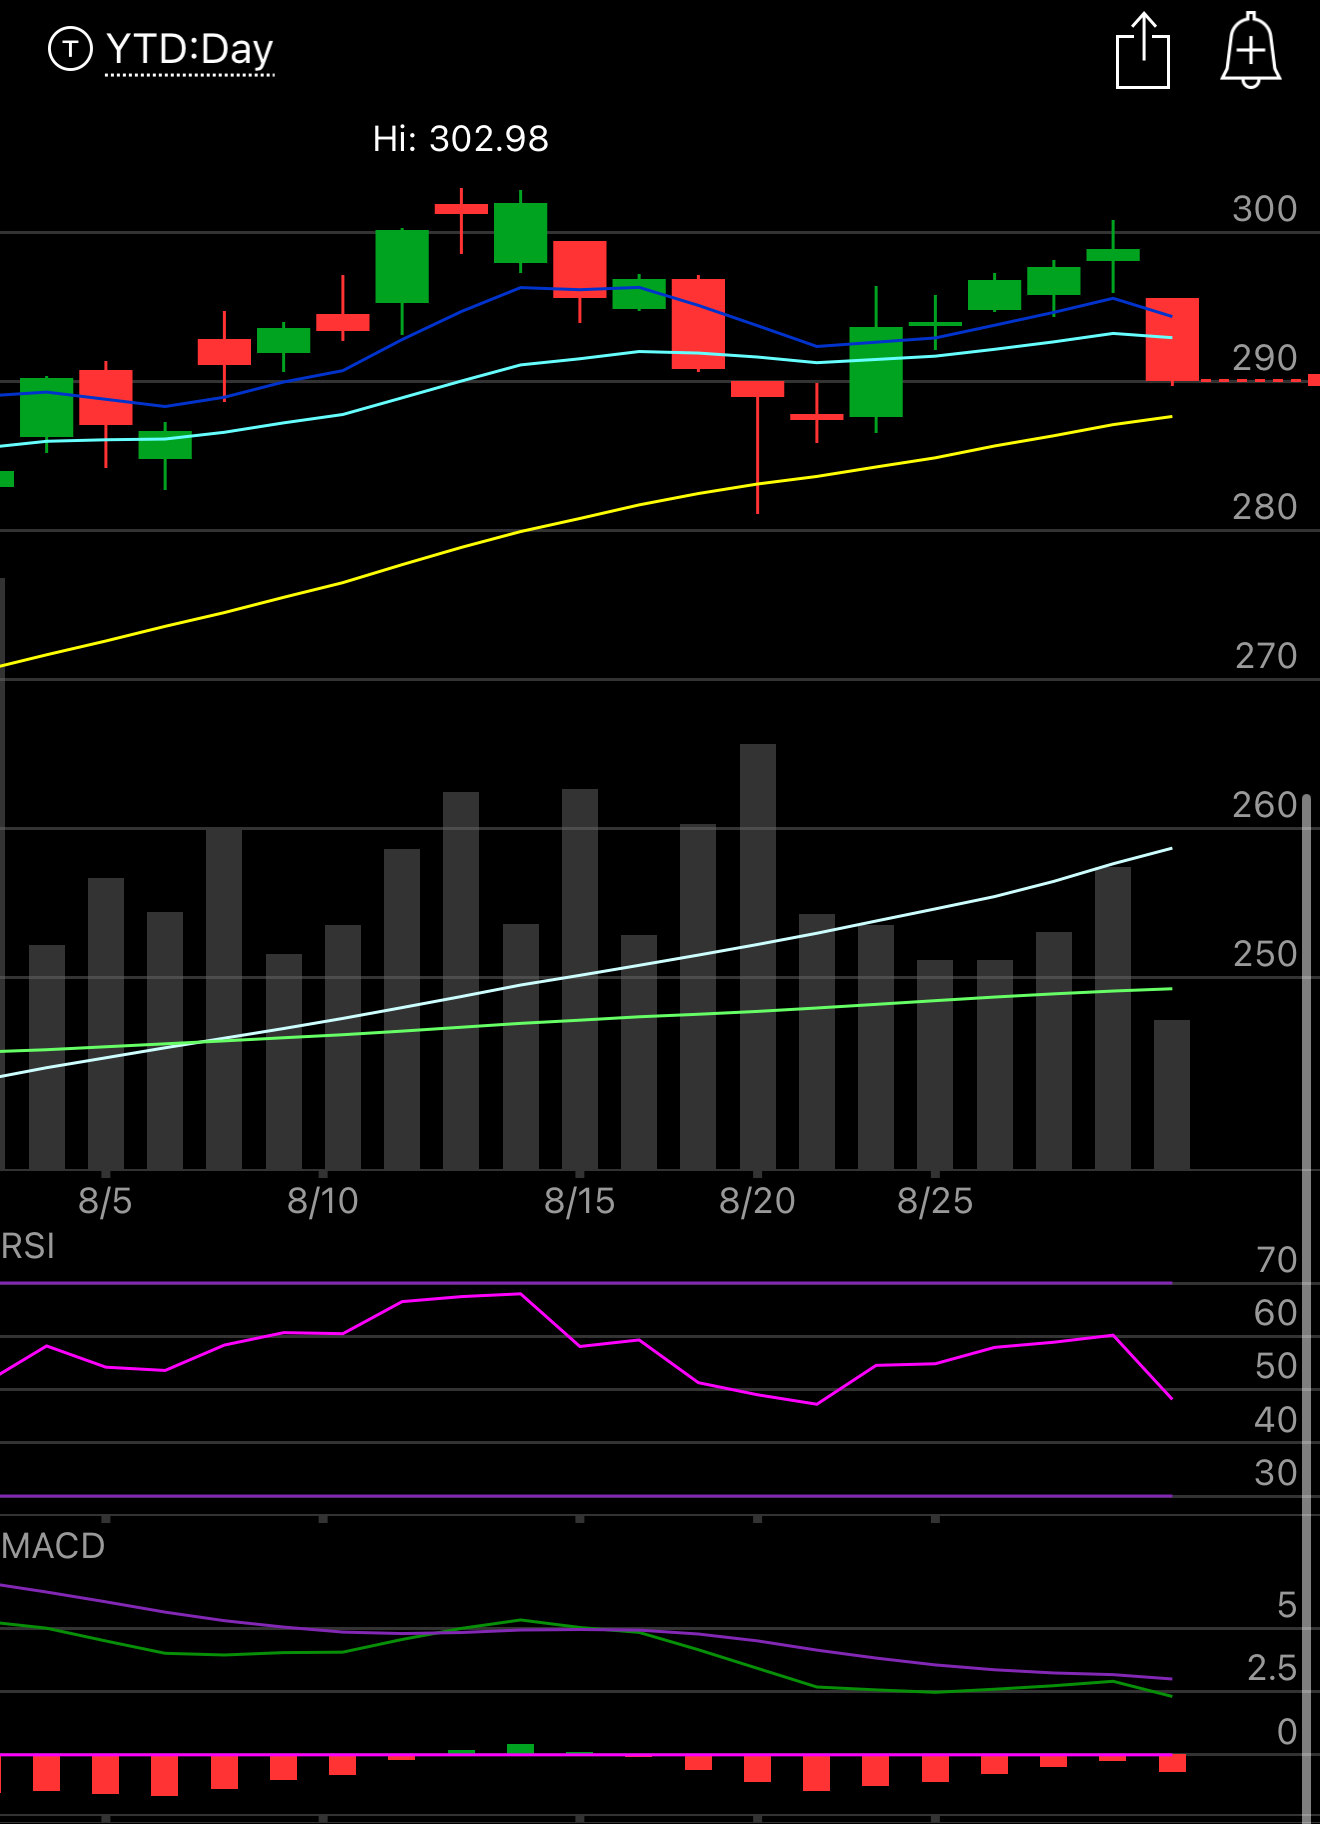
The chart you should all be worrying about most right now is the SMH, below, that is your semi etf. This ETF is basically the bulk of our market right now and it is losing the 21 because NVDA is over 20% of this etf. TSM,AVGO,AMD make up another 25% of the etf and all are very weak right now. If this loses that 50 day right below there is alot of room lower to the 100 day at 260 right now. While the SMH is up 20% yd and semis are probably still in the 2nd or 3rd inning of a multi year bull run, stocks don’t go up in a straight line and for whatever reason the charts are showing you weakness now. It’s really up to you and your pain tolerance on how you play this. Will the SMH be up 6 months from now? Likely, but will it fall another 5-10% first if it loses that 50 day below? Likely as well. If for instance you went long here, I would close on a break of that 50 day to keep your potential losses limited.
My Open Book
Trades I Made Today


