
9/22 Recap. We Continue To Flirt With Disaster
But the Trade Of The Week Did work out, so there is that

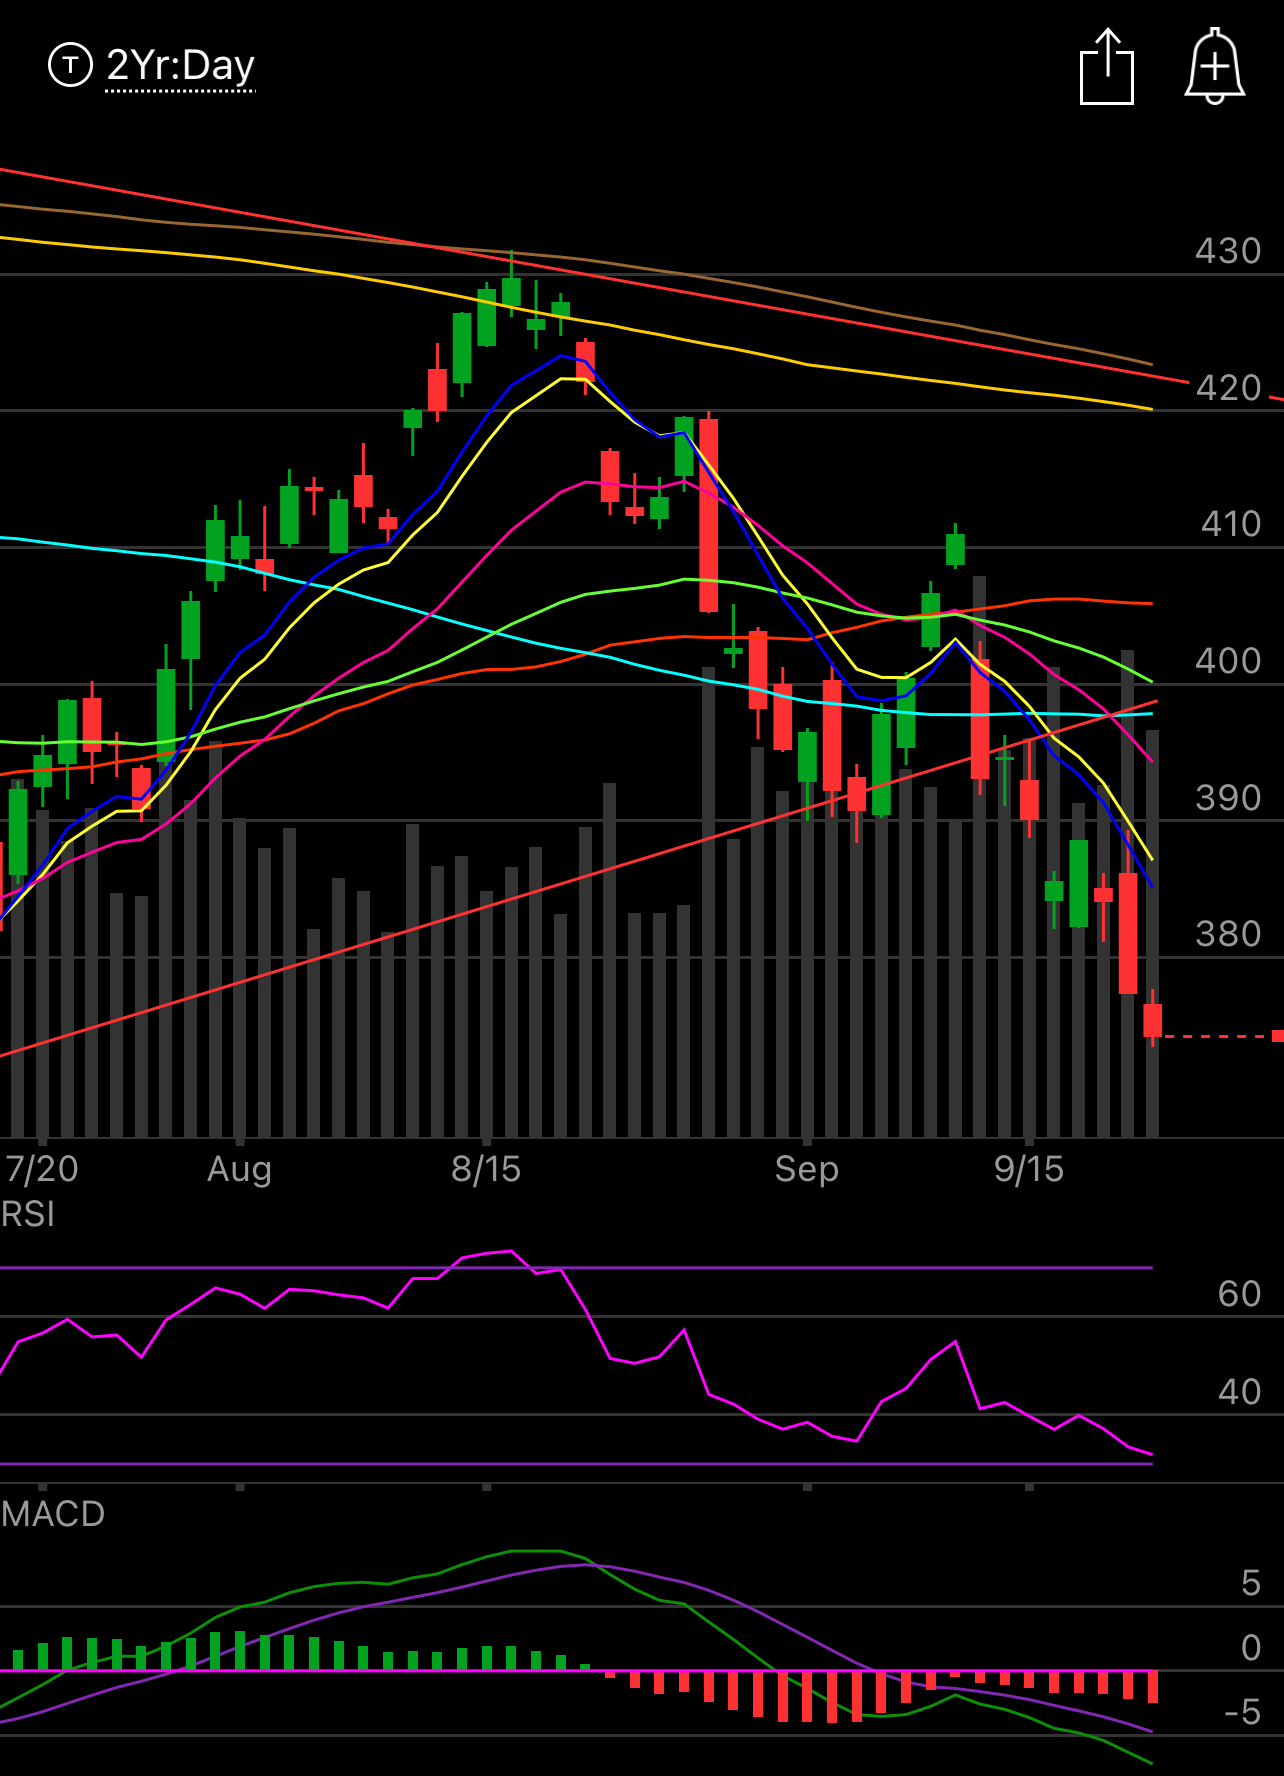
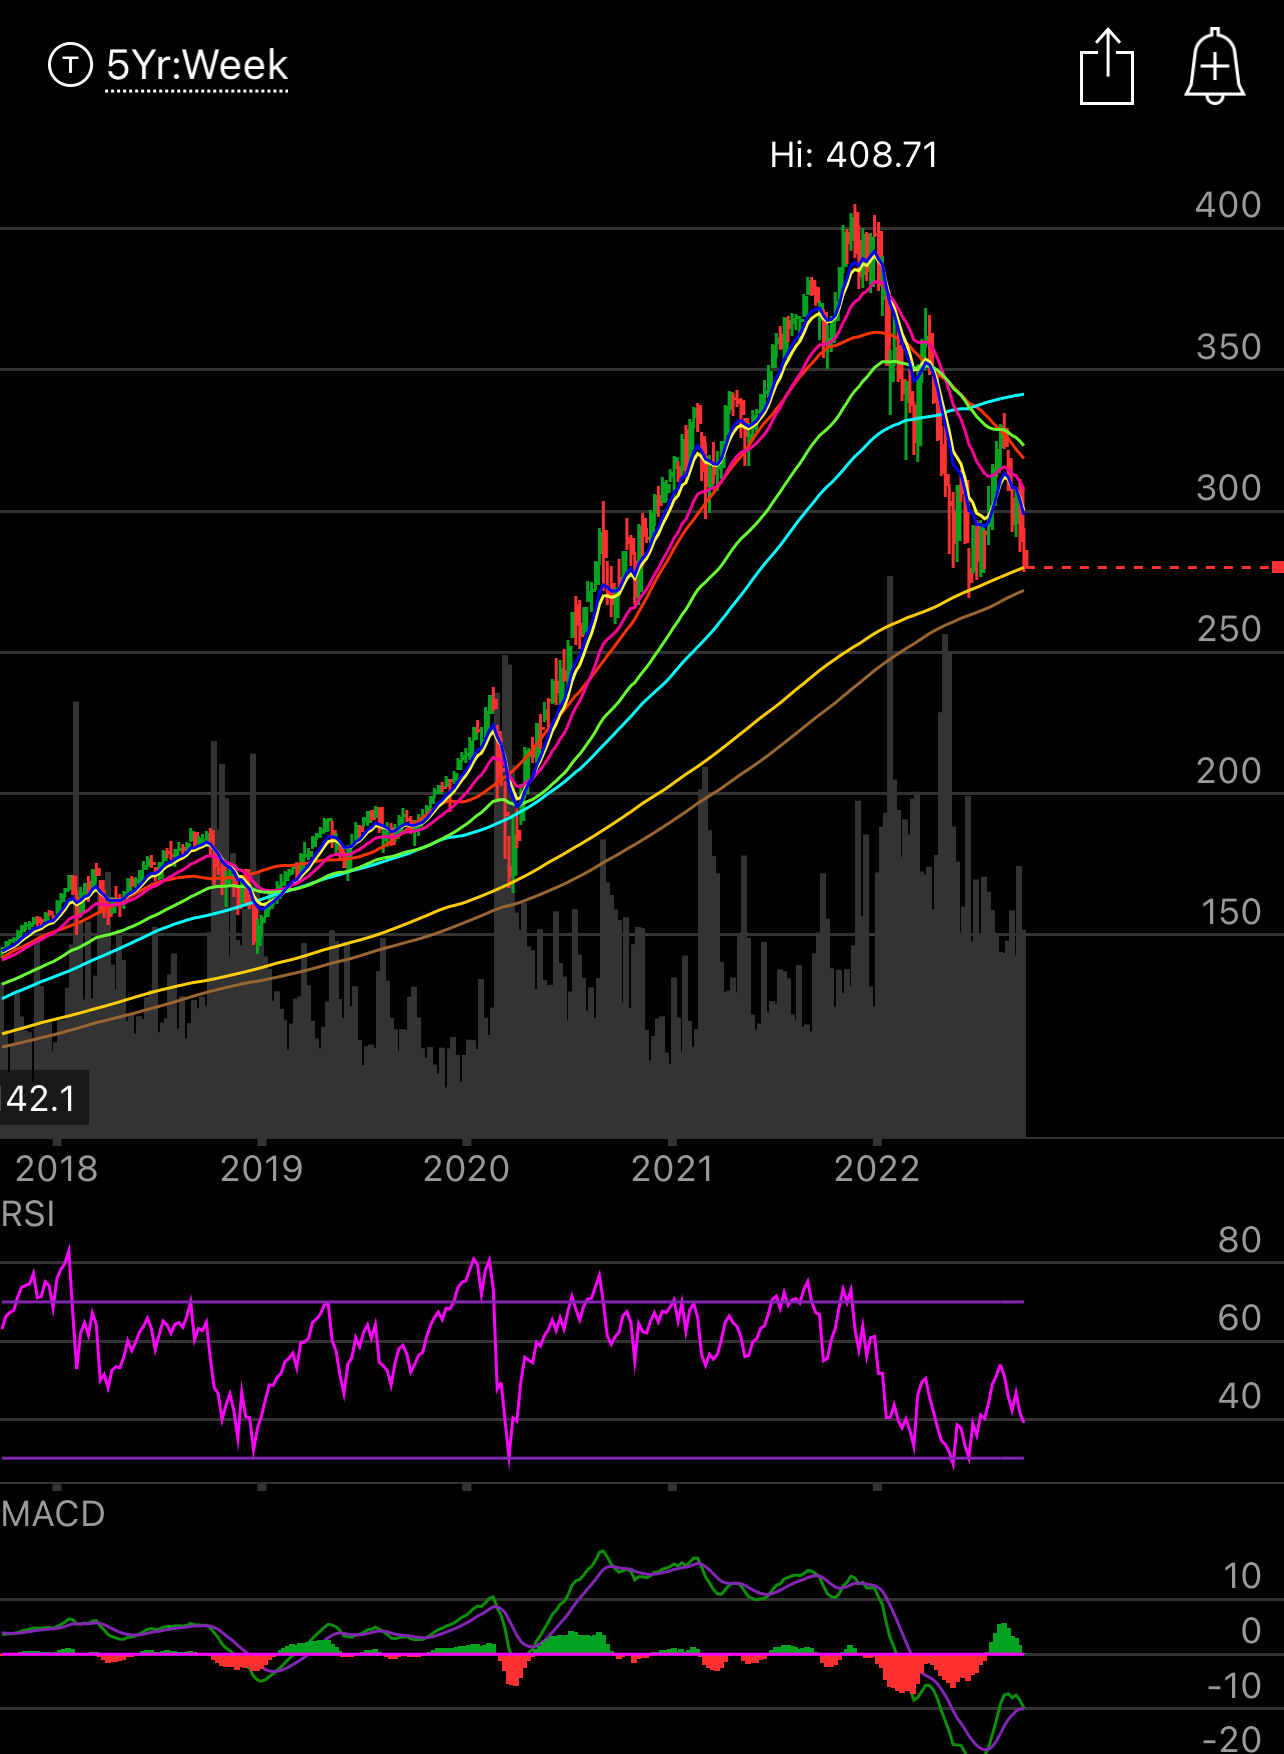
The market continues to flush lower, even today after a nice move late day, there was a huge dump in the final minutes. The SPY continues to push lower and the moving averages are moving down with it, notice how last saturday I made my post about the bearish engulfing candle that formed on the weekly and look at the continuation we had this week?
The QQQ is on the edge of complete destruction look at this trendline that we are on. It has been major support for years, if we break this tomorrow, on a weekly timeframe, it is going to trigger immense selling. Say a little prayer tonight if you’re long, you want a bounce tomorrow.
Today was a good lesson in the importance of charts and how they can not be ignored. I get alot of grief from the fundamentalists on Twitter but take this morning, I tweeted out a chart of COSTCO which had formed a bearish head and shoulders on the weekly, without even knowing the name or anything I simply said it was going lower, that is because the formation occurred bc large players were leaving the stock, hence how that pattern was created

as we look now after hours, Costco is continuing its move down going from 488 to 473 as I type this. You see, with stocks, its simple, they go up when there’s more buyers than sellers, and they go down when the opposite happens. So a candle on a chart, it tells a story, what that story means, it’s up for interpretation, and many will debate the merits of fundamentals, but the candles are telling you what is important, the flow of money. The way COST began sloping down was a sign that money was leaving before earnings, the fact it broke below key levels before as well was more of a tell, there was no support. The after hours move confirmed it. Of course nothing is guaranteed, but this is a game of probabilities and the patterns dictate the those probabilities. When you combine charts with the unusual options activity I post everyday, you have the first few steps in discovery to putting on a trade.
Today’s Unusual Options Activity & What Stood Out
