

Discover answers the question every trader asks before taking a trade: how have trades like this one actually done? It allows subscribers to search a record of more than 100,000 large institutional options trades, each followed from the day it hit the tape to the day it expired. The tool can be found by clicking the Discover tab on the database menu. Below is what the tool does and what subscribers can use it for.
Open Discover: app.jamesbulltard.com/discover
I know I mentioned Saturday as the launch day, but I wanted to get this out a day early and interact with everyone in the discord today to get feedback. This is the ultimate institutional options data backtest tool. I know I discussed this a few months back but there are more combinations than you can imagine and getting this right took alot of work. While this tool is special now, where it will be in a few months will blow your mind. We have alot of things planned. For instance, we are in the final stages of testing, but we will be assigning probabilities based on historical data to every new trade that will be logged into the database in the near future. What you will see is a product no other options service has delivered. When a certain structure comes through you will know how it has performed historically alongside every new trade. Beyond every handpicked institutional trade being logged and tracked, the database has been building ai generated trade ideas for nearly 4 months now, we tracked all those and have a dataset showing you which ai generated setups worked better than others. Below I have a simple FAQ of everything with screenshots.
Discover: Features and Uses
What subscribers can do
Subscribers describe what they want in one sentence, for example “Show me Institutional Flow for Any Setup that gained +30% or more within 7 days, from the last 90 days.” Changing any part of the sentence updates the results. You simply click and adjust to what you want within a specific timeframe. If you only want put sales it will give you that, if you want trades that only returned 75% or more within 7 days that is available.
Choose what to study
Institutional Flow, AI Trade Ideas, or one of four Signals tracks (Weeklies, 0DTE, Risk Reversals, Synthetic Longs), plus Ticker Radar. Each track is searched on its own, so different kinds of trade are never ranked against each other
Set your own bar
Pick a profit target and a holding period from 3 to 180 days
See what has worked most often
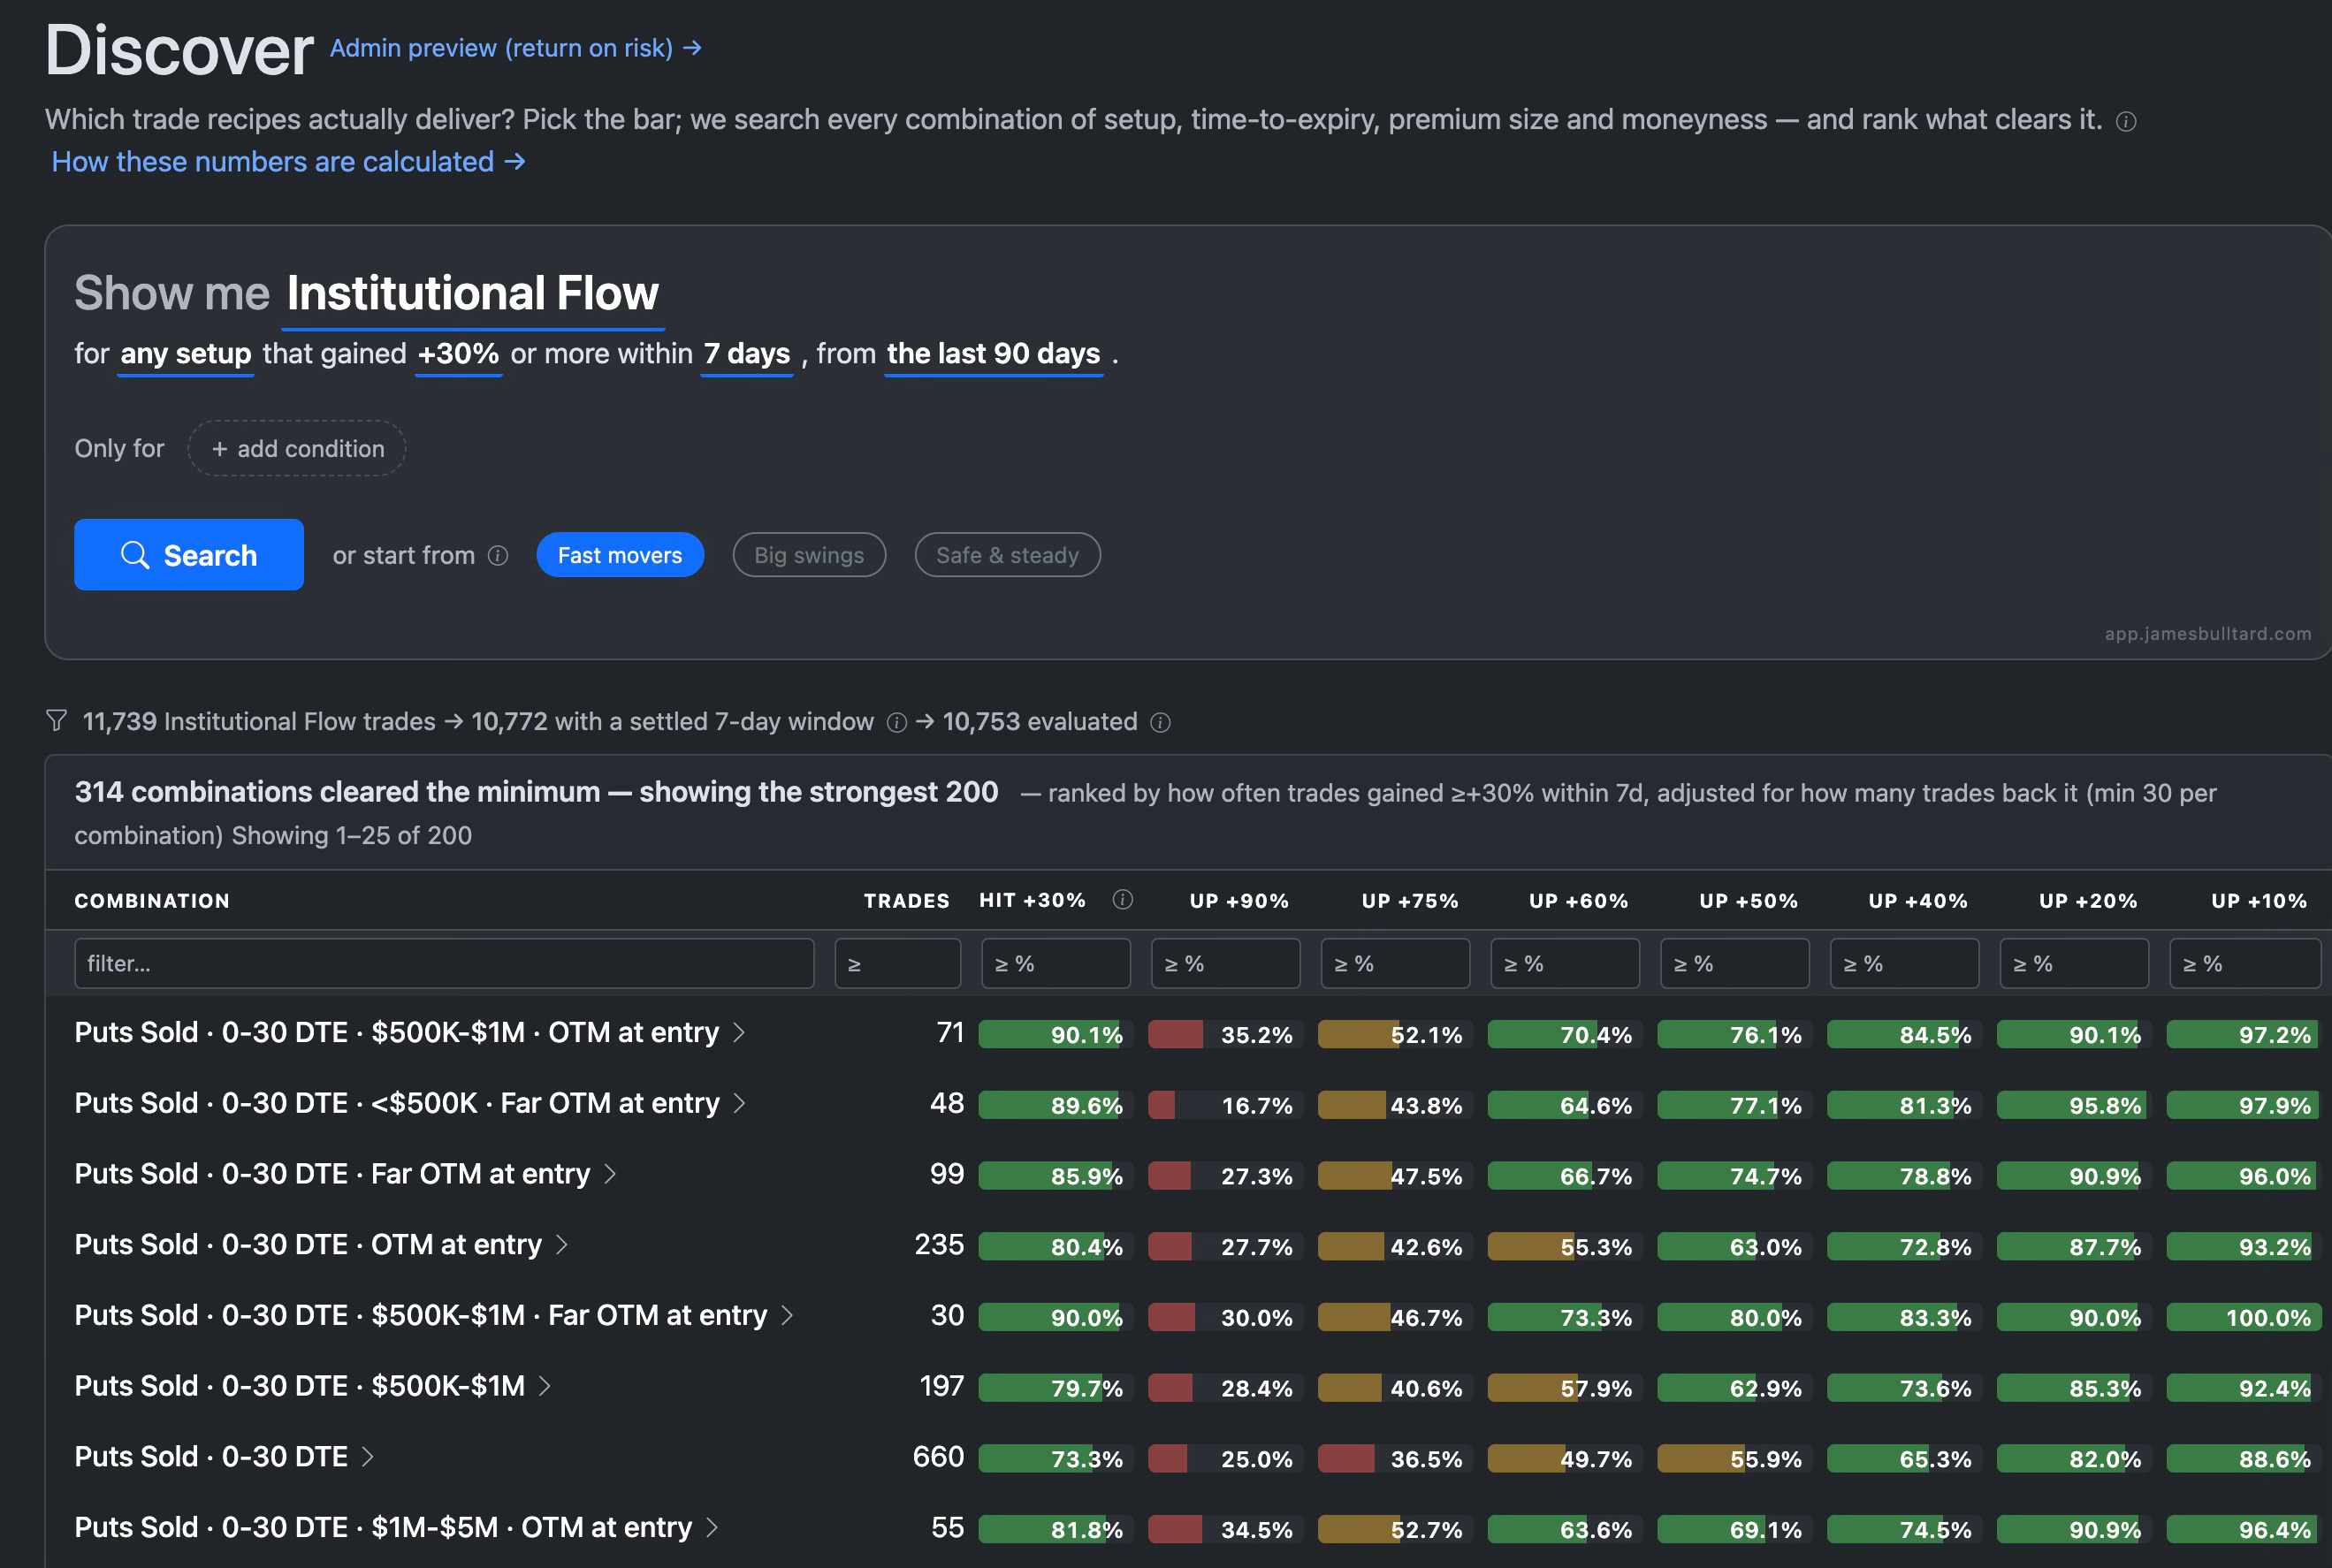
Discover searches every combination of setup, time to expiry, trade size and distance from the money, and ranks them best first. The ranking uses the win rate the sample size can actually back up, so a lucky 88% on 32 trades ranks below a solid 74% on 900. A combination needs at least 30 completed trades to appear
Match today’s market
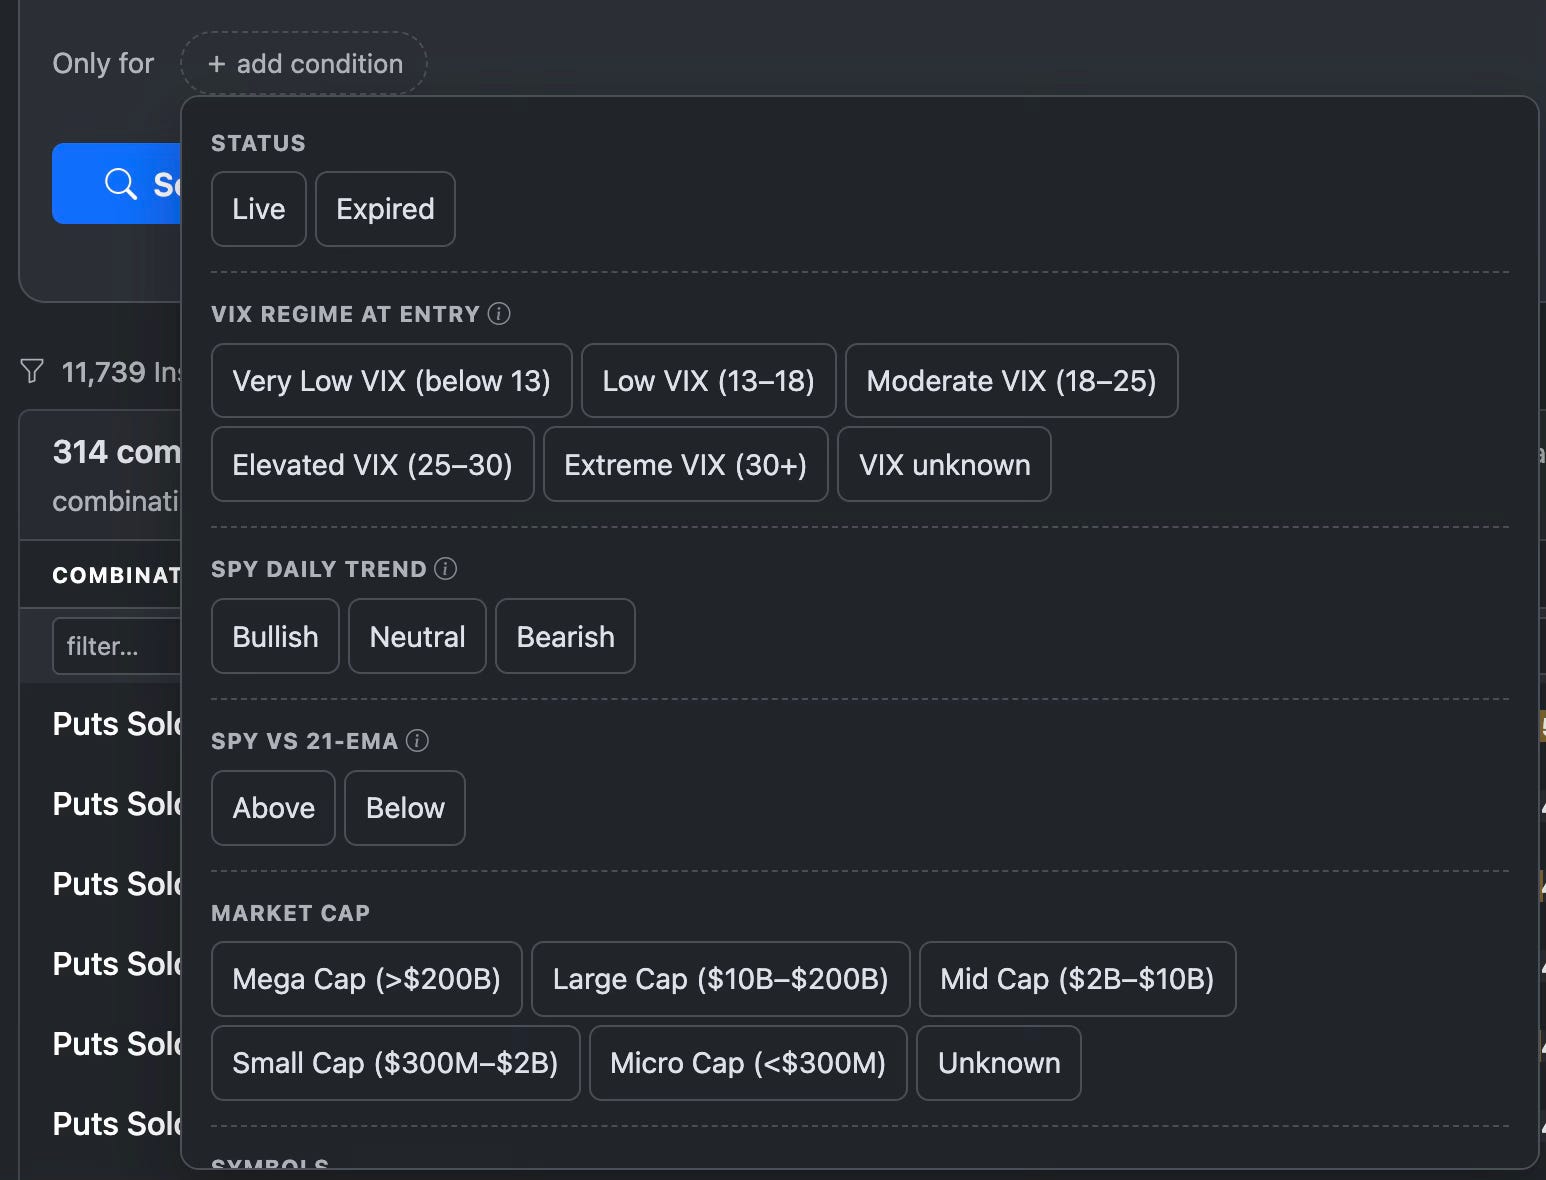
Narrow results by VIX level, SPY’s trend, sector, market cap, open or finished trades, or a personal list of tickers
Check the evidence
Click any combination to see every trade behind it, winners and losers split out, with each trade’s peak gain, premium and outcome. Open any trade to see its full life: the profit and loss curve from entry to exit, the milestones it reached, and the market conditions when it opened. The example below is the best trade combinations with a 30% return within 7 days from only the last 90 days of data. You will note that 0-30 DTE puts sold OTM between $500k and $1m hit 30% at a 90.1% rate leading the way.
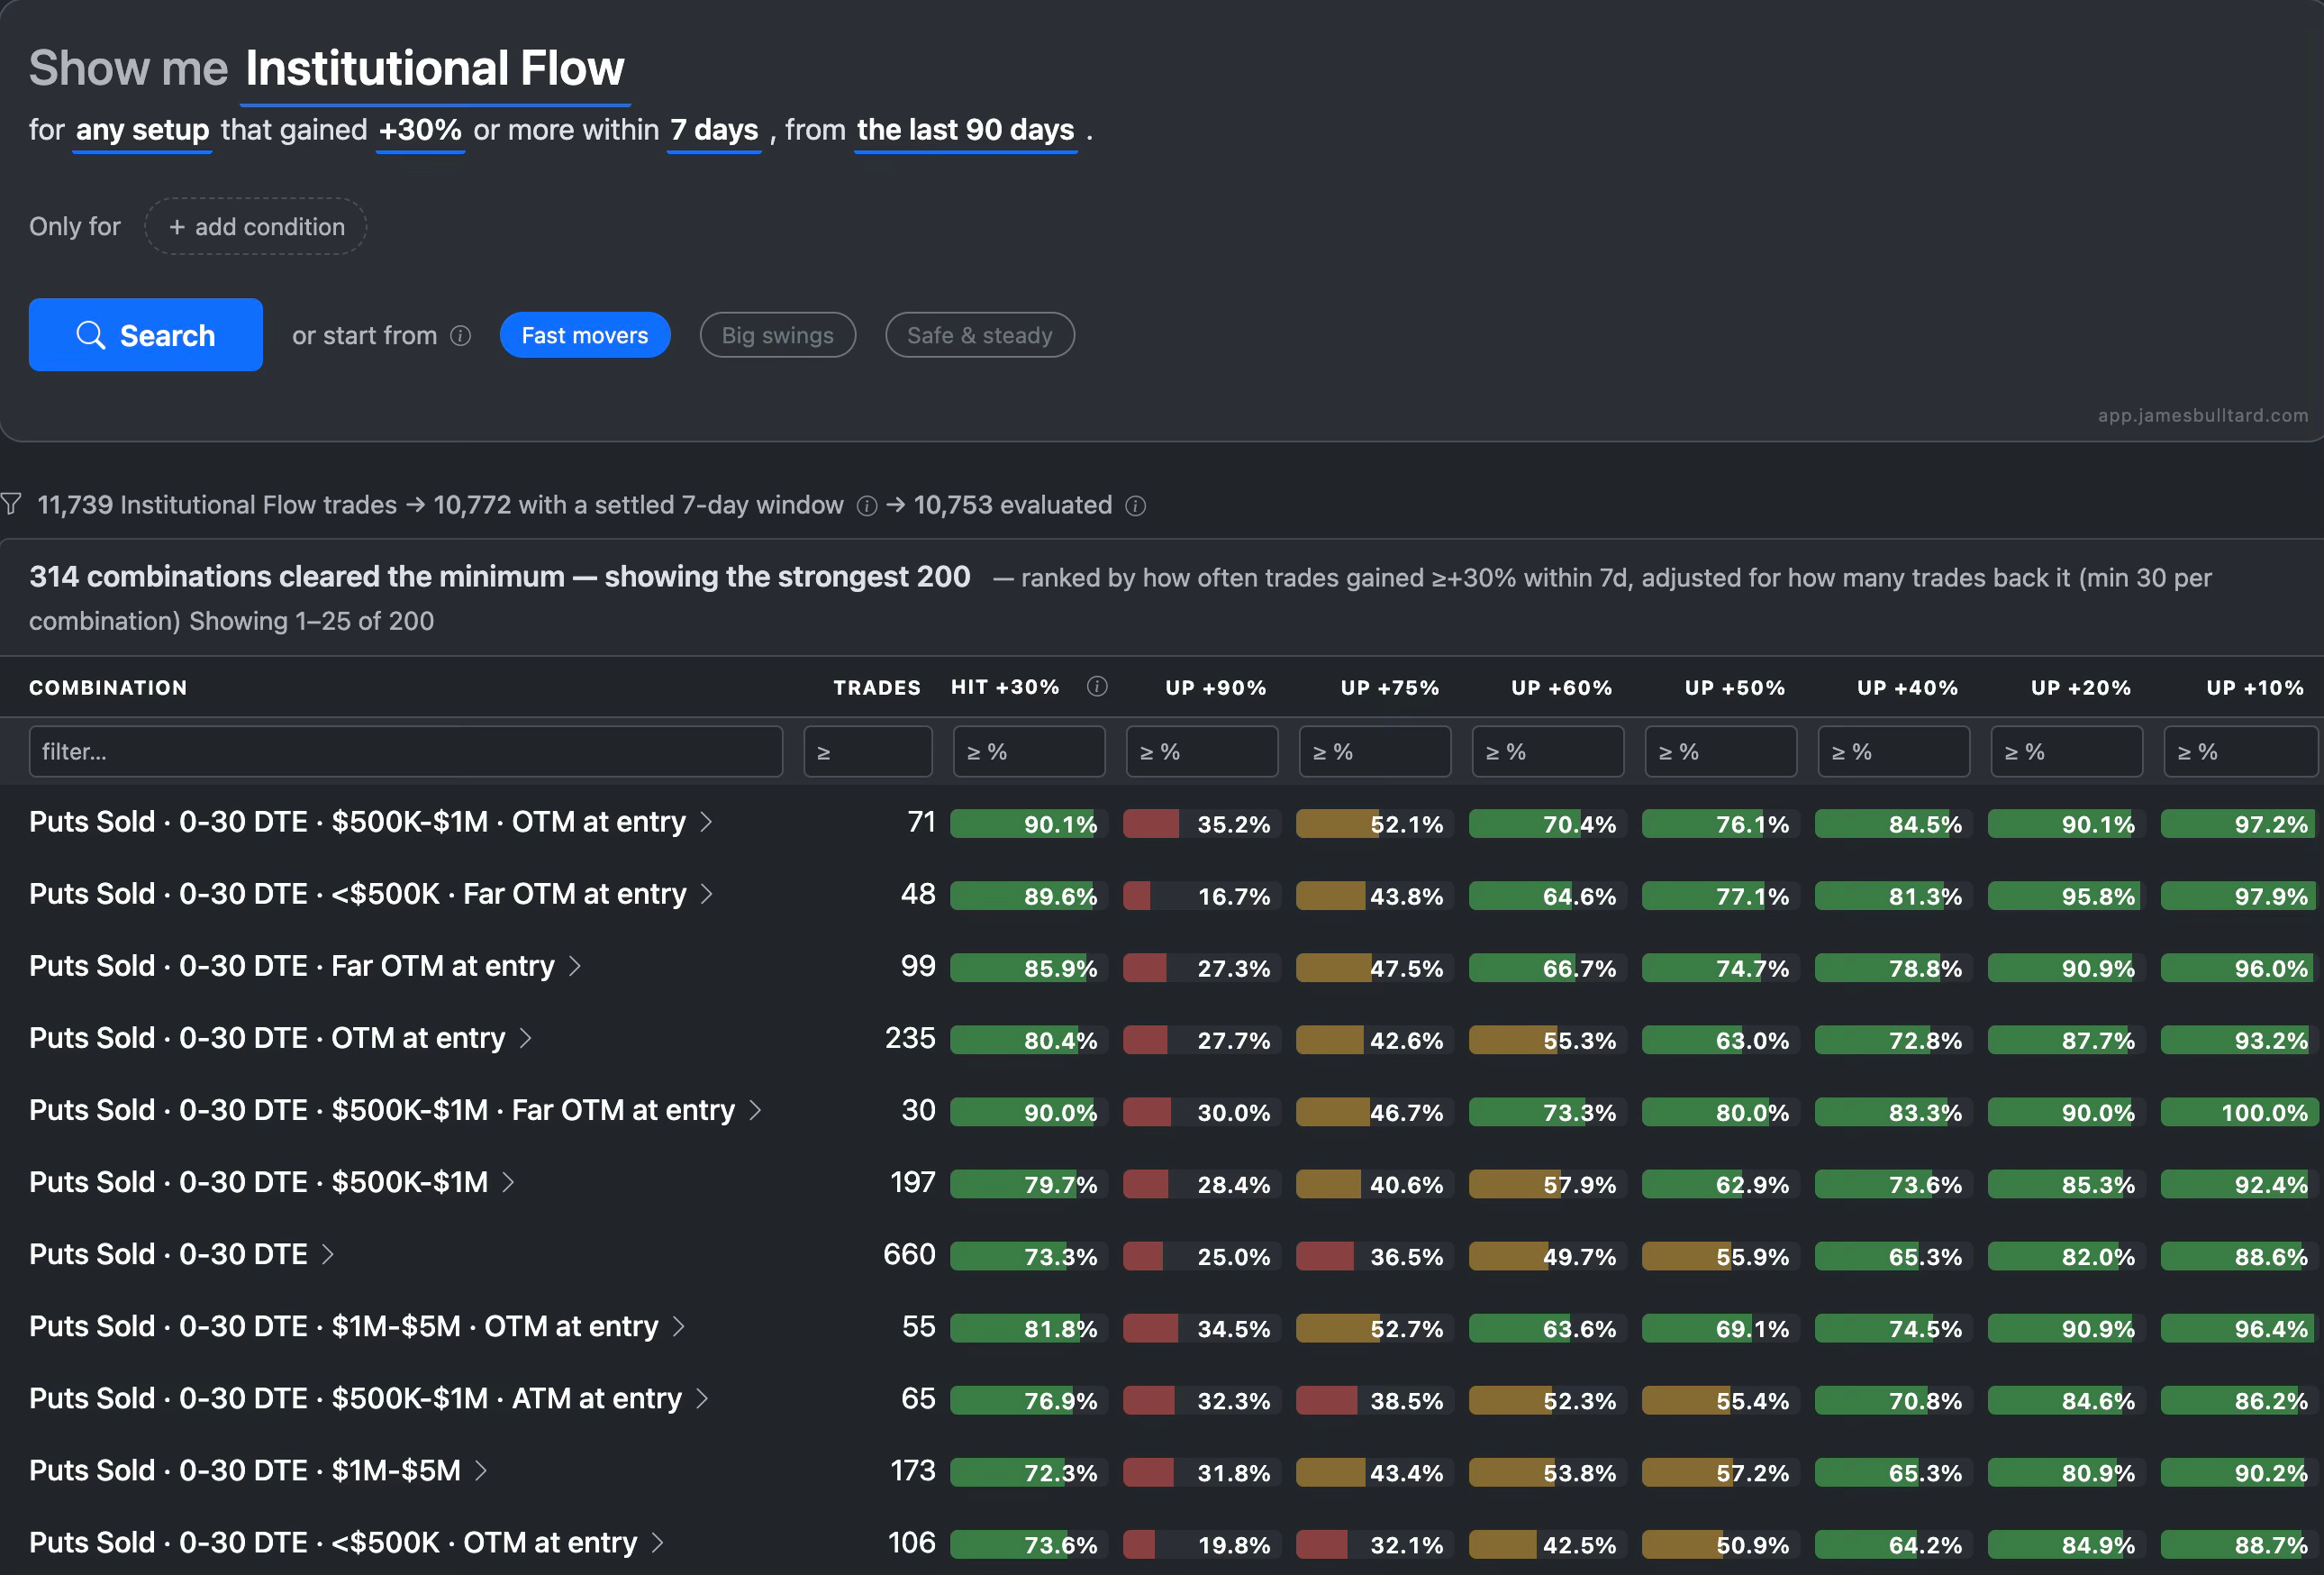
When you click the first row you will see every trade behind the combination. You can click on the 64 that worked and the 7 that did not by clicking on the red and green boxes.
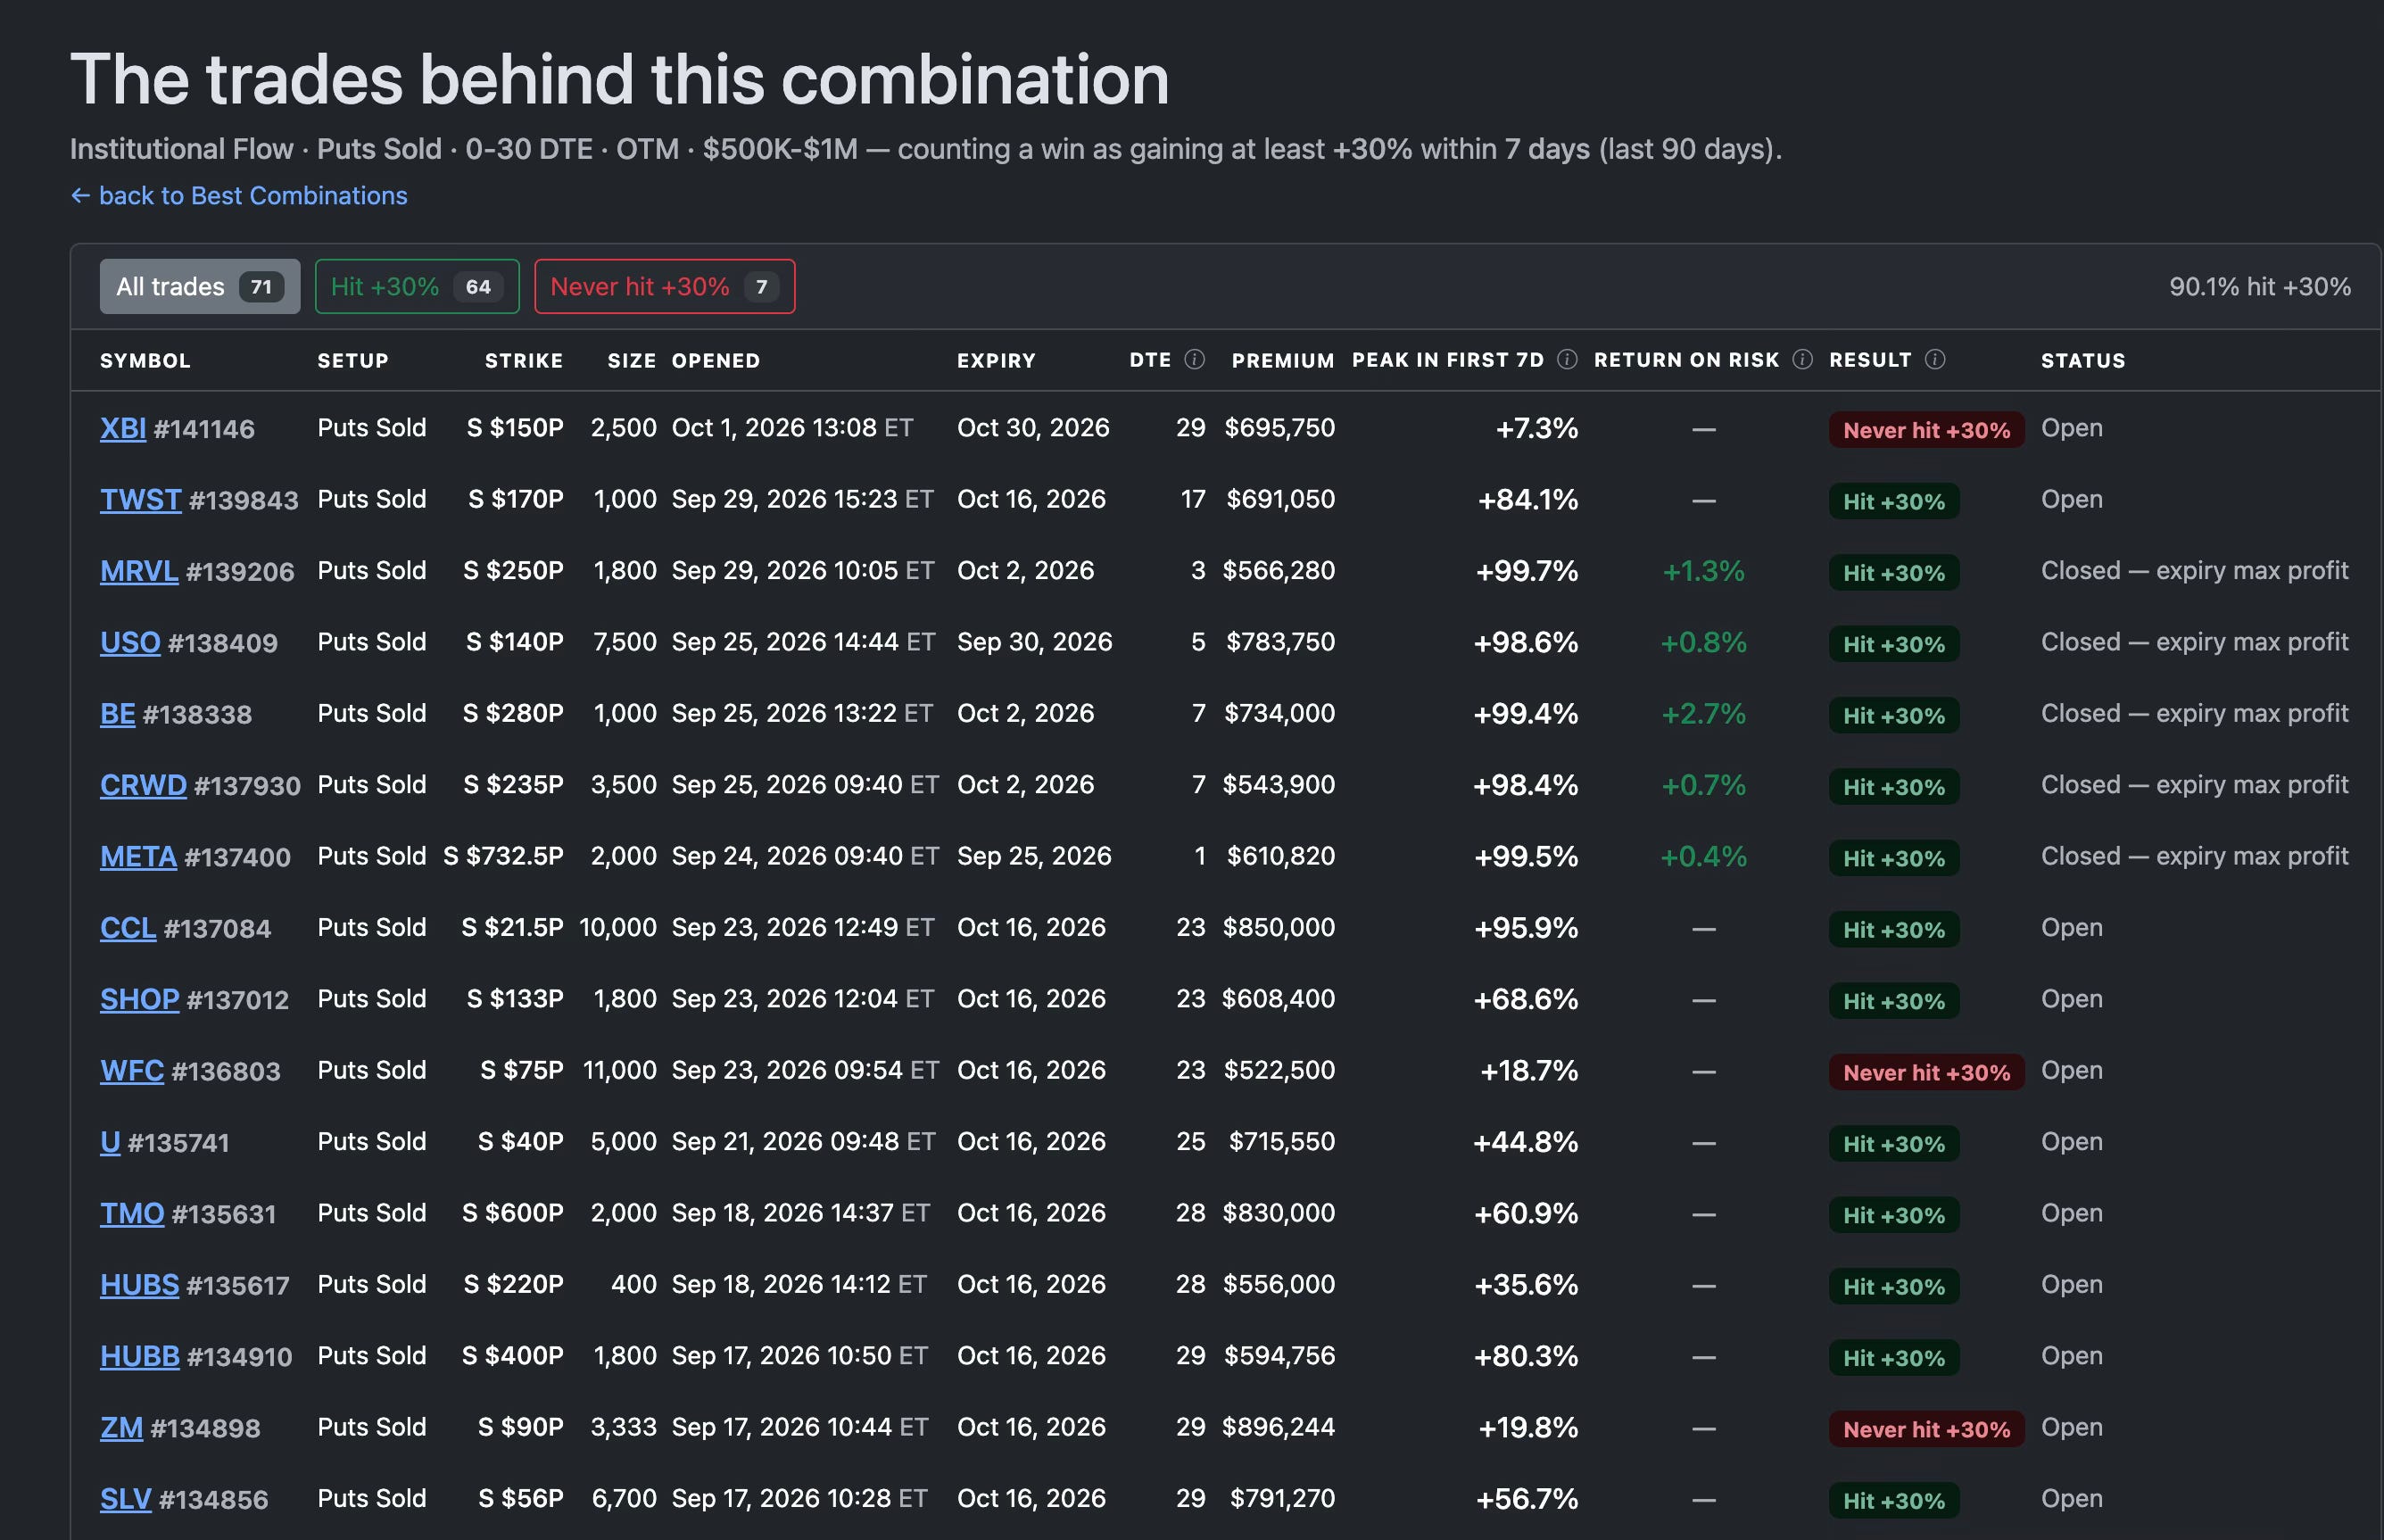
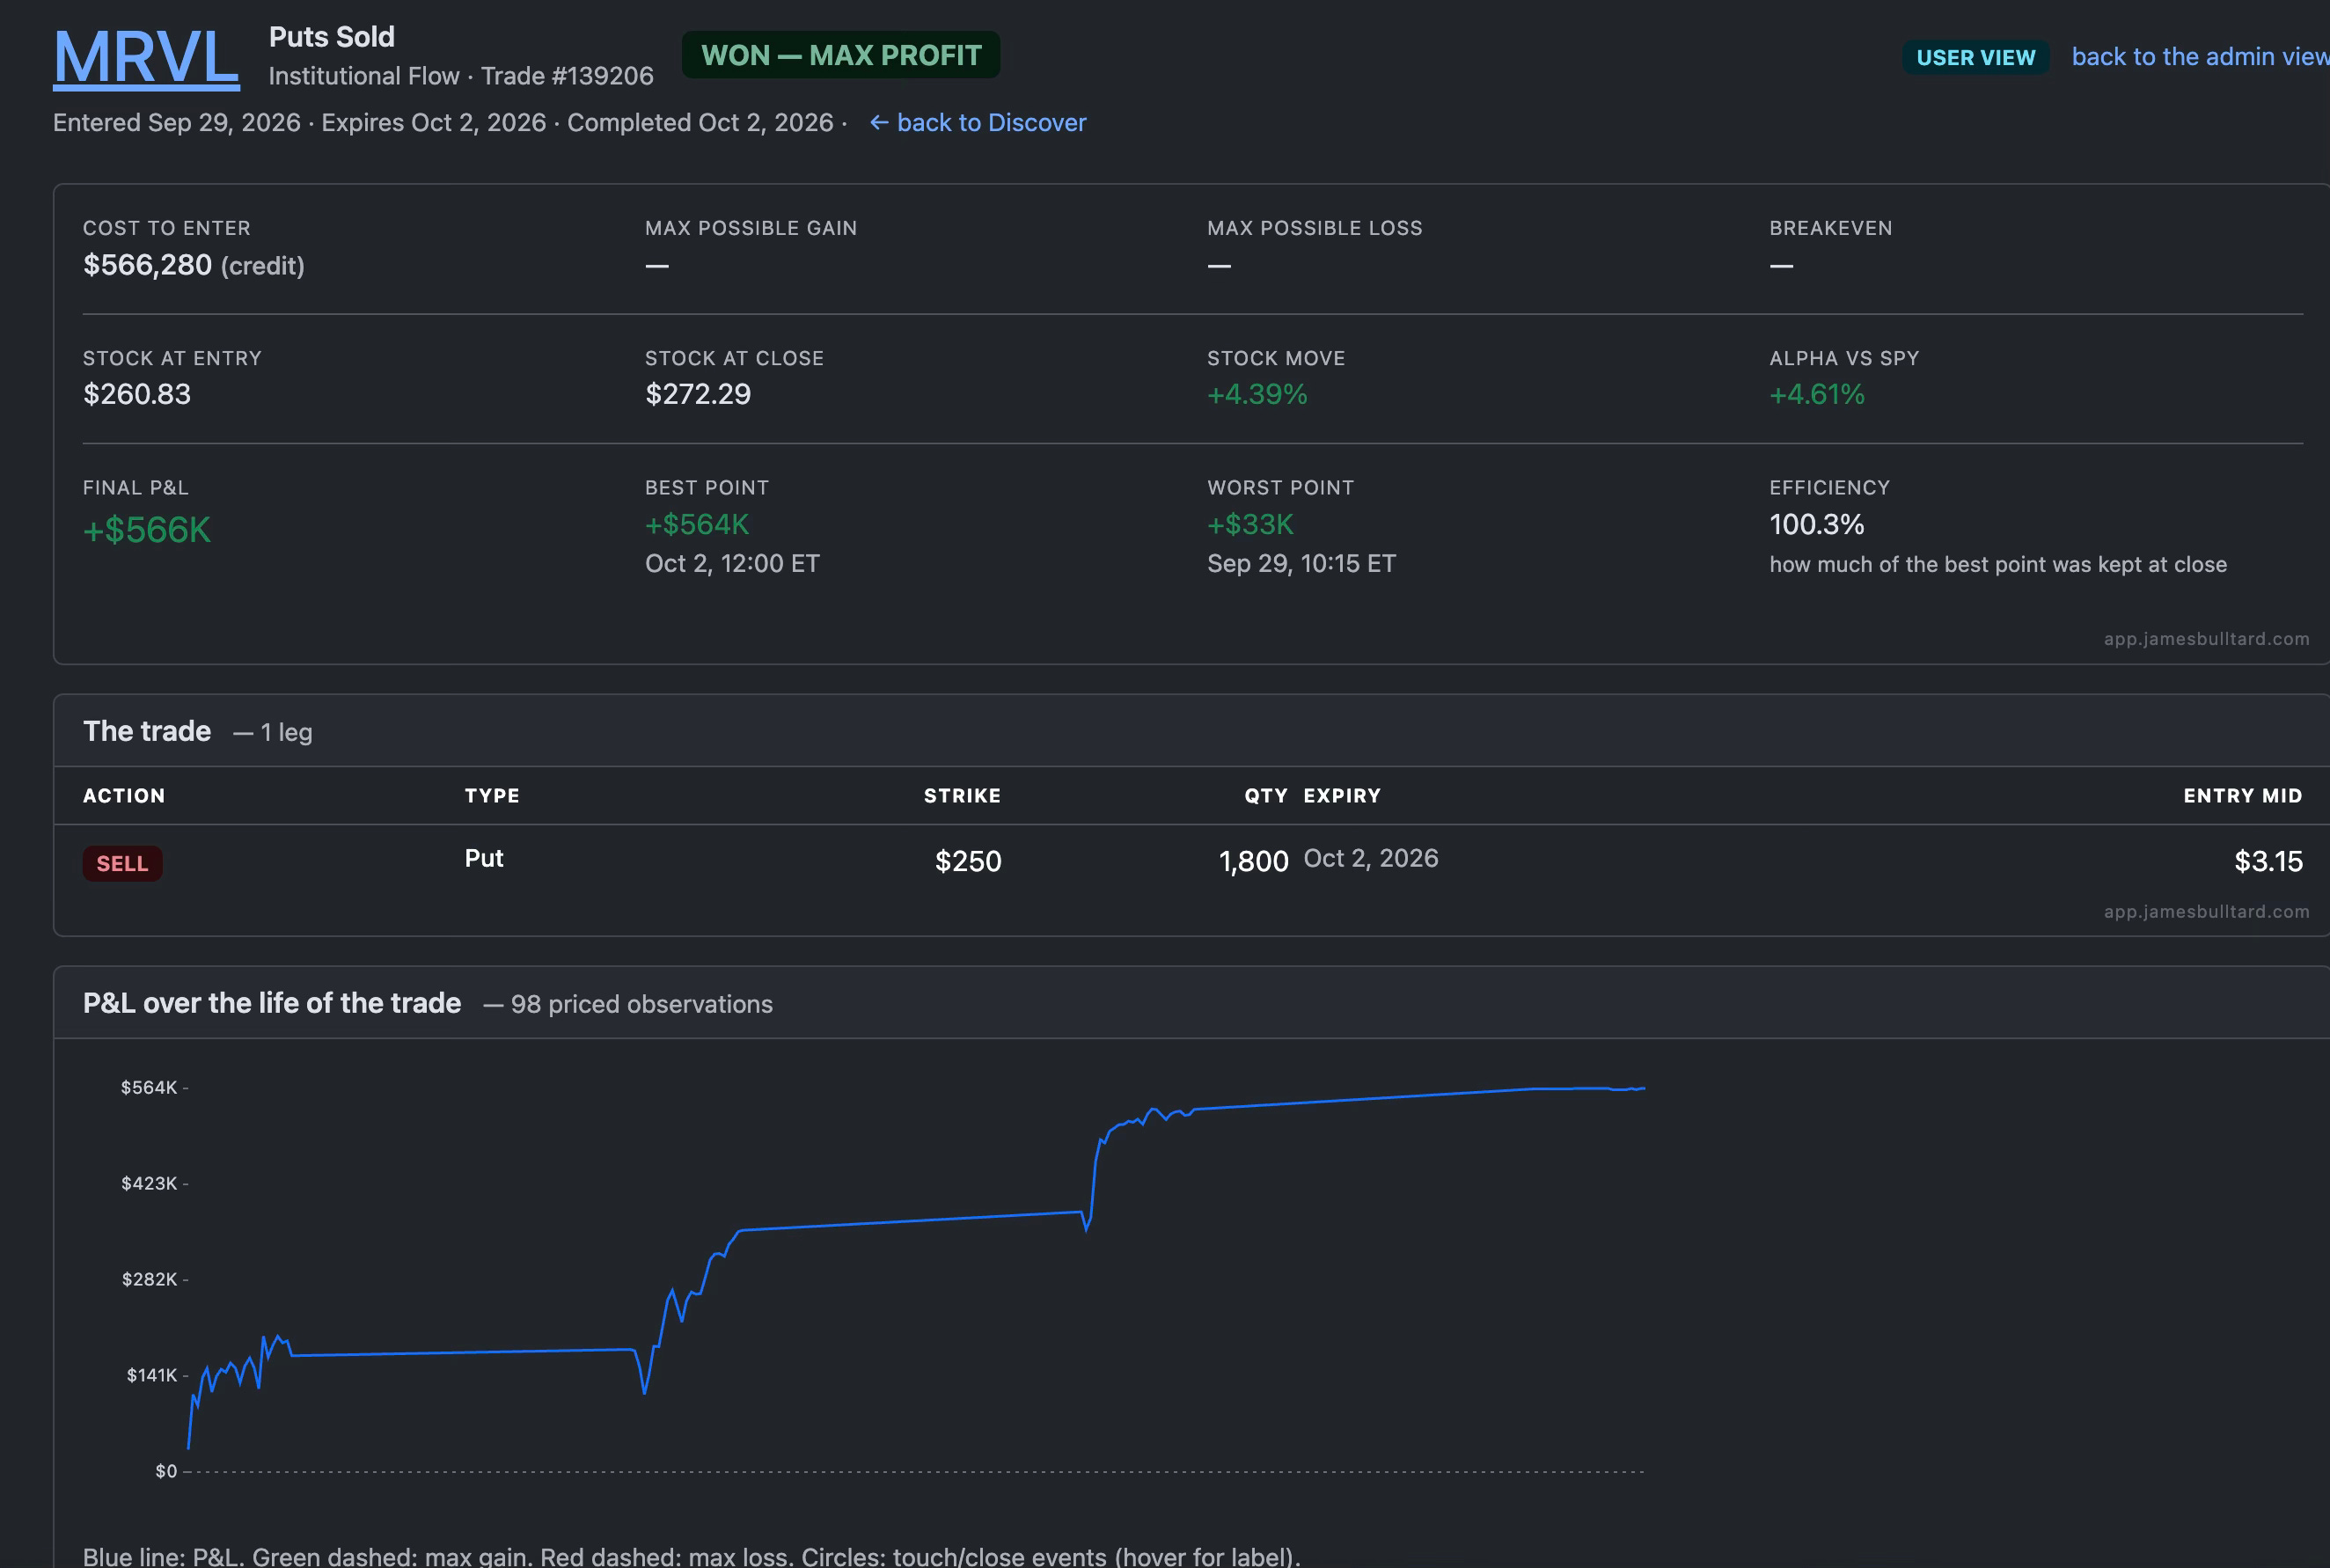
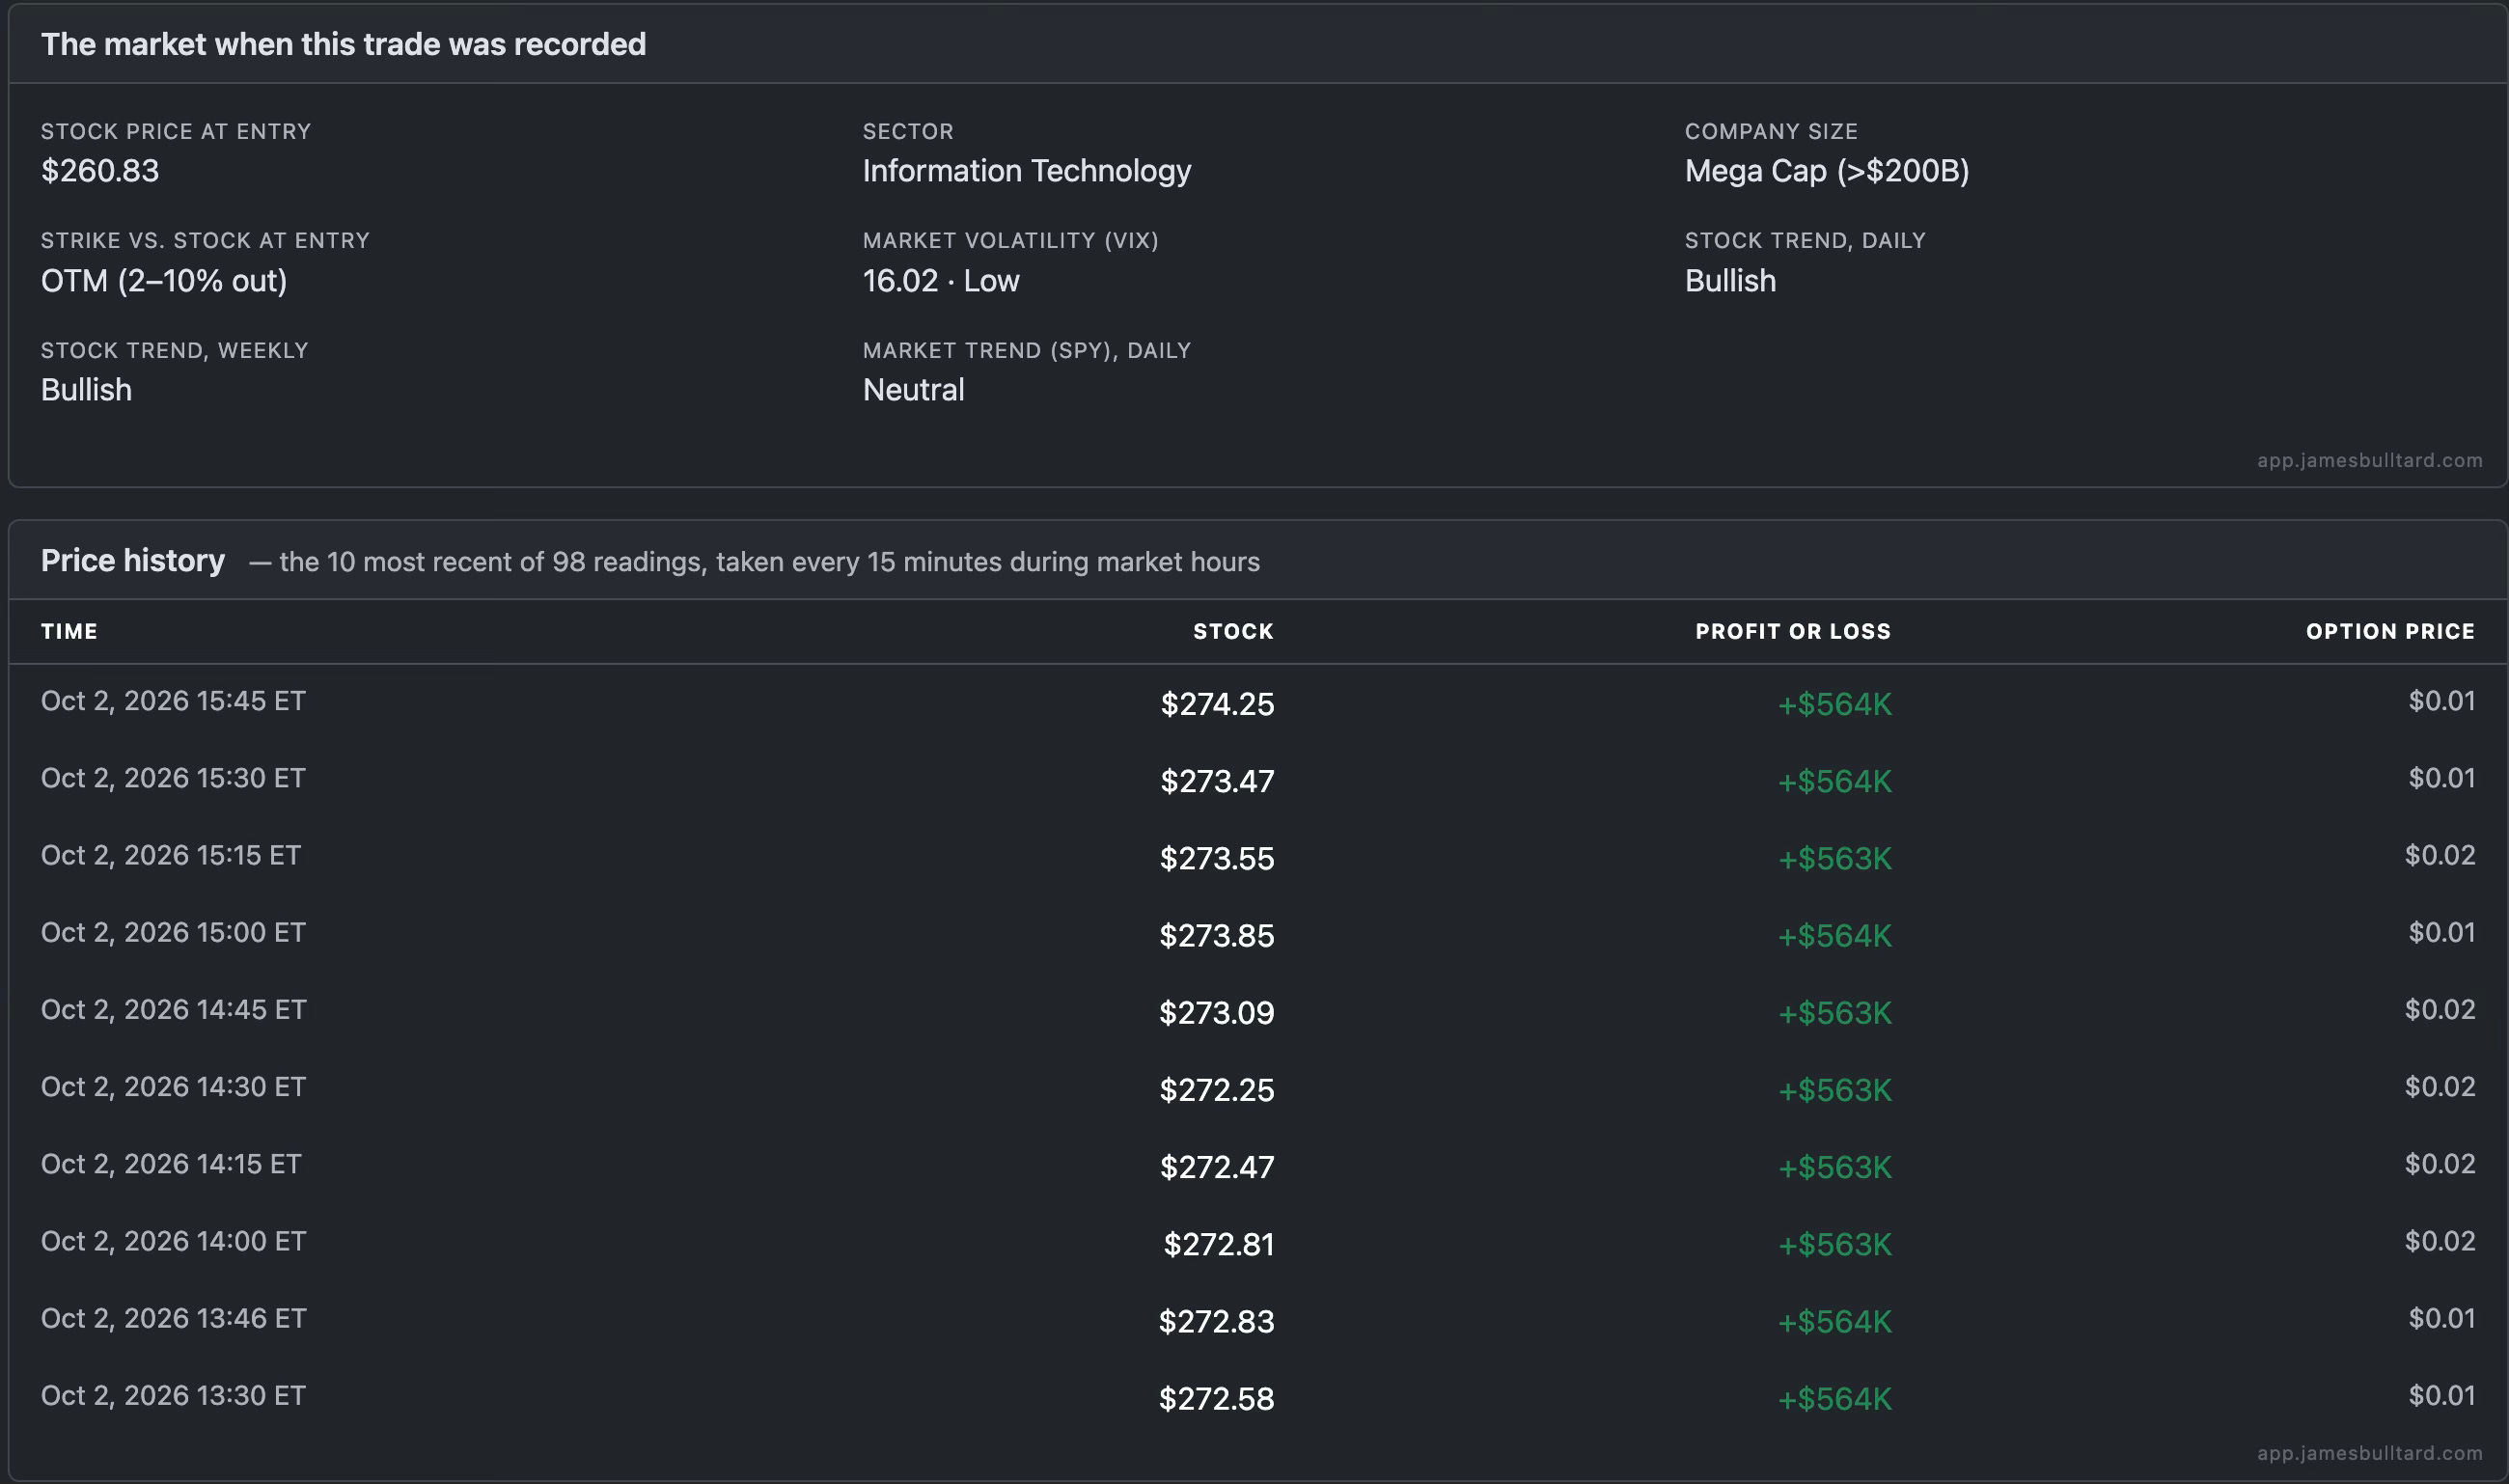
What you will notice is a number alongside each symbol, click that and here is what you will see, I will use MRVL the third one from the top in the example below. It will show you everything about the trade. It will show you the market environment when the trade was logged and it will show you the movement of the option from when the trade was placed until expiration. At the bottom there is a price history that updates every 15 minutes until expiry as well.
Start quickly
Three built-in presets: Fast movers, Big swings, and Safe & steady
Ticker Radar
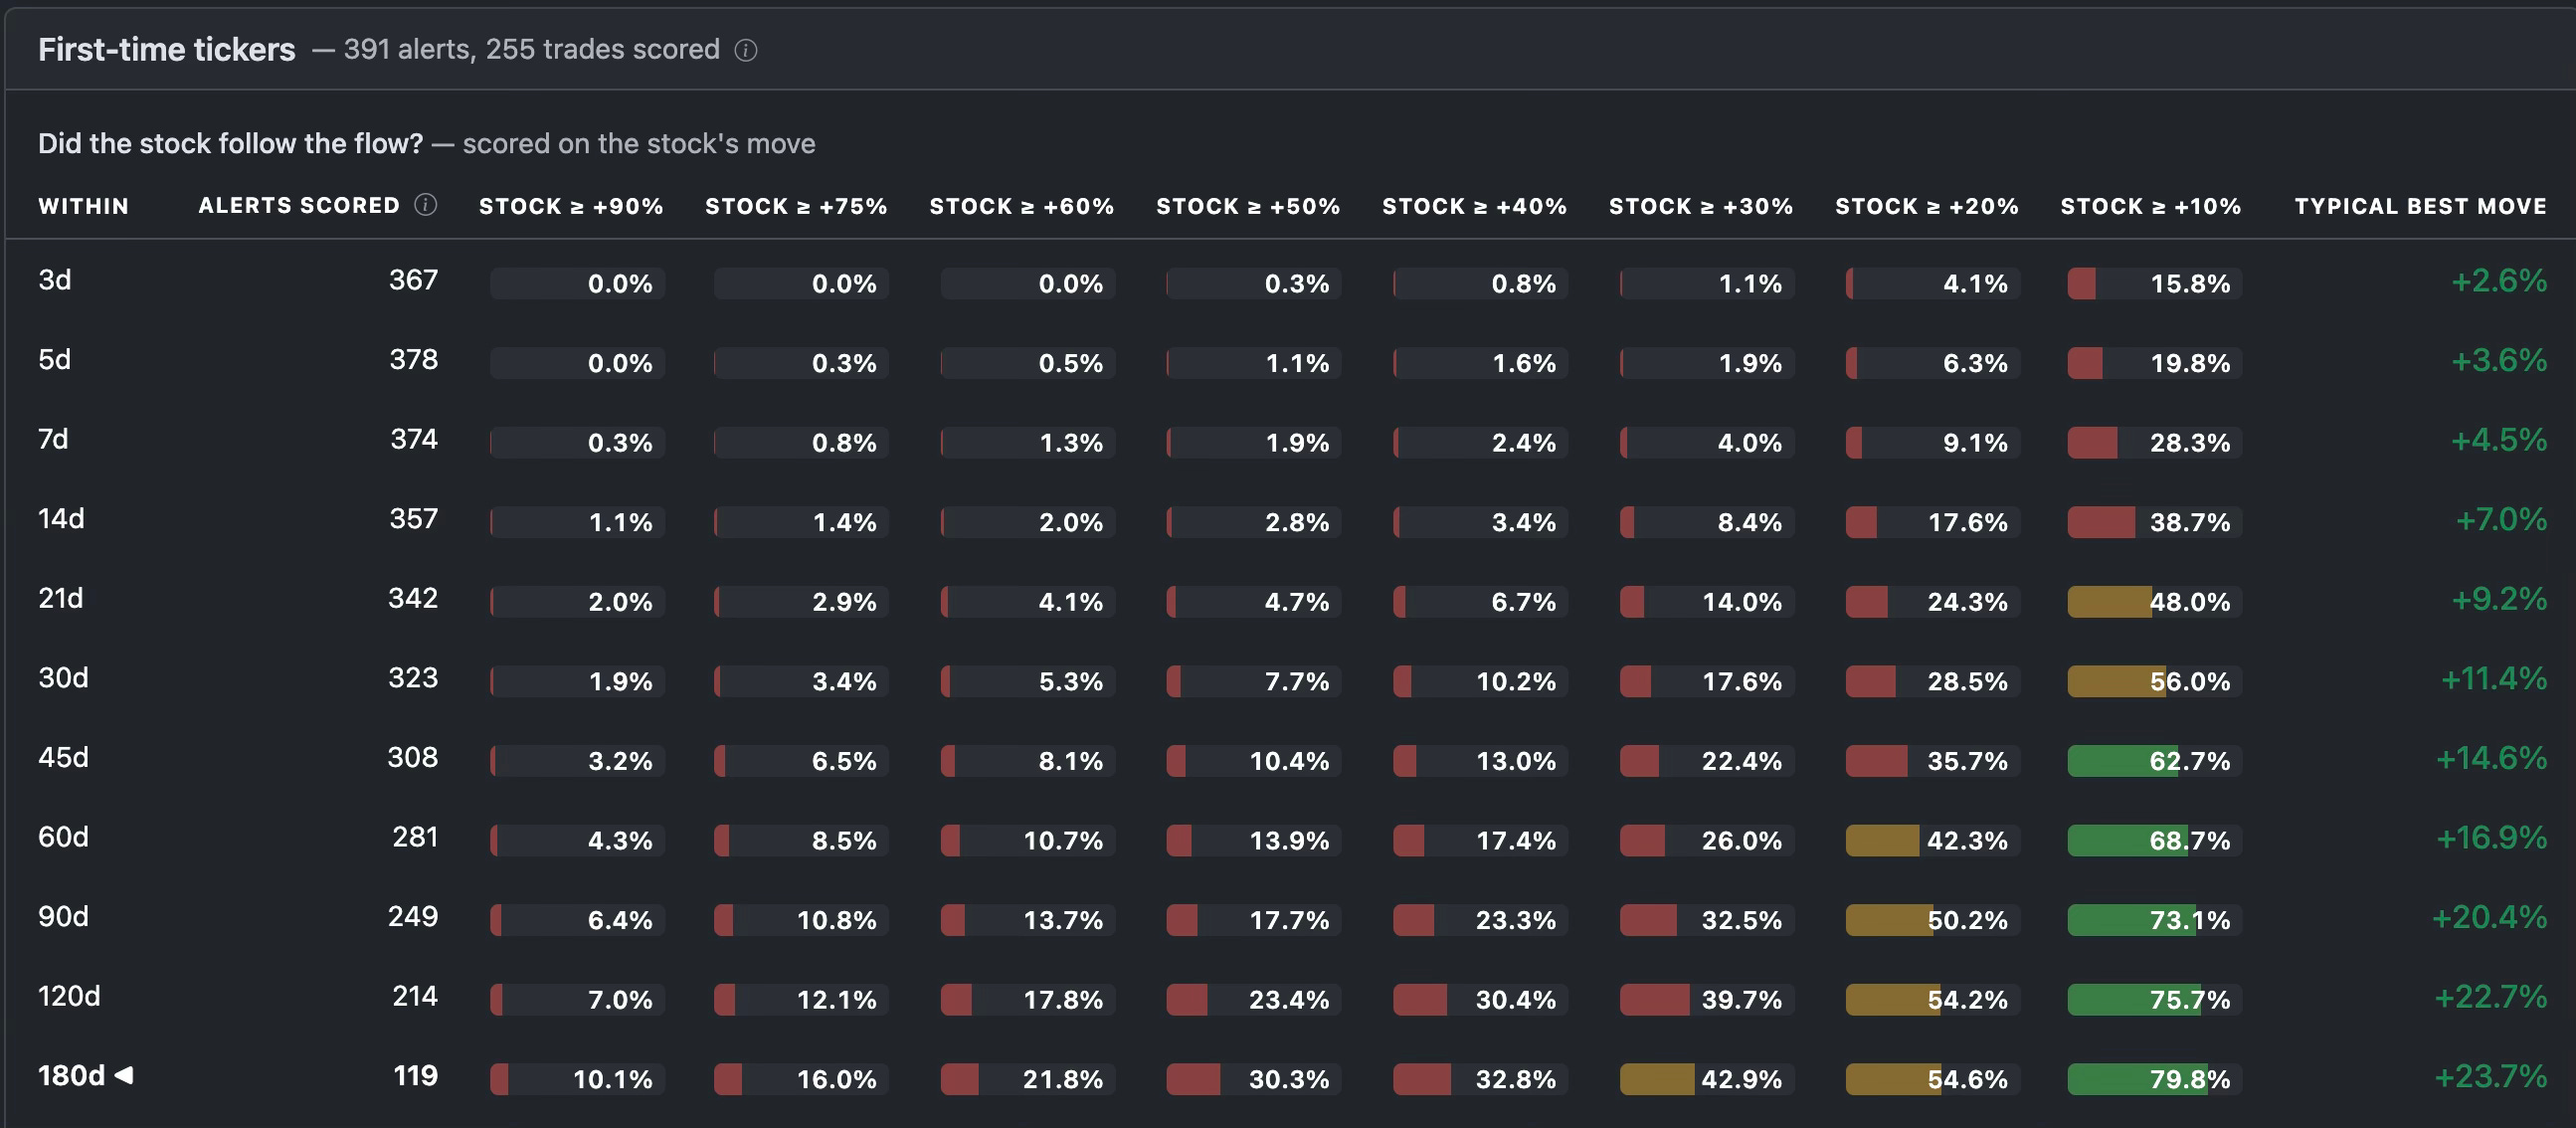
Flags a ticker when institutional flow shows up in it for the first time, or returns after a long quiet stretch. Shows how often the stock then moved the way the flow pointed, how far it went, and how long it took. For instance here you can see novel tickers I log, which are under flow signals everyday, the stock is up +50% or more 30.3% of the time 180. That is huge, not many names rise 50% in 6 months you have a 30% of nailing one simply by buying a novel ticker and holding.
Sort and filter
Click any column heading to sort. Type in the boxes under the headings to narrow the list, for example 300 under Trades to see only combinations with at least 300 trades
What it is best for
Testing an idea before putting money on it.
Finding the expiry and strike distance that have worked best for a setup.
Deciding how long to give a trade, by comparing holding periods.
Seeing which setups have held up when the VIX is high or SPY is falling.
The data behind it
More than 100,000 institutional options trades tracked since April 2023.
About 3,400 tickers covered.
Each trade followed from the day it hit the tape to the day it expired.
Prices checked every 15 minutes during market hours, with over 30 million price readings behind the numbers.
Full details
Every option and setting available in Discover.
Area
Details
Profit targets
+10, 20, 30, 40, 50, 60, 75 and 90%. Risk Reversals and Synthetic Longs use +1, 2, 5, 10 and 20% (default +5%), because they are measured against the capital they put at risk rather than their near-zero cost
Holding periods
3, 5, 7, 14, 21, 30, 45, 60, 90, 120 and 180 days. Weeklies offer 3 or 5 days, and 0DTE is measured to the same day’s close, since those trades expire sooner
Time range
All history, this year, the last 90 or 30 days, or custom dates
Institutional Flow setups
Calls Bought, Puts Bought, Puts Sold, Call Debit Spread, Put Debit Spread, Put Credit Spread
Time to expiry groups
0-30, 30-60, 60-90 and 90+ days at entry
Trade size groups
Premium paid or collected: under $500K, $500K-$1M, $1M-$5M, $5M-$18M, $18M+
Distance from the money
Deep ITM (10%+ in the money), ITM (2-10% in), ATM (within 2%), OTM (2-10% out), Far OTM (10%+ out). Spreads and other multi-leg trades have no single strike, so they are not grouped this way
Market conditions
VIX bands: Very Low (below 13), Low (13-18), Moderate (18-25), Elevated (25-30), Extreme (30+). SPY trend (bullish, neutral, bearish), and SPY above or below its 21-day average. All measured on the day the trade opened
AI Trade Ideas
The newest track, live since 21 July 2026, so its samples are smaller. An “Early results” note shows until a track has about six months of history
Open or finished trades
Results can include live trades, expired ones, or both
Ladder view
Beside the chosen target, each row shows how often the same trades reached the other profit levels
How current it is
Institutional flow appears within minutes of being logged, and AI ideas as soon as they are generated. Ticker Radar alerts are worked out once a day after the close, so a ticker that wakes up at 10am shows that evening
Radar alert log
Each alert shows the date, ticker, direction of the flow, the day’s premium, how many days the ticker had been quiet, and the stock’s best move since
Data scale
Prices checked every 15 minutes during market hours, with over 30 million price readings
Methodology
A plain-English FAQ at app.jamesbulltard.com/discover/faq explains how each number is calculated
Good to know
How a hit is counted: a trade counts as a hit when its value reached the target at any point during the holding period, even if it gave some back later. The gain still had to be sold to be captured.
New trades are never counted as losses: a trade only enters the percentages once its holding period has passed. Until then it is counted as tracked, not scored.
The numbers lean conservative: prices are read every 15 minutes, so a brief spike between readings is not counted. Where there is a choice, the published figure is the lower one.
Gains follow the institution’s trade: percentages are measured from the institution’s own entry price and time. A subscriber who follows later will get a slightly different price.
What the numbers mean: Discover reports what has happened. It does not predict what will happen, and it is not financial advice.
Not available yet: there is no export of results and no notifications or alerts. Subscribers check the page directly. We would need logins to do that and just don’t want to take this there at the moment.
Step one was getting this out to you today, I want you to use the tool and give your feedback on what more you want from this. I told you part of my vision which should be live in a few days is automatically assigning a probability to every new trade logged into the database based on historical data I have. That is where the magic happens when we can apply this to new trades and give you probabilities. It is done, we’re just testing it at the moment making sure there are no bugs upon release. I would expect it to be live within a week or so. Again we have alot of things in mind we plan on building around this new tool, the launch today is just simply the first step.
I will not be sending a recap today as I don’t want to bother you all with 2 emails so here is the weekend link to the database, it will be up until monday morning. You’ll notice it is the live link with the live tape today on the daily chart page. So today during the session you can open the live tape and watch as the live flow comes in. For any of you on the fence about the live tier, that is just one of the perks so you can have the live data without needing to utilize the community discord or others like to have it up alongside the chat so they don’t need to flip channels inside the discord.
Lastly, as I said earlier this week, tonight at midnight eastern time I’M RAISING THE PRICE FOR ALL NEW USERS, none of you existing users will ever pay more than you agreed to when you joined. However, if you’re on the fence or on a free trial, these are the final few hours I offer the recaps at the current rates. One thing with me is you’re constantly going to get new tools and features because my team is always tweaking this but you will never see a price hike as long as you’re subscribed. This is my first hike in 3+ years, you’ve seen the changes. New users in the future will eat the costs of all the updates. Have a great weekend, I will see you monday. Leave me a comment here or I created a channel called feedback in the discord if you find any bugs. You may have better ideas for us and where to go from here with this data but I’m open to hearing them all and really read every email.
Thank you! Amazing to see all the improvements.
Have you thought of exposing an api or mcp? I’d love to bring this data directly to my agent