

One of the things I promised you two weeks ago when we launched the discover tab was it would be a long term work in progress adding all my desired functionality to it. Being the first of its kind tool out there getting it right isn’t easy because we have no basis to work off of. It’s one thing to have options data, many do, and it is a whole different thing to make it function in harmony delivering data in a dynamic matter. Today we’re releasing the first update which lets you apply the data in the discover tool to every new incoming trade to see which setups worked the best. For now we’re focusing only on the highest probability trades based on historical data and we will eventually roll out the ability for you to filter however you would like based on various timeframes, setups, etc. For those of you in the live with the live tape on your database we have some even more special stuff to roll out to you in the near future but for now this is for everyone and it’s a game changer.
Daily Chart: two new signals, live for all users
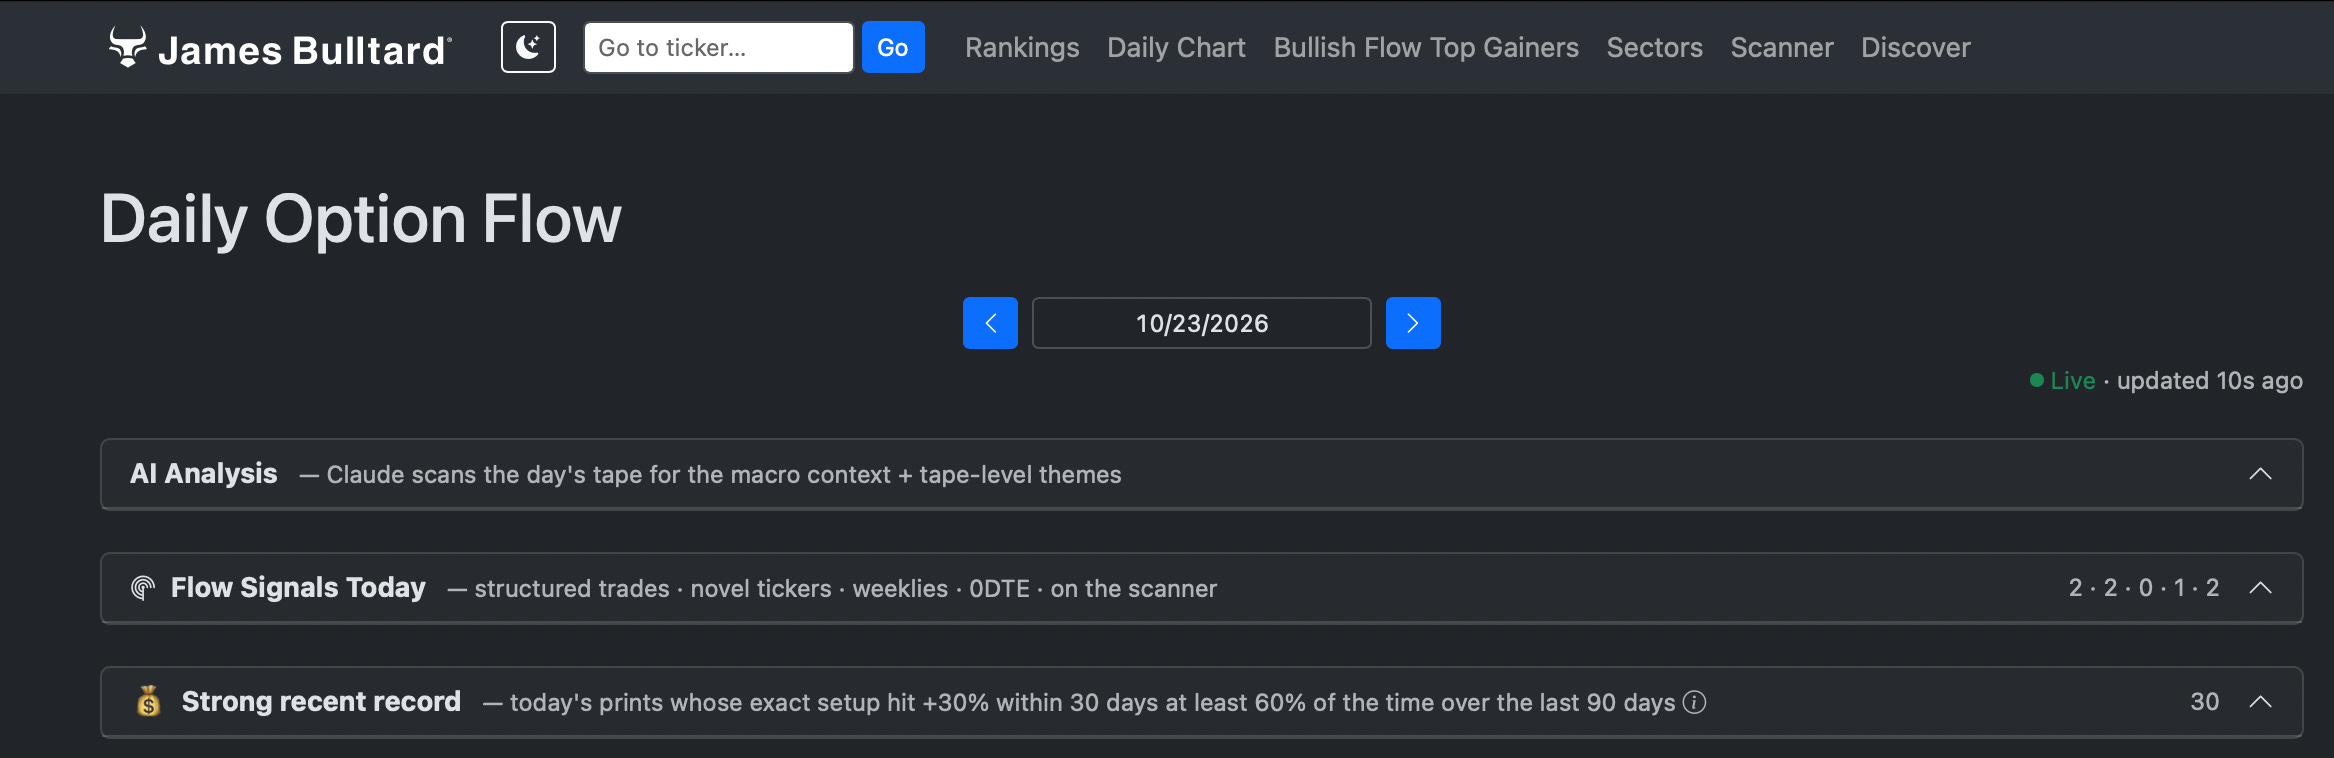
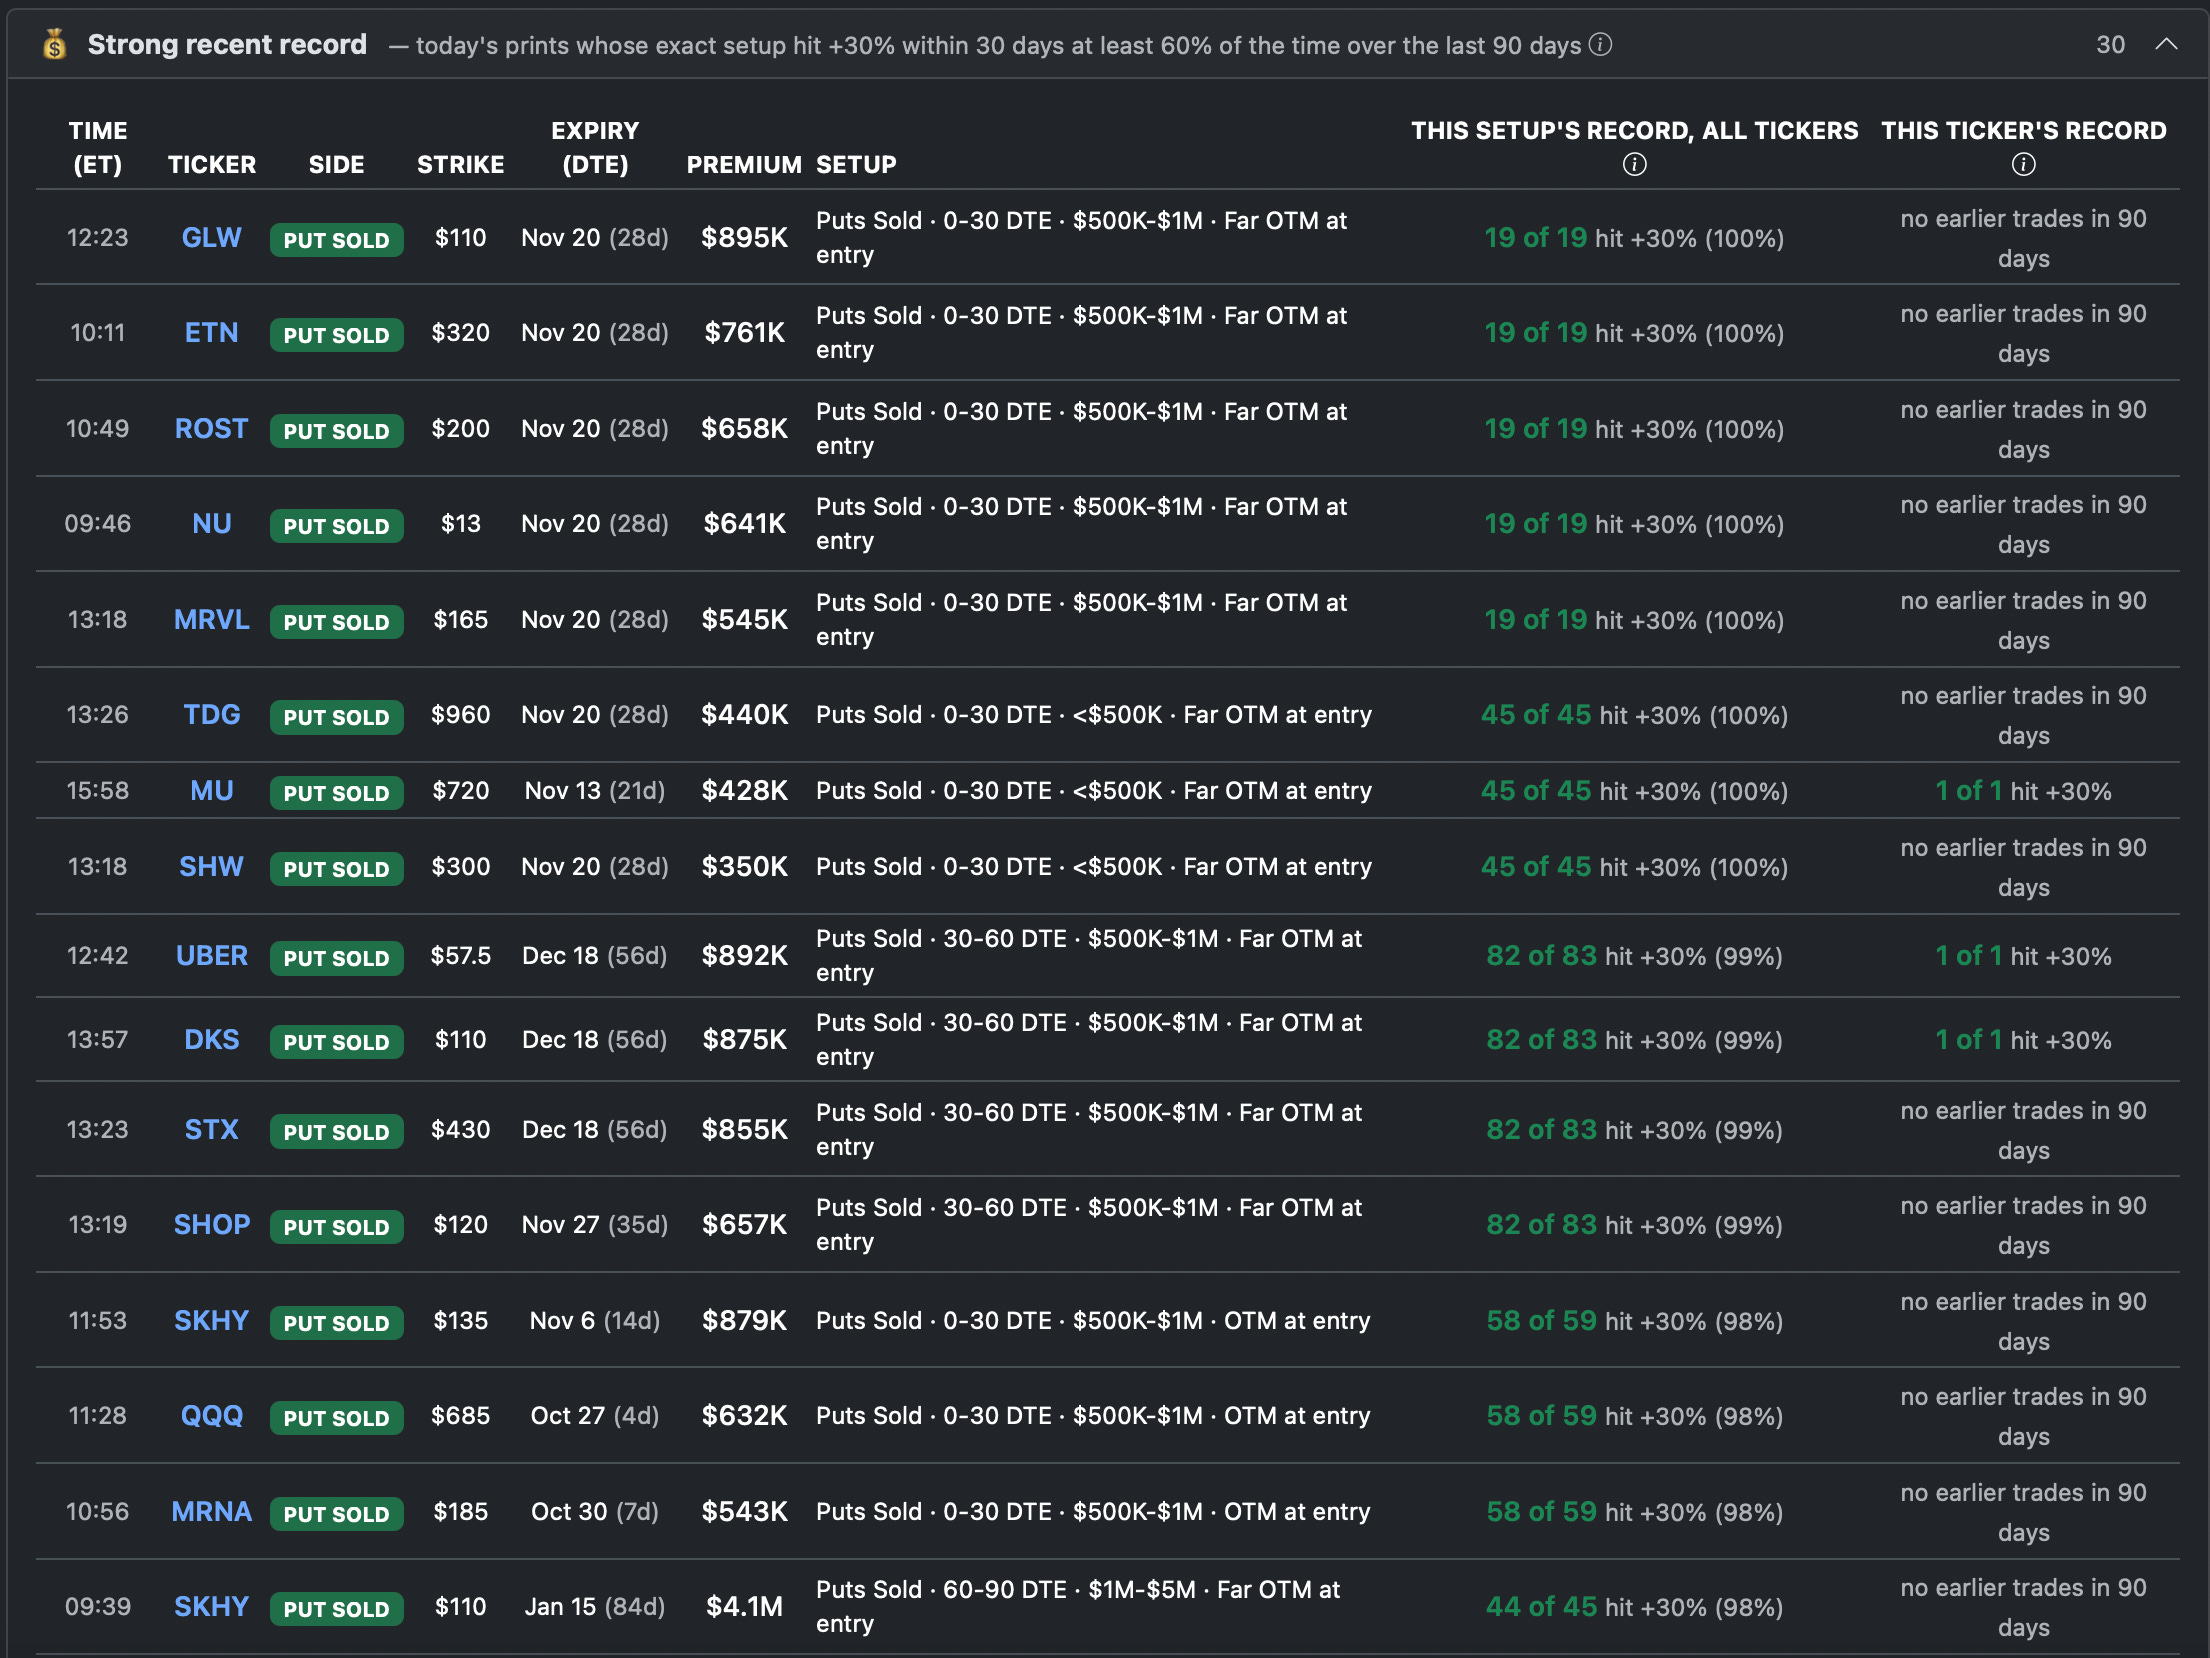
Strong recent record - a new card under Flow Signals Today.
Every print on the day’s tape is filed the way Discover files it (setup · days to expiry · premium size · how far the strike was from the stock). If that exact setup has hit +30% within 30 days at least 60% of the time over the last 90 days, the print is listed, with the setup’s record (”24 of 24 hit +30%”) and the ticker’s own record in that setup beside it. Click a setup to see the trades behind it; click the ticker’s count to see that ticker’s.
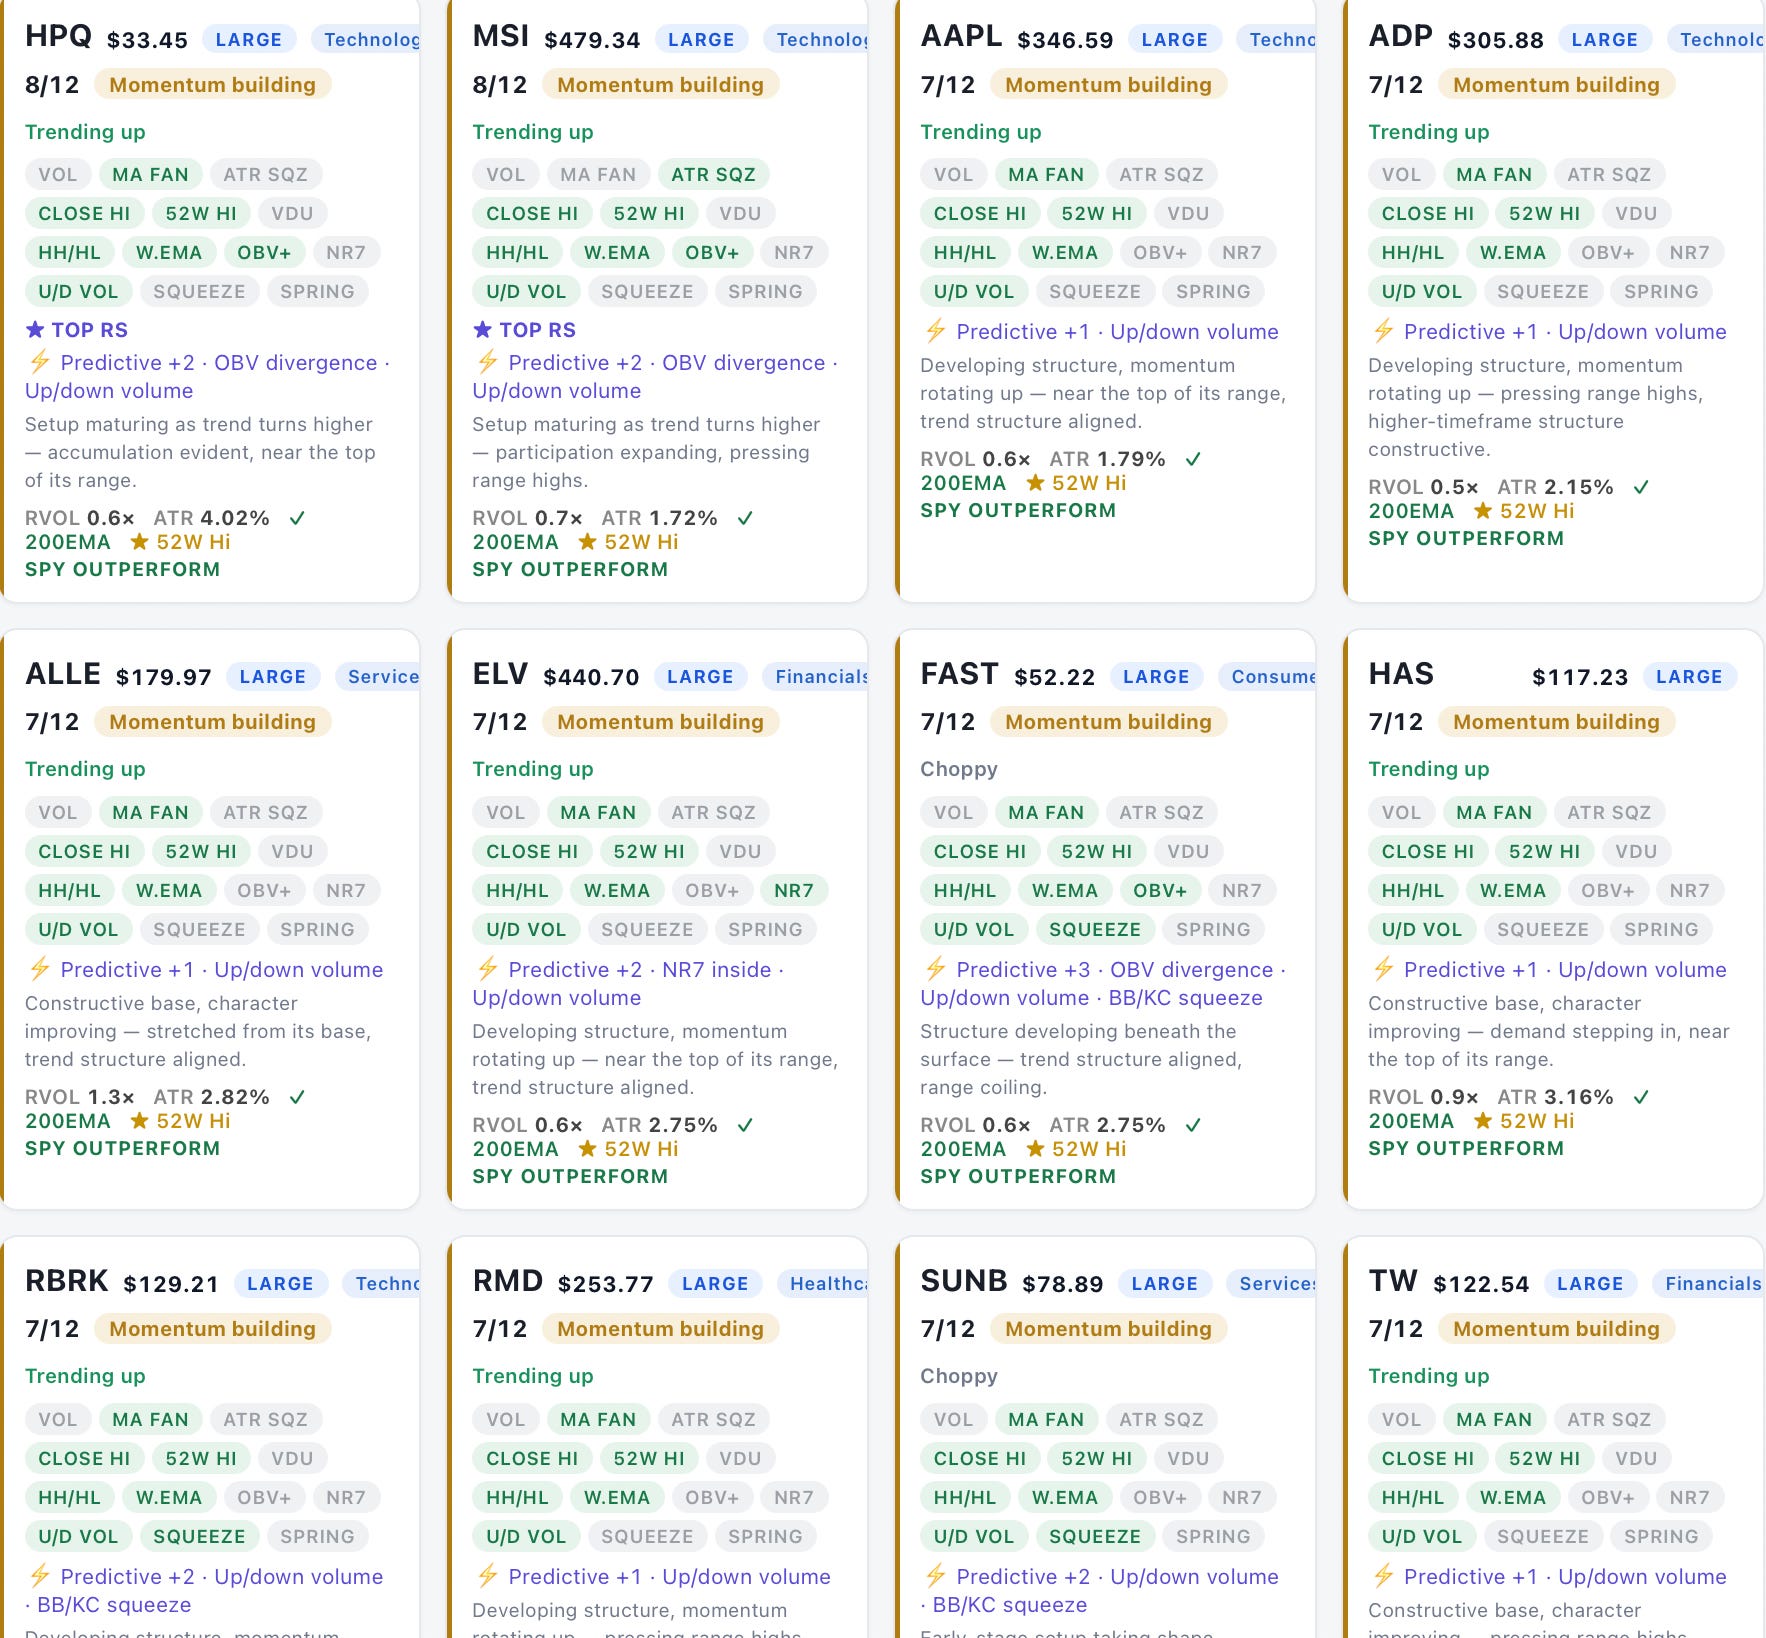
Also on the Scanner today - inside Flow Signals Today. Tickers that appeared in the scanner’s ratings section today and also had institutional flow, with the scanner’s rating, score and rank and the day’s prints on each. Two independent signals agreeing on one name.

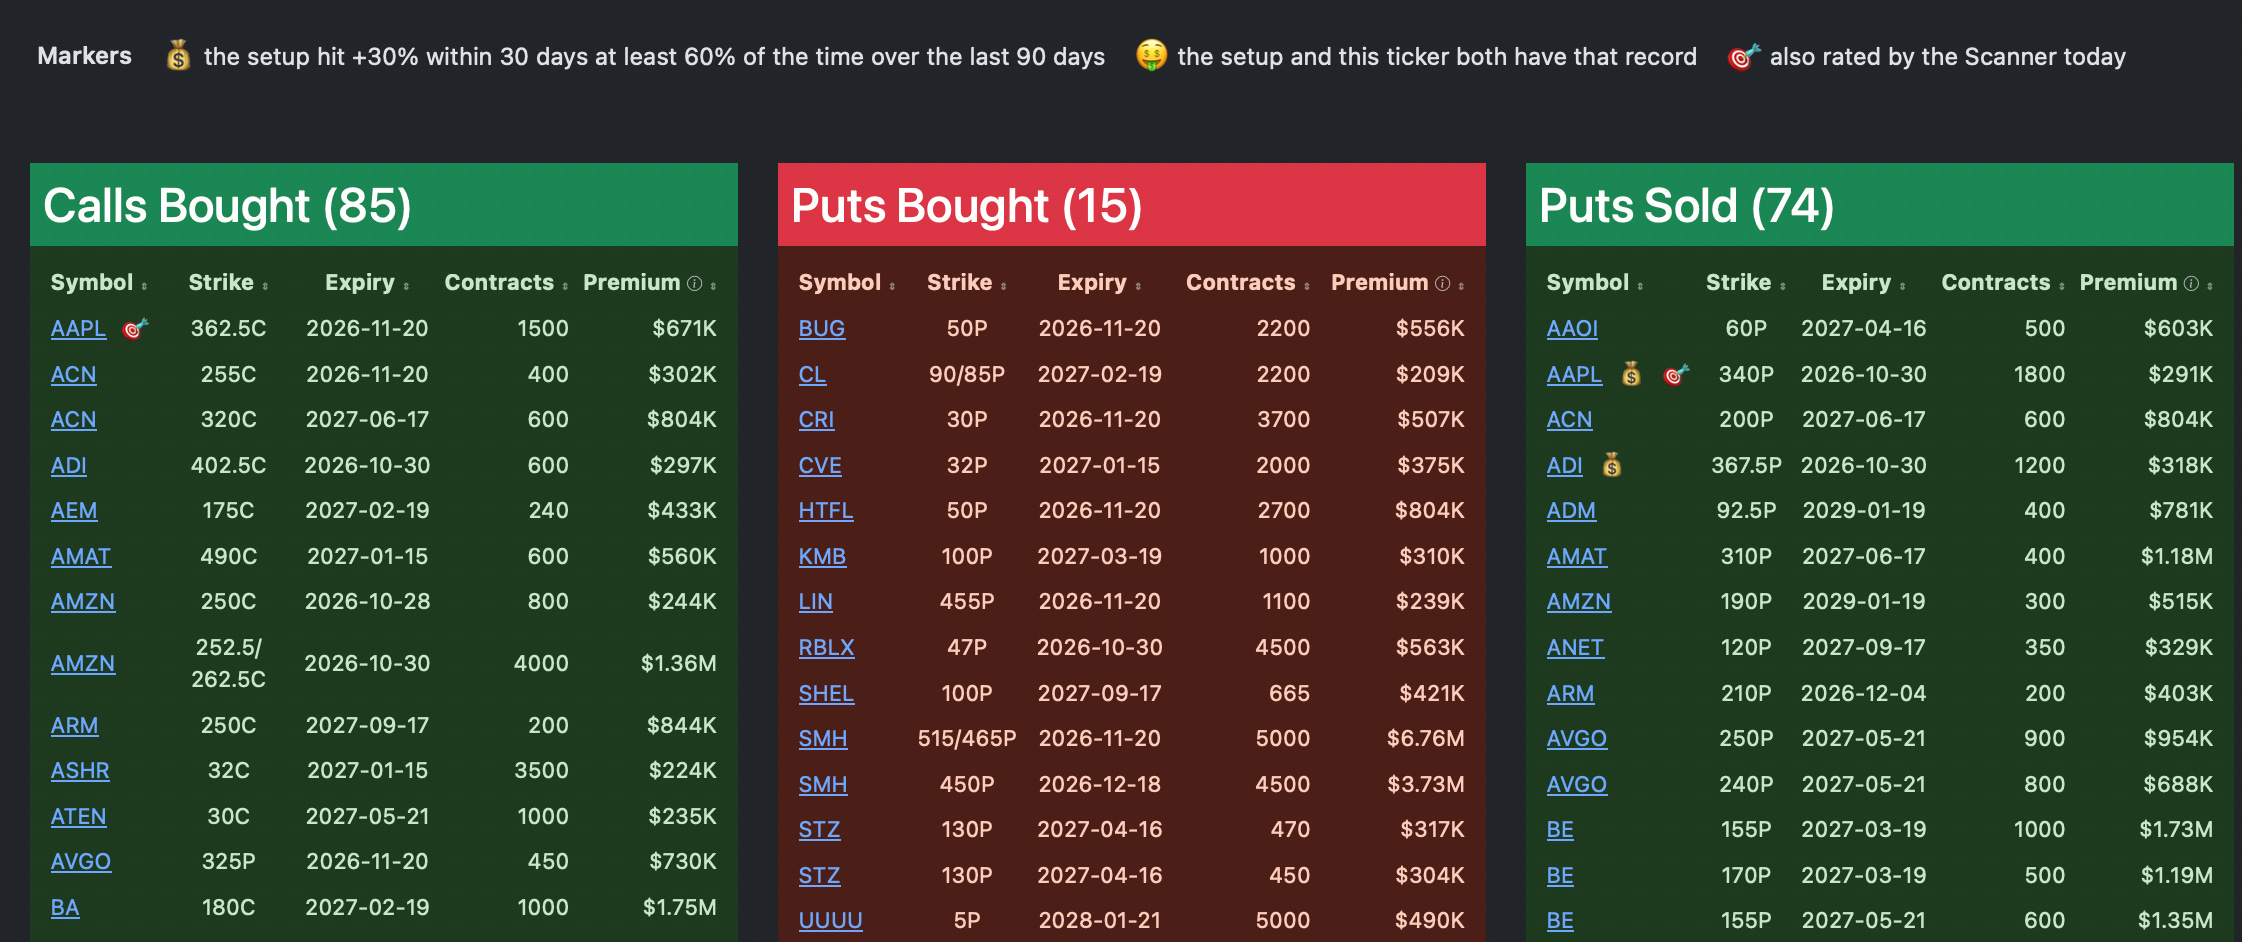
Markers in the three columns - so you can spot these without scrolling by looking for the emojis as marked in the image below:
• the print’s setup has the record above is the bag of money emoji
• the setup AND this ticker both have it is the money face emoji
• the scanner rated the ticker today is the bullseye emoji
A legend sits above the columns. How to read the record: “+30%” is the trade’s best moment inside the window, not where it finished. For a sold put it means the put is worth 30% less than it was sold for at some point. These are past results over the last 90 days, not predictions, and a ticker’s own count is usually a handful of trades. Trade at your own risk.
You can see AAPL and RBRK on the scanner friday below.
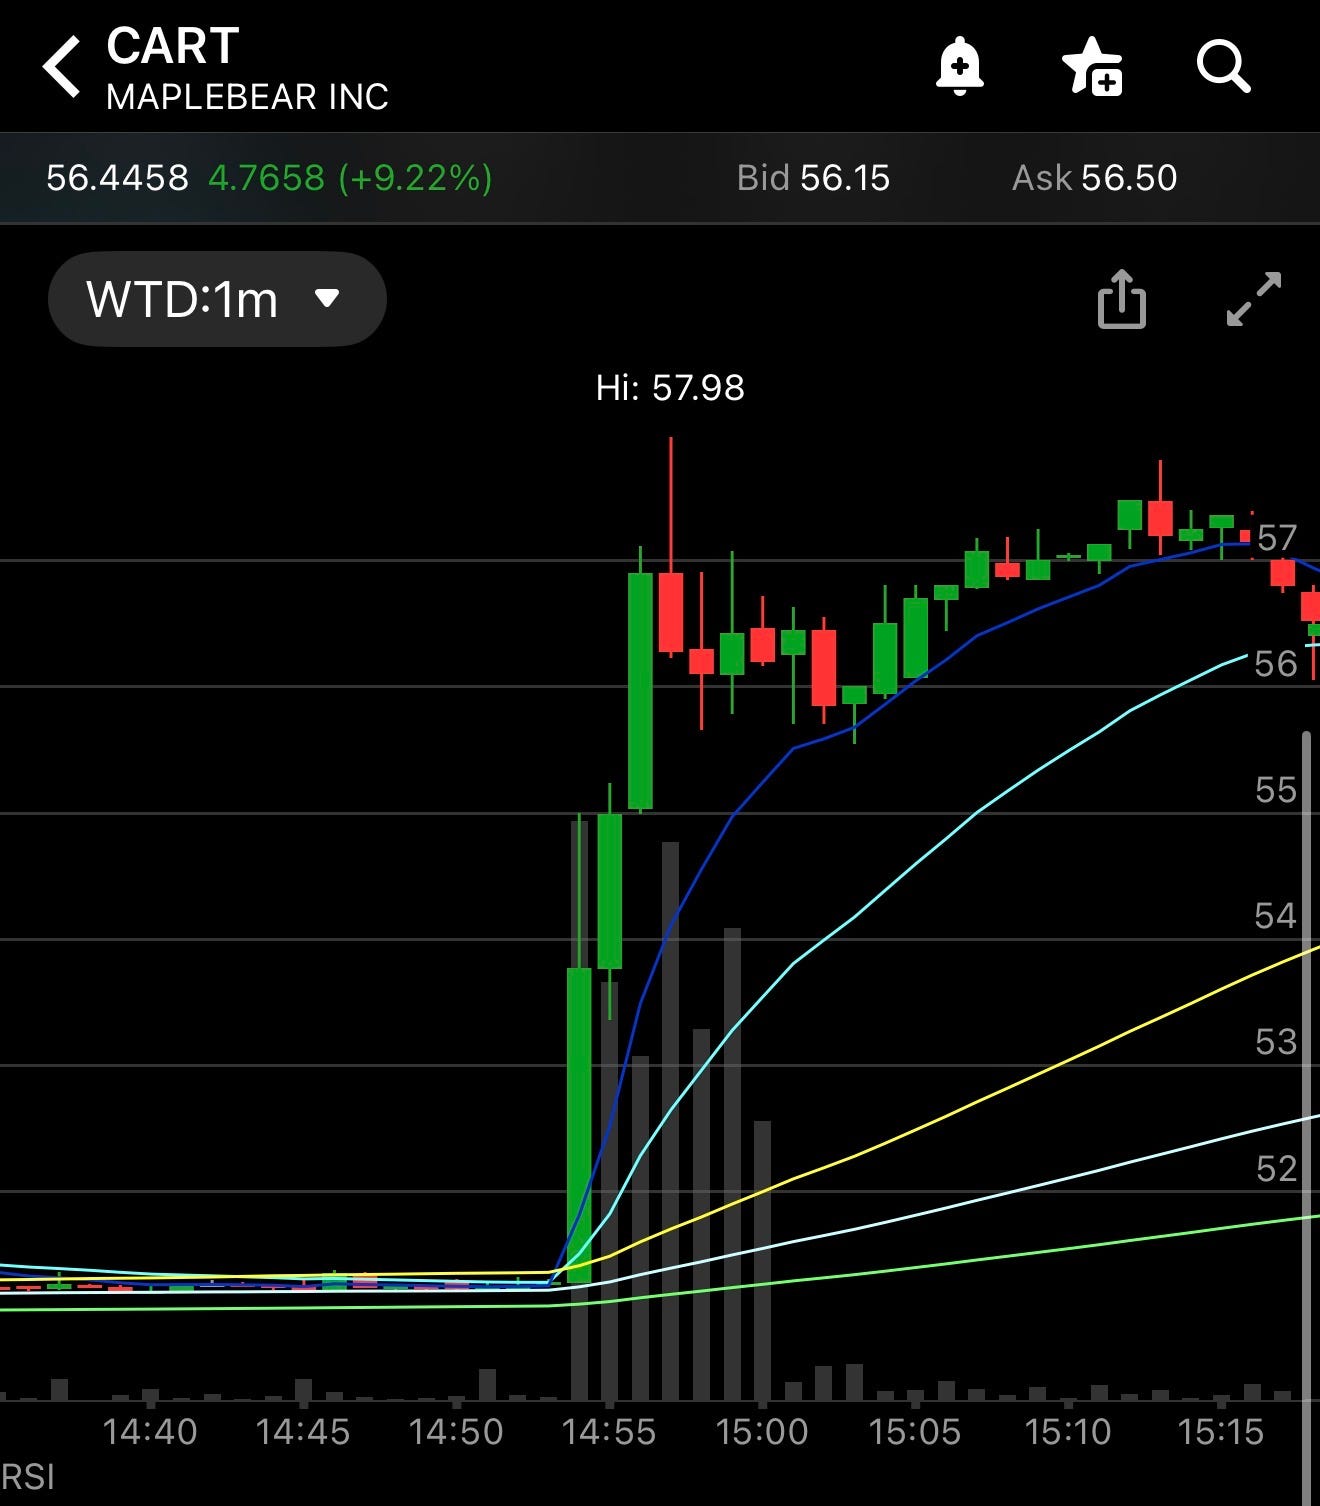
Again this was the first of many updates we’re going to release with this data. If you have other ideas I’m always up for hearing what you want to see but the overall focus is here is looking for unusual data and trying to improve how we guess what to play as best as possible. Did any of you catch that CART trade I logged 15 minutes before the close yesterday?

Within minutes of that trade, Instacart announced they were seeking a buyout and popped over 10%. Literally one of the most egregious trades I’ve ever seen. How do I better highlight stuff like this in the future? I don’t know but this game is always trying new things and figuring out how to improve your process.
Have a great weekend and I will see you monday