
How To Get The Most Out Of All This Data

Since there was no market today, I figured I’d send out a blurb on the question I get most, how do I utilize all this data?
The answer is, there isn’t an answer. There is no right way to use this data, the data is the data. I am simply organzing all the most unusual options activity within a session and giving it to you in an organized manner. It’s not like I have access to a simple list of all the days trades. There are millions of trades placed daily, I use my scanner to filter through them with my parameters to find what I consider the most “notable” trades of the day. It could be 500 calls bought in a name with no volume or it could be 30,000 calls in a name we see calls in daily. Unusual activity doesn’t even have a set definition as what’s unusual in a name like like Draftkings may be fairly normal activity in a name like Apple. $1m trade on Draftkings would hold far more weight than a $1m trade on Apple which happens thousands of times in just 1 day.
With that said let me explain how I’d look at the daily recaps.
Trends - every recap starts with “trends” and I post multiple timeframes that are usually week to date, 1 week, 2 week, 1 month, and 2 month from time to time. What is this? This is a net score of the unusual activity within my database. In this case this was from friday’s recap. Obviously the larger names will naturally have more trades, you have to look for the smaller ones. In this case, take CCJ. This has been popping up here for weeks and look at the powerful move it’s had. This past week it had 5 unusual trades and all 5 were bullish as you can see below.
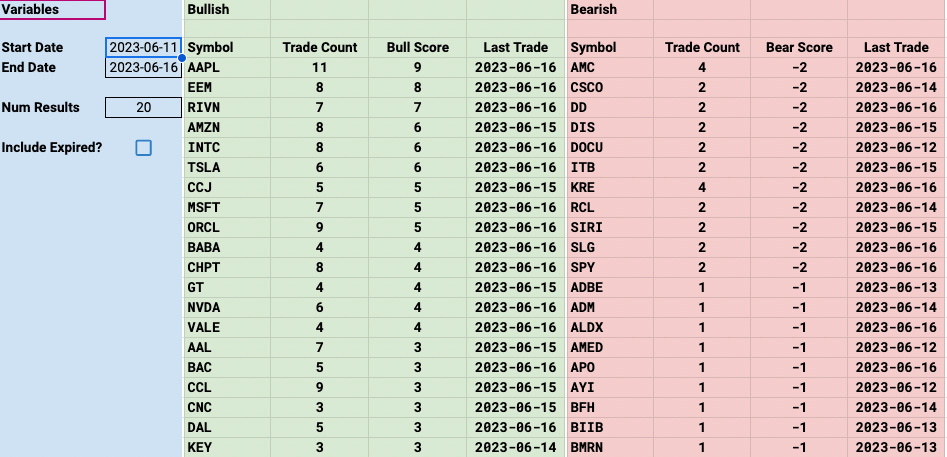
A name like Oracle you can see had 9 trades and a bull score of 5, that means there were 9 total trades and the net was 5 so in this case 7 were bullish and 2 were bearish. Anyhow, those 5 trades on CCJ within the week, you should be able to open all 5 recaps and see what those 5 trades were all week. This is where the work on your end comes in. Many in here have built a similar Google sheet to what I use and they input all the data the same way I do just so they can have their own searchable database. Obviously I’d love to share this with you, but I can’t have 1500+ people crawling a Google sheet, it wouldn’t function. Now, if you dont’ want to build your own spreadsheet, you can do it the old fashioned way I did for many years, pen and paper. Jot down what you’re seeing, in this case here is CCJ and what I saw this week
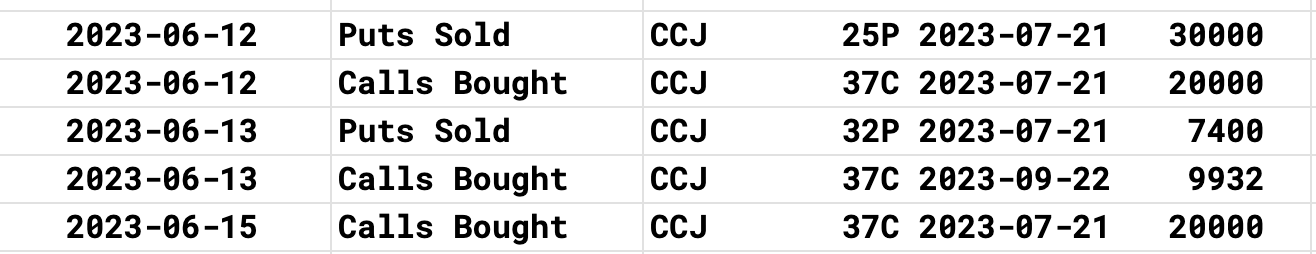
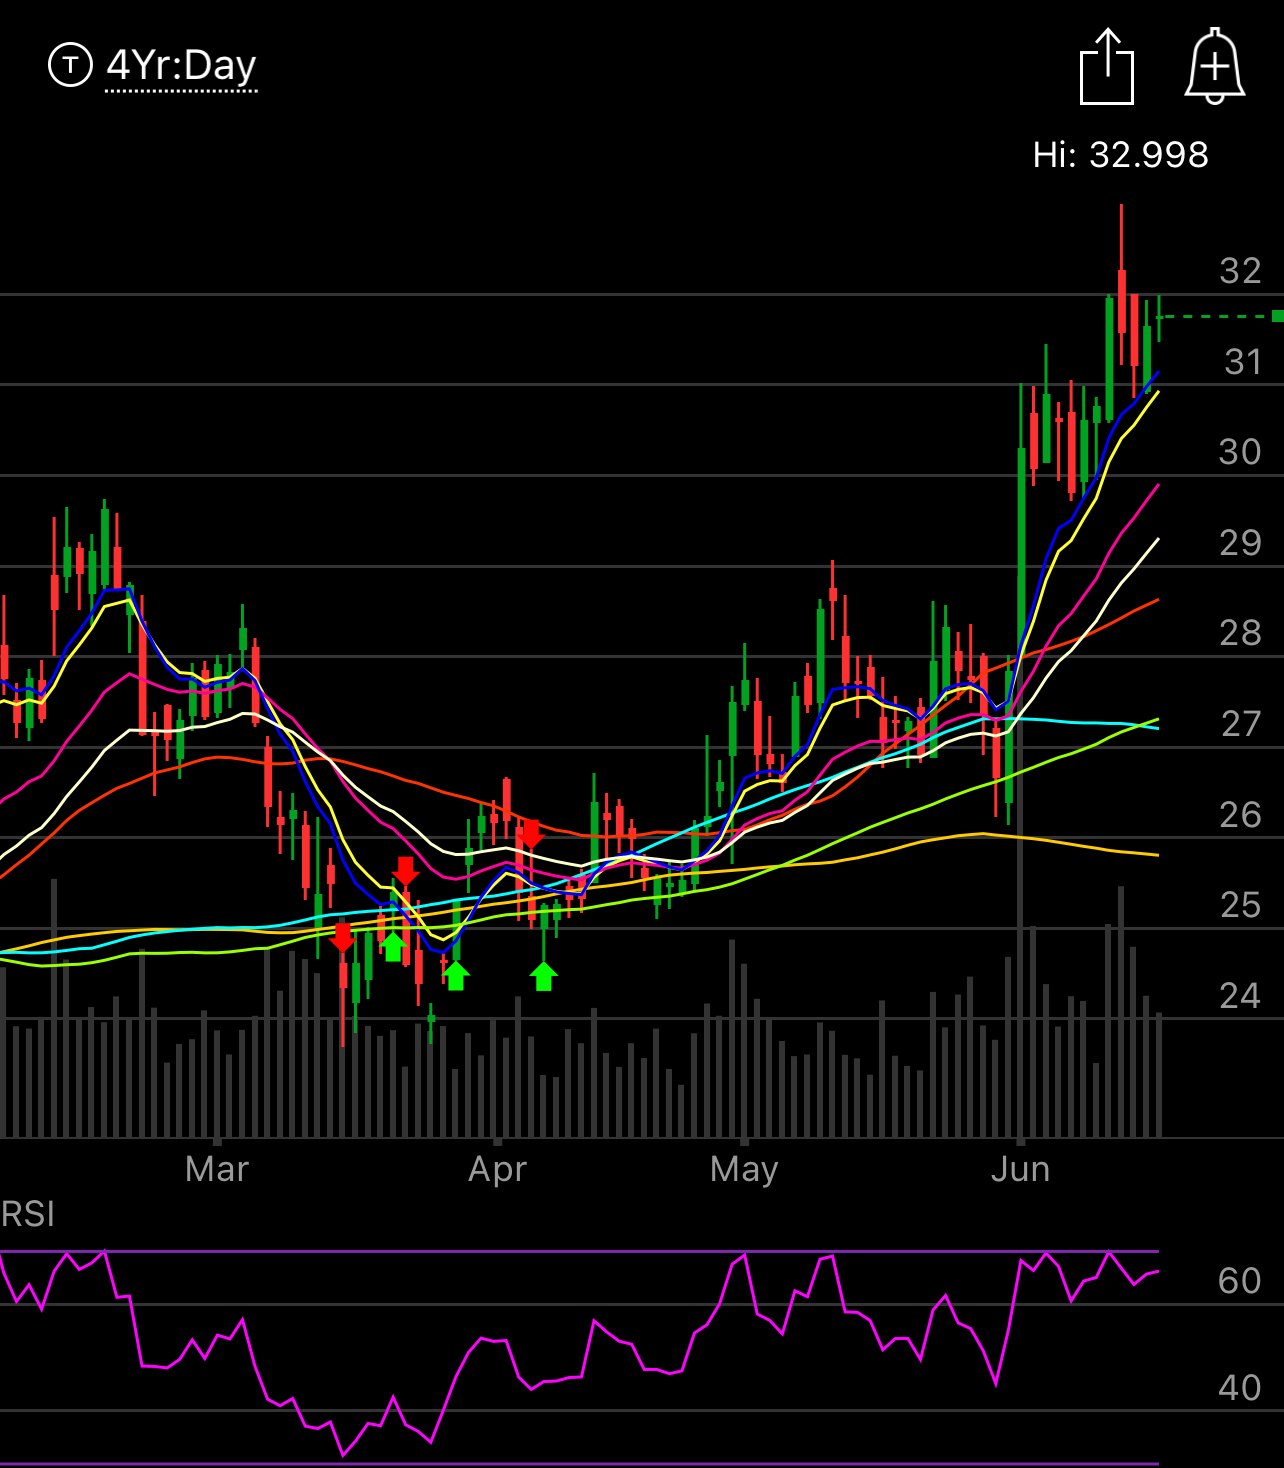
So there were 2 large put sales at $25 in July and $32 in July. I now have a reference point to where 2 institutions wanted to take shares. The calls bought are nice, but as a put seller, I look for levels of demand and then I look to build my positions around those. Next, I pull up charts, I like to look at the daily and weekly to look for levels where I would like sell puts at. Are there gaps below? Where are key support levels?

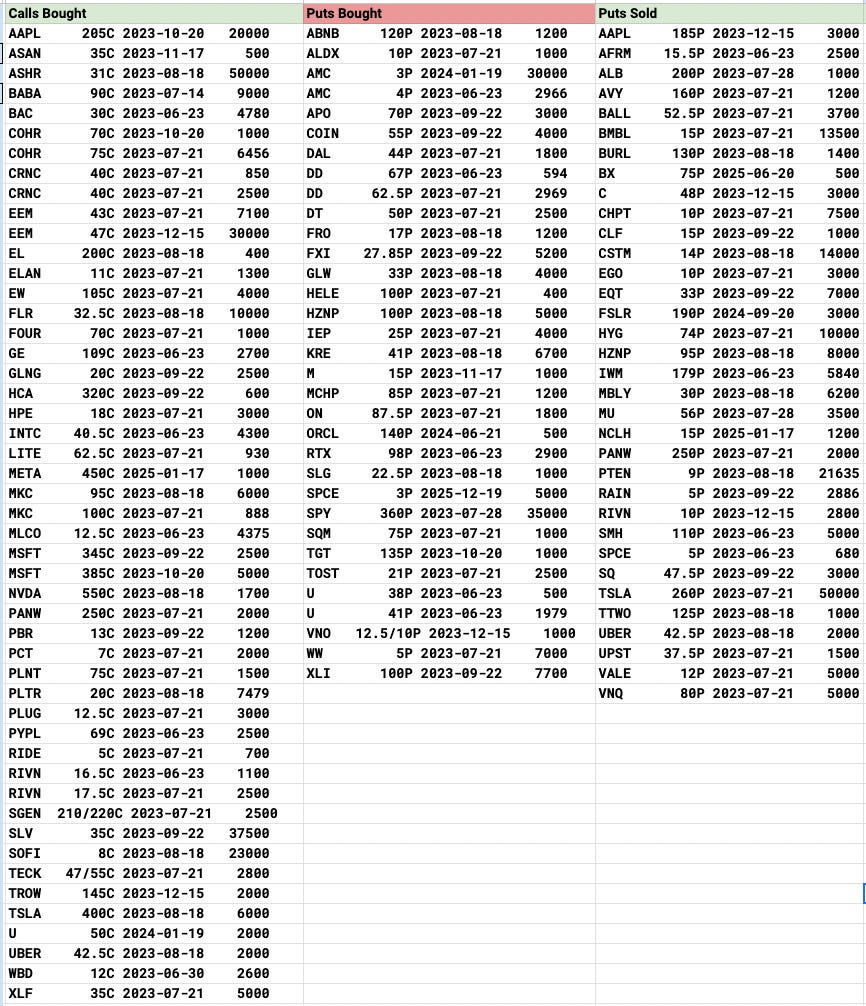
Many questions to look at before I decide to take a trade, I then jot down all the notes on this particular name and I look at the next potential name of interest. The discovery process starts with the trends section because that is where the names that saw repeated flows in a given week show up. That’s not where it ends though. I have to look at the daily table I post. Why? Because sometimes you’re going to have obscure names that won’t trade much and won’t be in the trends OR you may have a really unusual trade and it was a 1 time thing like that day someone bought those 100,000 calls on BVN or the odd lot of $140 TTD calls this week. Those happenened 1 time and will only be in the table. So the table below is from friday, I go through this, and the ones that interest me, I also jot them down on a piece of paper, and then do my homework again, looking through all the charts and option flows on that name.
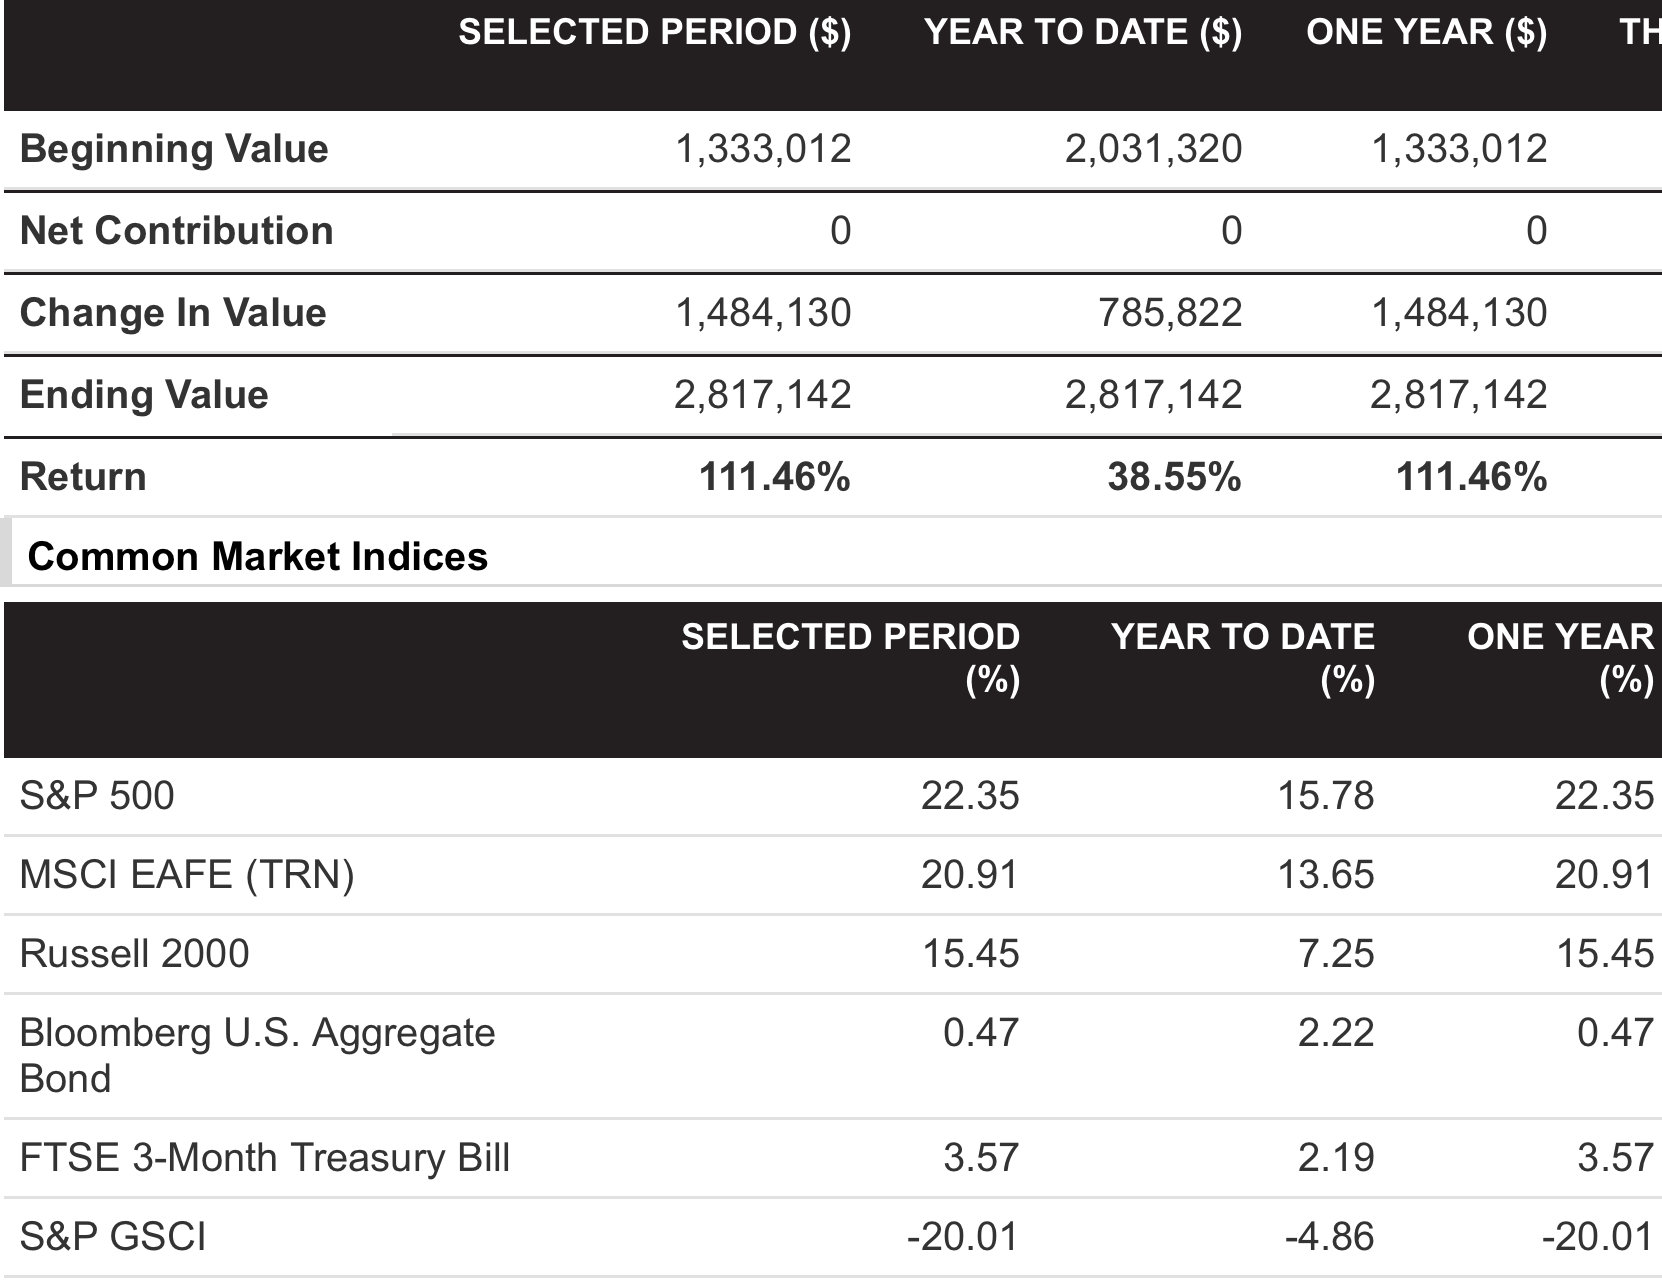
As you can gather by now, the amount of time I spend during the market hours putting all this data together everyday pales in comparison to the amount of time I spend outside market hours actually studying and making notes with this data after hours. Hence why I said I’m taking a break for a few months, this is an exhausting job doing this. Pulling all the data together during market hours is one thing, logging it into the database is another thing, but actually breaking down the data to figure out the positions I want to put on the following day is a whole extra layer of work and I probably spend I would 10 hours/day on market stuff in normal times like say 2-3 weeks back when I was managing 30-40 positions at a time. It takes a lot of work to succeed at this, but, this is my own process, I don’t know anyone else who does this. Maybe I’m nuts? I dont know nobody tracks option flows in this manner and models trends as far as I know. I’ve been writing this substack for a year tracking everything I do to show what is possible through this method and to this point, many of you have been here this entire time, I’m now up 111.46% in the last year vs the S&P up 22.3%.
Beating the market by 5x in a year, on a large trading book is not easy. It takes a lot of discipline and a lot of crazy positioning BUT the confidence to take that positioning comes from my data and how much time I spend studying and interpreting it. I’m a student of the game. It takes ALOT of work and I get why so many unsubscribed the last 3 weeks when I stopped trading everyday and said they will come back when I get active again, they just wanted to copy my book. That’s fine, but I’m here trying to teach you a process of how to find your own trades, execute your own trades and be a better trader using data as I organize it for you. Some of you find and take trades that I don’t, and I love hearing it because you’re growing as a trader and that is the whole purpose here. It isn’t to just copy me. If you do that, you’re cheating yourself.
I hope this post cleared up some of the questions many of you had. You’re all here because you’re ambitious people. You want to outperform, otherwise you’d buy the index and call it a day. Some of you want to generate income selling puts, others want to sell covered calls, whatever it is, the data I provide can help you accomplish those goals. The bottom line is if you want to outperform at this game, it takes time, anyone who tells you it is easy is lying. I share my notes with you daily to make the process easier, but yes, there is still work required on your end if you want to accomplish your goals.
Also, when I write these long posts, I don’t edit, I dont proofread, it already takes me time to write these. I wish substack had spellcheck, but they don’t. So if there are grammatical errors ever, forgive me. I just go with the flow and when I’m done I’m done, I’m more about the message being sent than the little details.
Thank you for all the great work! May I know how do you source the option flow data? Did you subscribe to other options data service or use a Bloomberg terminal?
Thanks for this post, James. I have more time now in my life so I really want to dig deeper in your unusual flow data and find the hidden gems myself. Btw maybe Safari has some spellchecker built in? I dont use Mac but maybe something like this? https://support.apple.com/guide/mac-help/check-spelling-and-grammar-on-mac-mchlp2299/mac Thanks again for your work and enjoy your time out :)