My Best Trade This Week Offers a 9% Return on $1.82 of Risk
H
I went through alot of charts this weekend and I have a couple bearish ones to share with you for those looking to balance their book and I have one fantastic trade at the bottom of a major support level that could net you 9% or more in 4 sessions, that of course depends on how /NQ futures open with the Tesla “miss” that we got yesterday.
Let’s start with the bearish charts I’m seeing
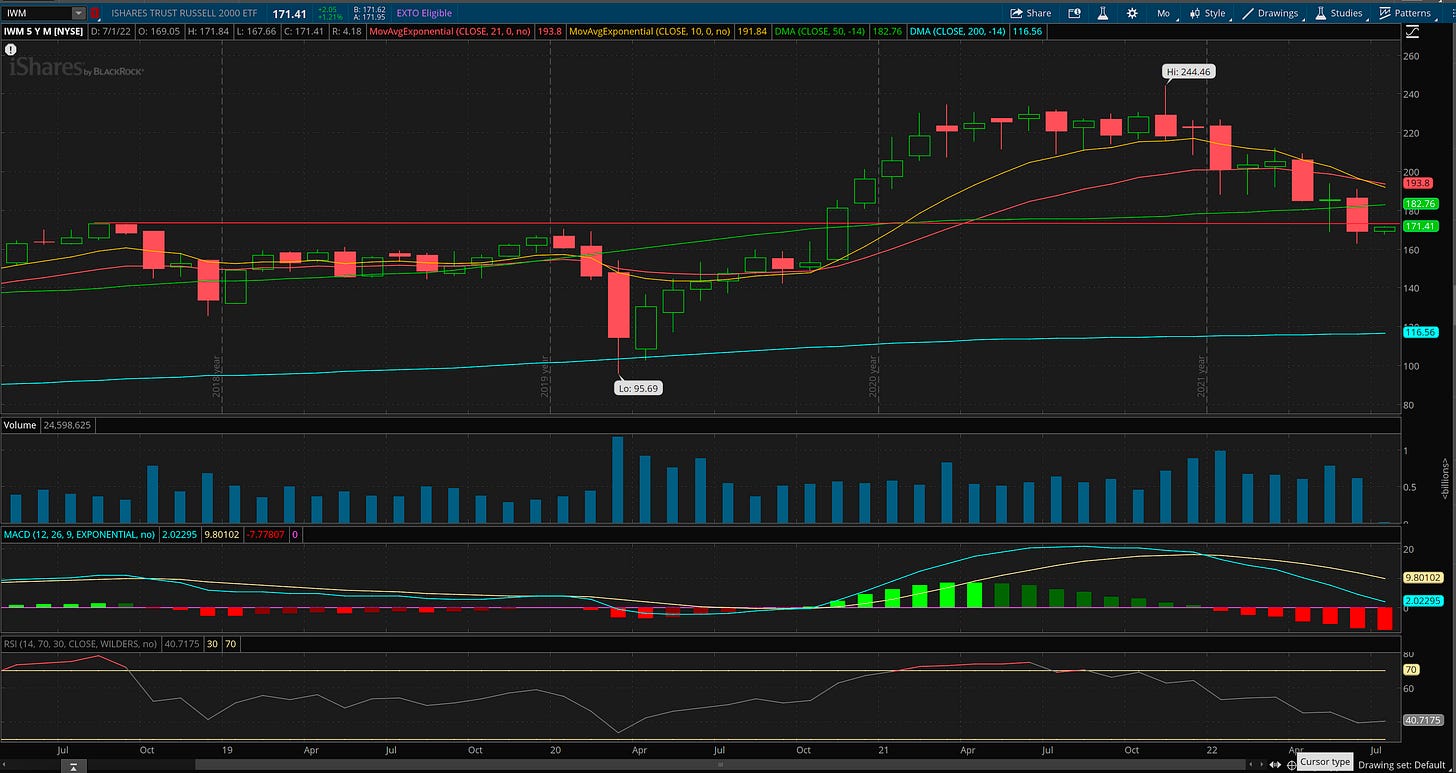
This is the IWM the small cap ETF, what you will notice is this past week we finally broke down below the pre covid highs and what you will notice again is that the weekly candle never even made a push at going over that line, very weak action from the IWM and it appears to be a short until it can reclaim that level. First big close under that in yeasr, that is not bullish, so be careful with your small caps. Yes, you can sell puts lower, just pointing out the strength you saw in 2021 is likely not returning for some time.
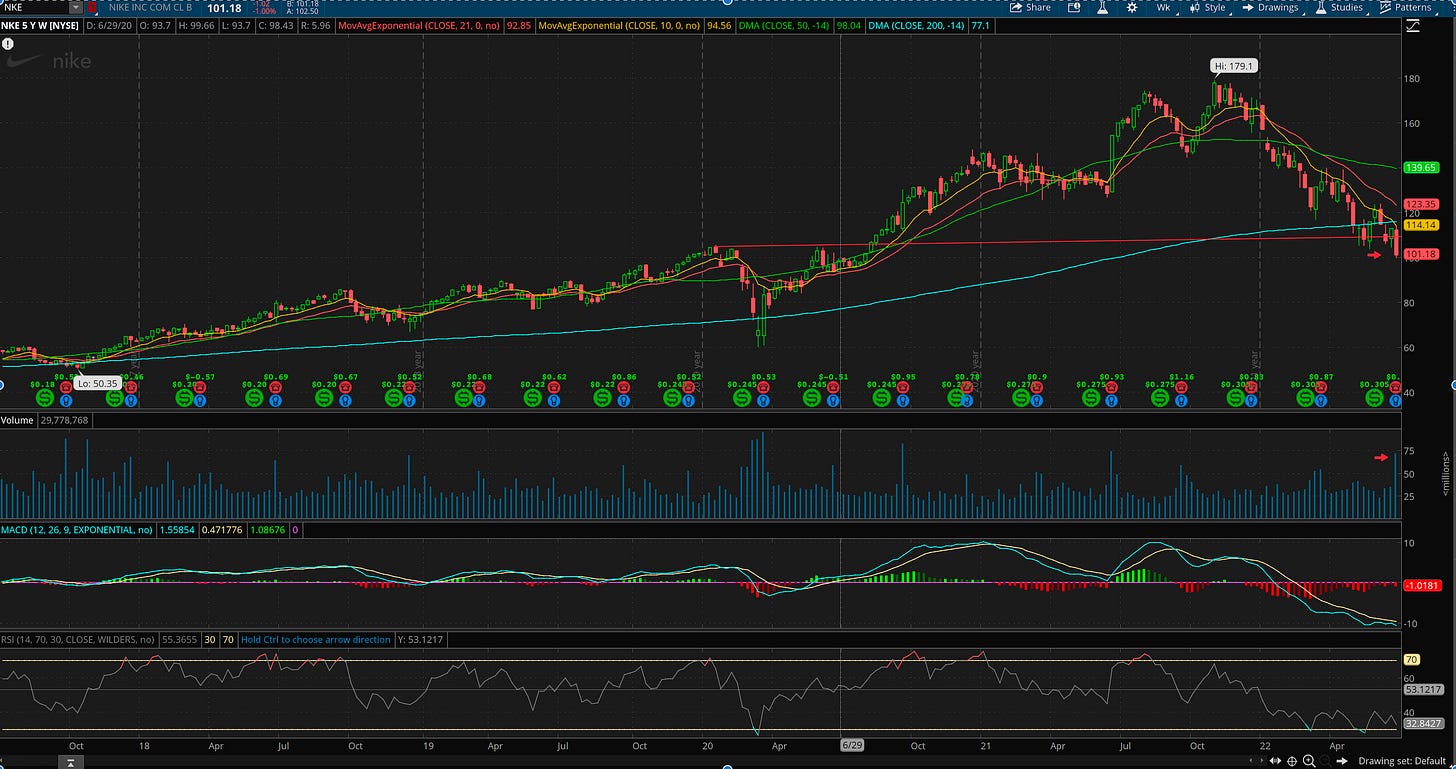
The next bearish chart that stood out to me was Nike, as you can see below, it broke below the covid highs decisively. Look at the arrows I drew, one at the breakdown and one on the volume. Breaking down on heavy volume is not something you want to see. Nike looks to be a short until it reclaims the $109 level. The premiums on nike aren’t too great but I will look to sell call spreads higher than that $109 level maybe a week or 2 out.
Now let’s get to the good stuff, my best trade for this week.
This week Im going to go with selling a put spread on META, but BELOW the bottom of its current downtrend. I am going with selling the 147/145 put spread, risking $2 to make .18. That is a 9% return. Now again this trade fully depends on how we open, if we gap up/down the numbers change, but the levels do not. Tesla had a big miss yesterday on deliveries at 254k, Factset was at 263k, will that throw off futures? We will have to see. The trade is posted below for you to see the .18 credit it generates. Your max loss on this trade since you are getting .18 is $1.82 per.
Now let’s get into the why META at these levels
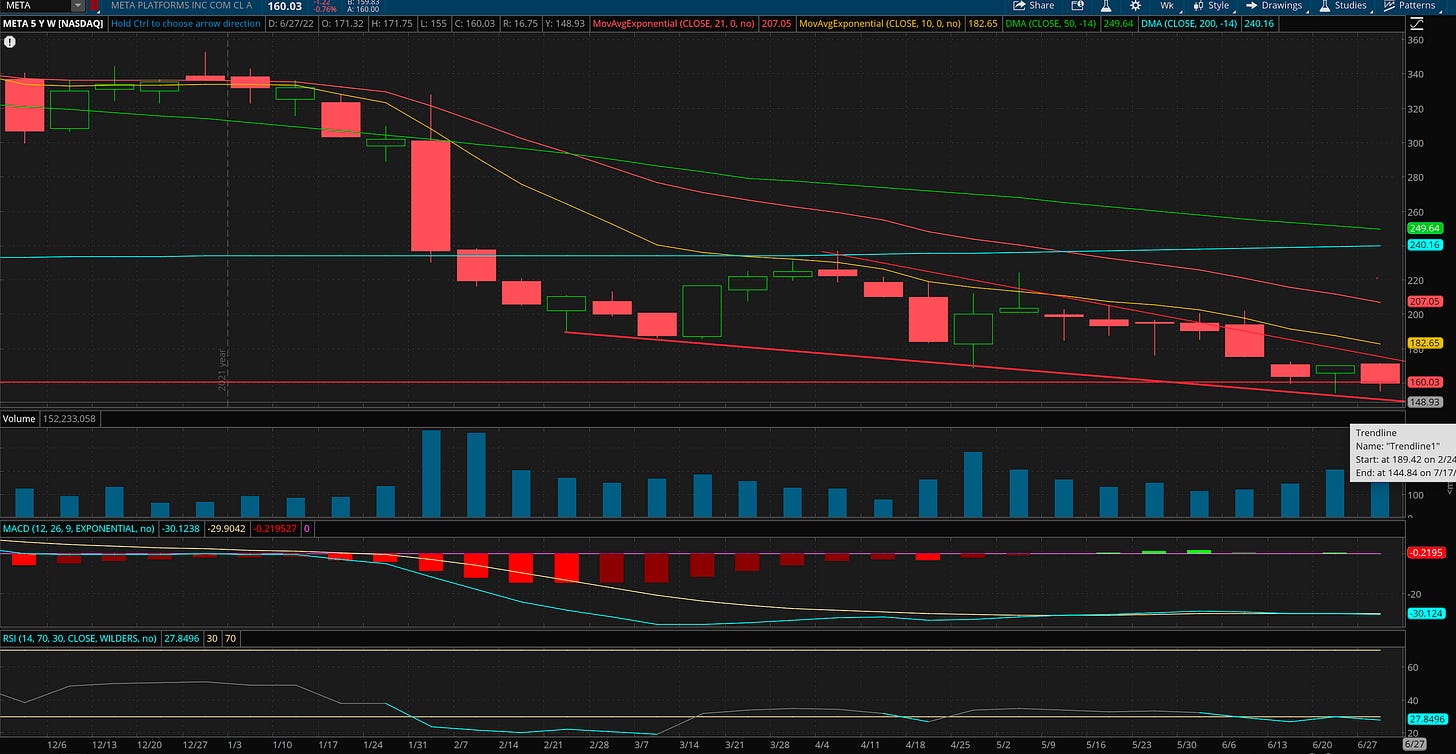
Here is the daily chart, as you can see we have been in this downtrend since February and the bottom of this downtrend has held well, 149 is the bottom of that downtrend, hence why Im suggesting selling your put spread BELOW that level. You could very well sell at 149/145 or 149/147 put spread if you’re feeling gutsty and want to make more money. Im trying to suggest the most conservative trade for the situation that can still generate a nice return.
Below here is there weekly chart, you can see the same levels with less congestion from all the candles. If that 149 level breaks, META is in alot of trouble, I really don’t see it bc this name is very cheap no matter how you spin it. I don’t love the name, but its not so overvalued that it warrants another massive move lower. You can see on the weekly we closed last week over highs from a few years ago, thats the other line crossing through there, so it continues to be saved right at the perfect spot.
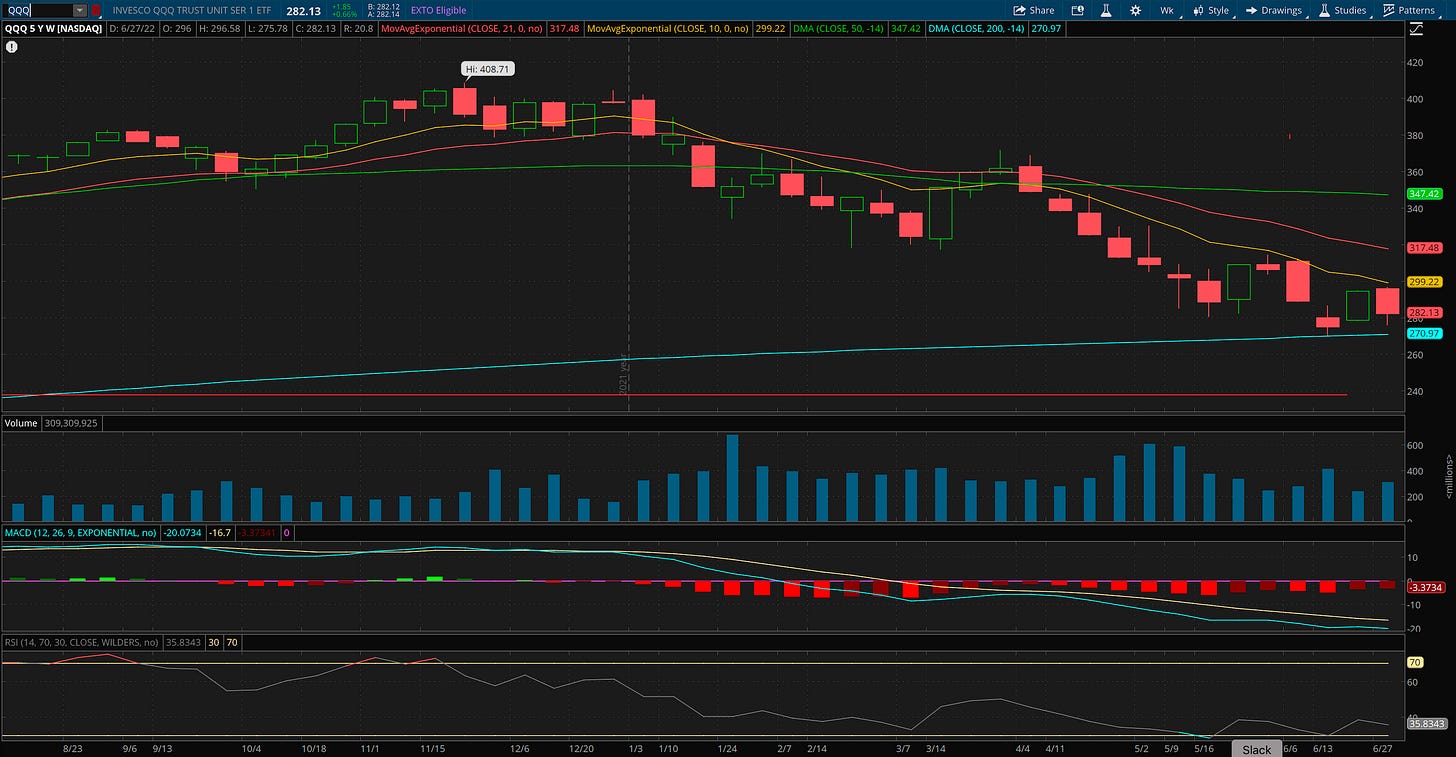
Lastly lets look at the QQQ, overall we still have the 200 weekly a little below at 270.97 and we’re at 282.13, I continue to expect that to hold for now, or at least until we get more economic data that says things are worse. We have Fed minutes this week, CPI is coming soon, alot of things can change, but for now I do think META at the bottom of this multi month downtrend is worth swinging at.


