
My Database Is Finally Searchable

I won’t be writing a recap today, I’m going to share access to my database where you will be able to see all the trends, today’s unusual activity, and search tickers for yourself today. All of the data for today’s sessions is inside there. Then hopefully when you’re done give us feedback on what to improve. I’m going to go over everything here and then you’re all free to search today. The reason Im not doing a writeup today is I want you to use the web app just one time at least, tomorrow I’ll go back to writing recaps but I want you to try this thing out today.
If you’re not interested in any of the below, the link is all the way at the bottom
This is about 90% ready. There’s still a few small kinks that need to be worked out. If something doesn’t work somewhere, please let us know, yesterday the test run with 60 people worked fine, how it works today with 900+ I don’t know, but let us pray it goes well, whatever goes wrong can be fixed.
Lastly before I get into everything, if any of you need anything built, Edwin was great to work with, he is in the chat, he is a consummate professional and as you will see when you utilize the web app, his work is top notch. If you need him for any projects you have in mind, you can email me jamesbulltard@gmail.com and I will put you in touch with him, he just didn’t want his email posted in public.
So a couple things
You need to use all caps when you search ie NVDA, MSFT,etc
Please remember you’re part of a community here, if tons of you start scraping the data, it will ruin the user experience for everyone else. This isn’t an enterprise grade app. So please just enjoy the app, you don’t need to store the data inside it.
For the time being, use the Desktop version. The mobile version is not ready.
There will be a new link posted everyday here in my substack as the previous days link will cut off. I’ll get into that below.
One of the obstacles we faced was how do you share access to the database when you have people coming and going as they unsubscribe. Then there was the issue of the people paying for the LIVE portion. When I manually input data into database it shows up in the app instantly. So the solution was to use links that expire. I’m going to post a link today that will cut off at the open of the market tomorrow 9:30 EST. For those in the live part I will post a separate link for you all in the live discussion part and it will expire at 1:30 EST. This is the only solution so that the people paying for live data maintain exclusive access for what they’re paying for. So the database will be functional for all of you on the substack but will cutoff at the market open everyday. If you do want access to the database during the session you’d have to join us in the live part.
So let’s walk through it all, it is very straightforward to use but still

There are 3 tabs at the top
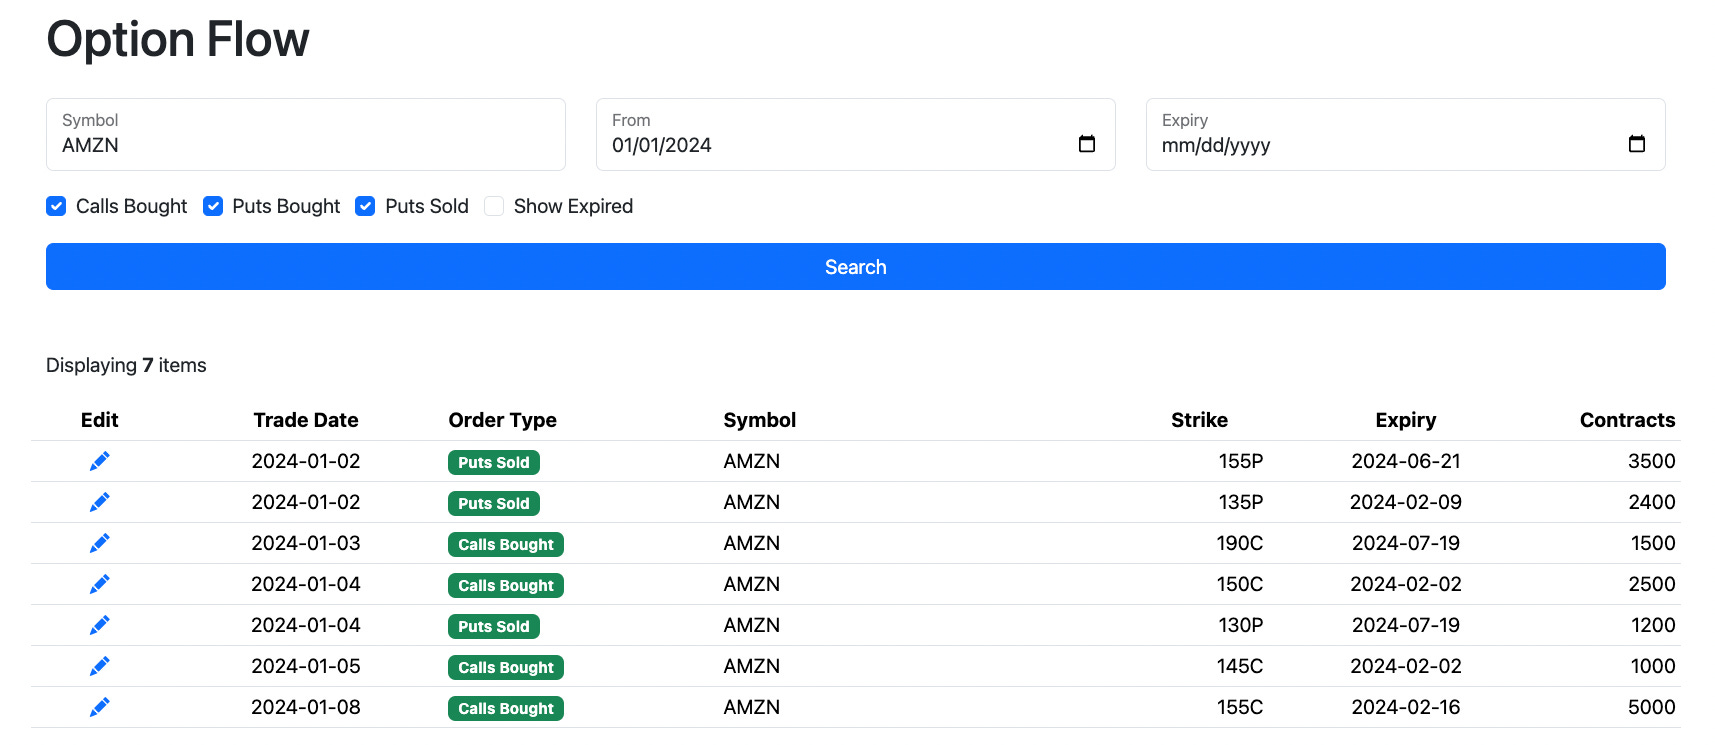
Options Flow
Here you can search any ticker on any timeframe from April 2023 till now, there was no need to add further back inputs. You search with all caps as I noted above, it shows you the date the trade was placed on the left, the expiry and the contract size. You can sort by type of trade if you want. You can see near the top of the page you can check a box and see the expired trades, otherwise it shows you the ones that would still be open. Again I only log when the trades are placed, so you’d have to manually check the open interest to see what is potentially still open.
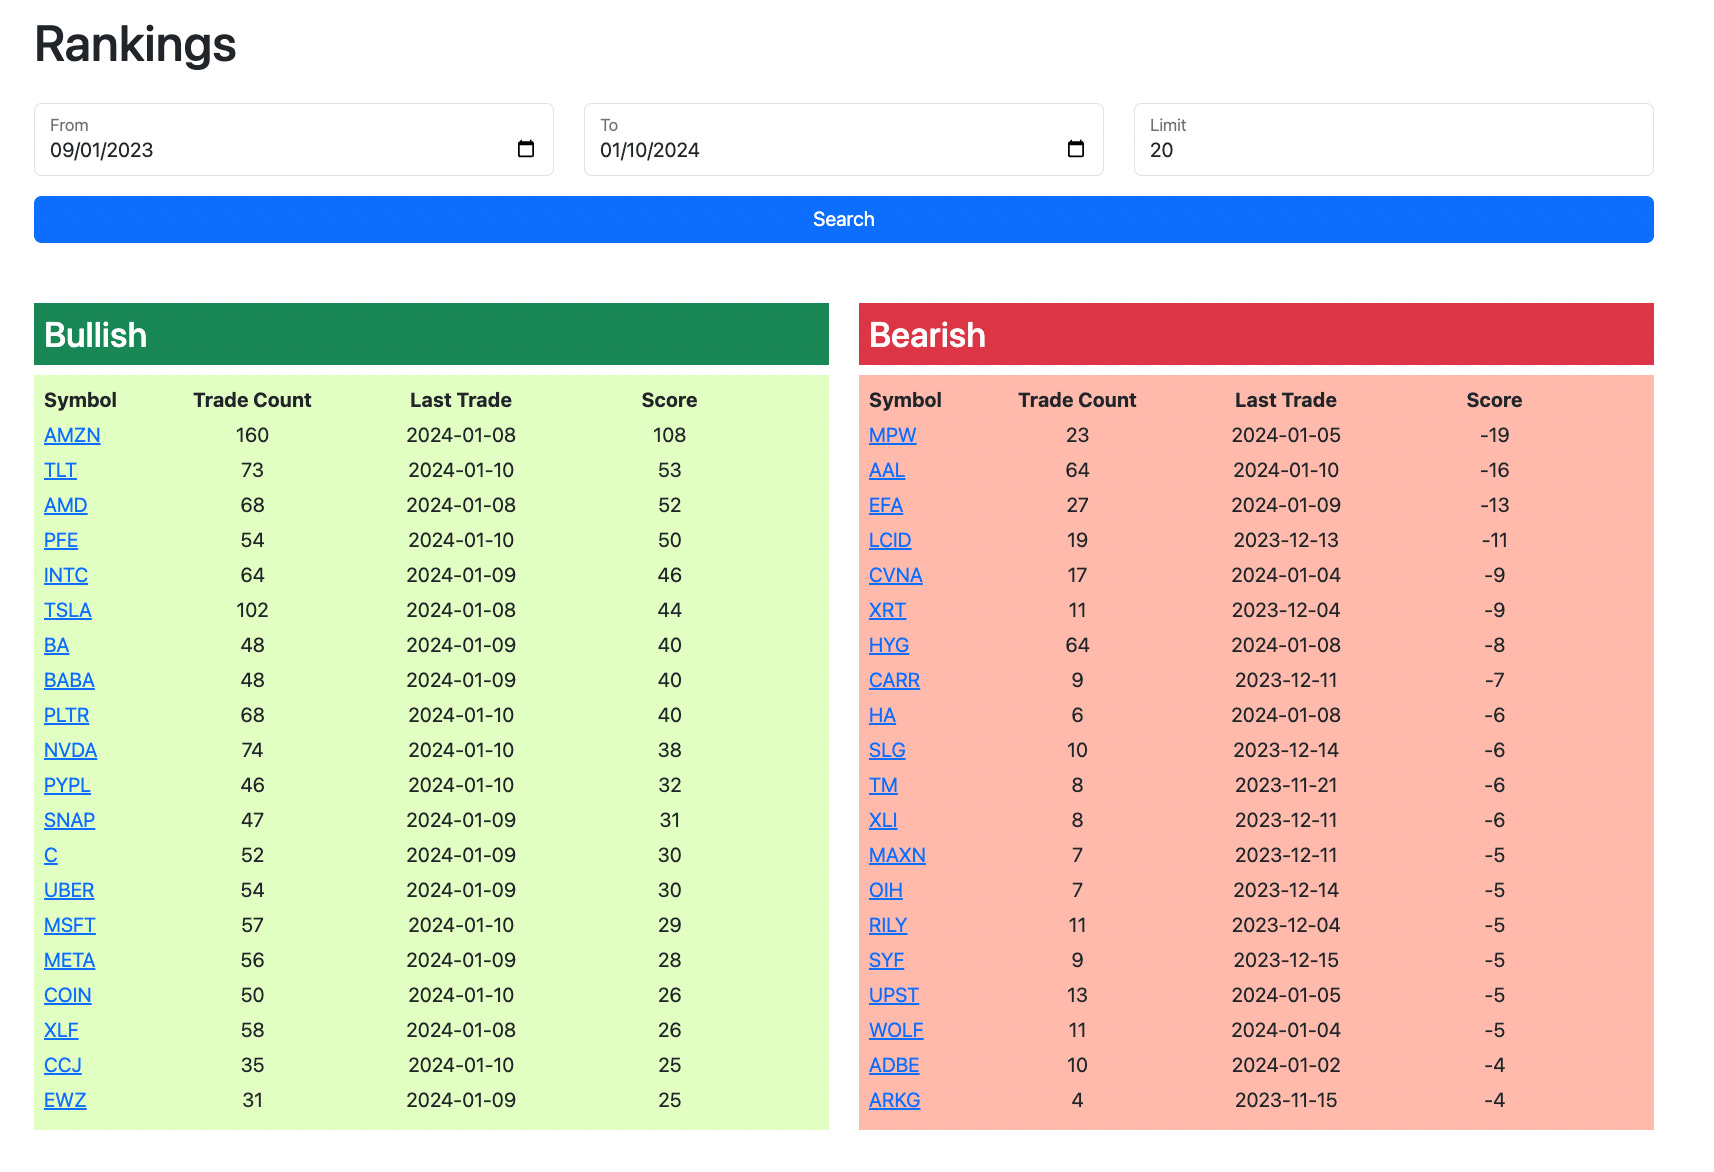
Rankings
The rankings is where I get my trends from everyday. This is where you can see what names are most bullish and bearish in my database over whatever timeframe you want. You can expand the list from 20 to 50 to whatever you want. For your convenience each name is clickable, when clicked you get to see every trade placed within that ticker to help you get what you need quicker.
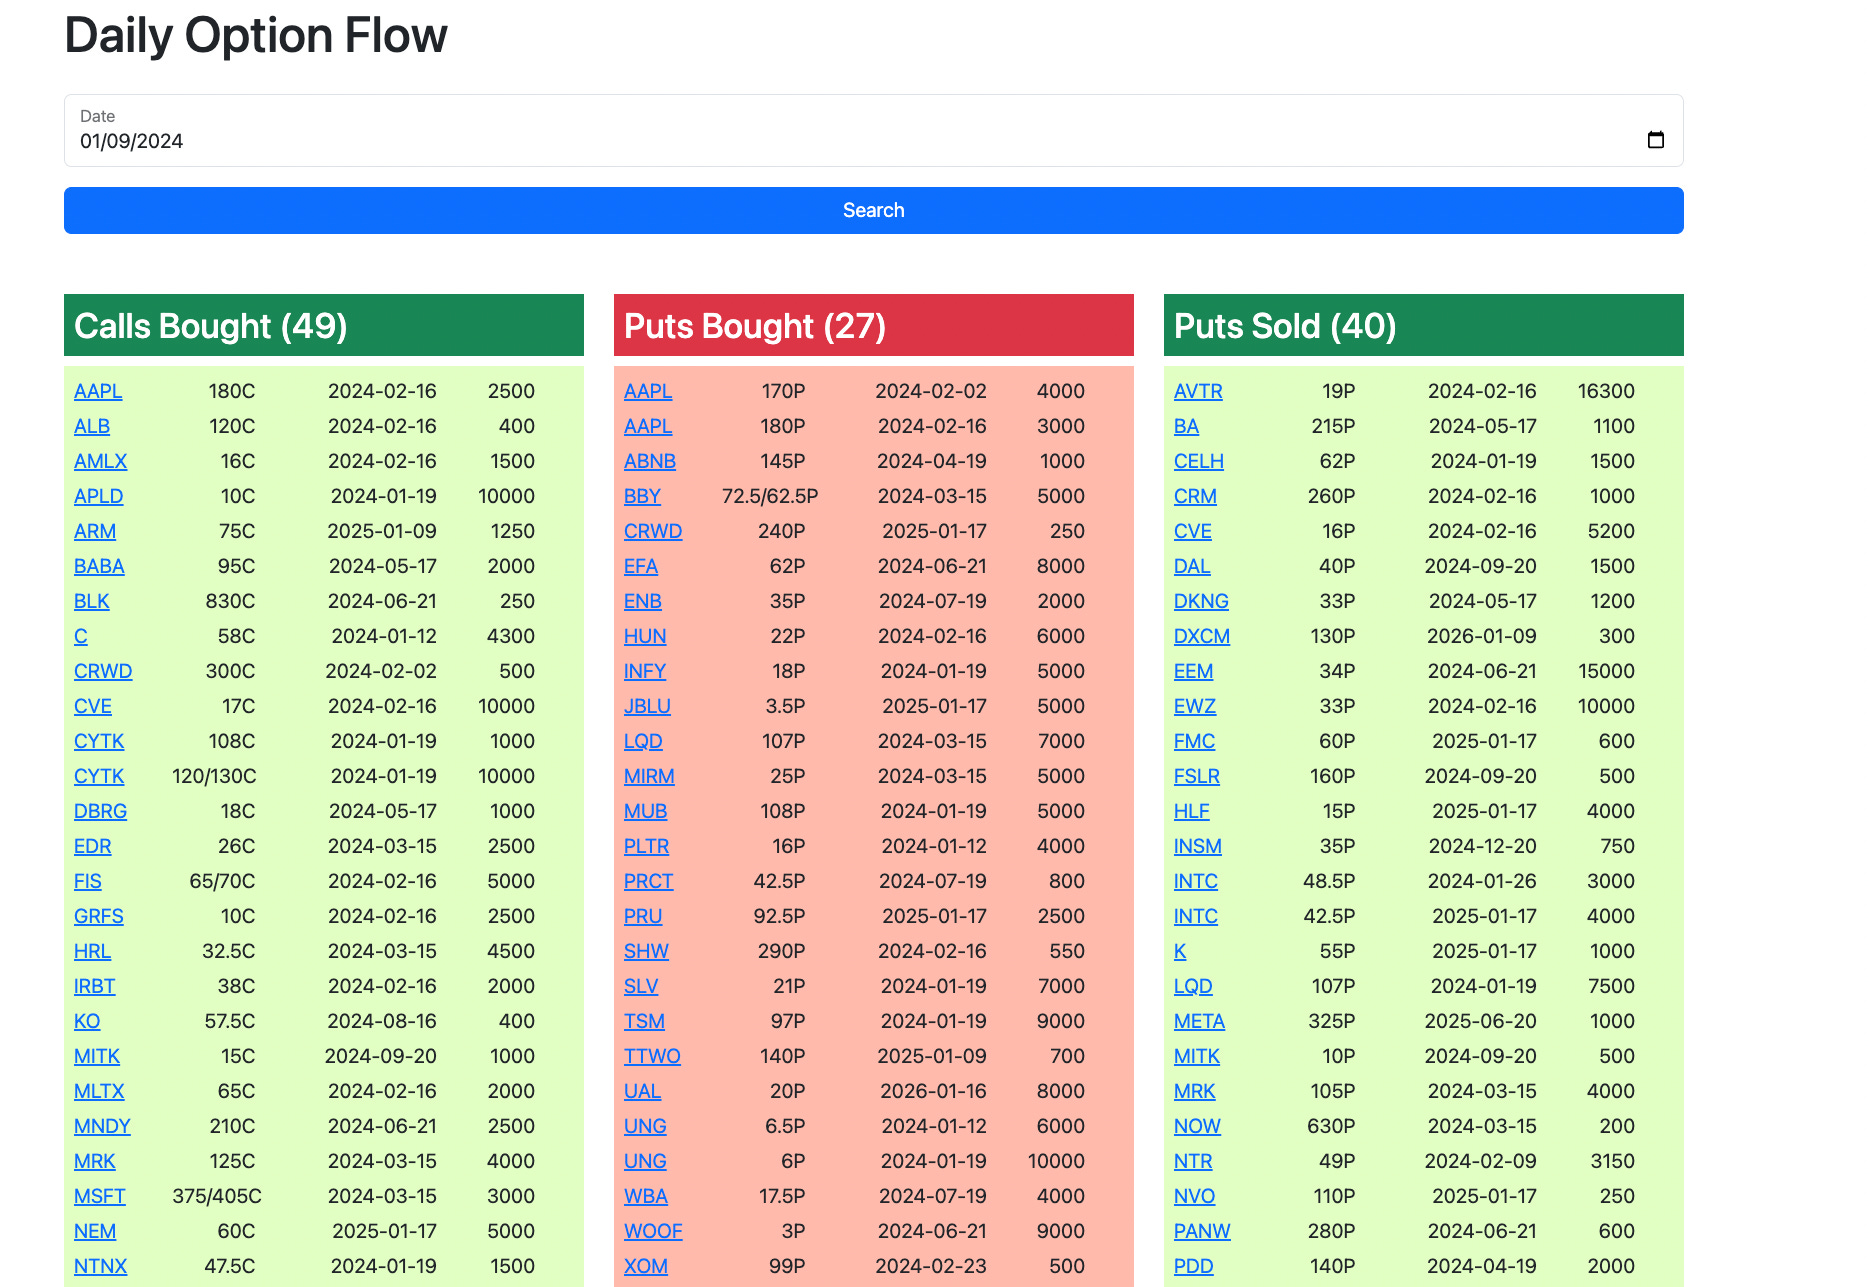
Daily Chart
Last but not least the daily chart takes you to the daily unusual options table I post. You can go back and search other days. I also go back in at night and add in trades from when I cut off many times if there is anything notable to add, so you will see it the next day if you look back.
Overall I think Edwin did a fantastic job, the UI is very clean, the app is fast, and this is the tool I’ve been using for sharing data with you all for the last 2 years. It just helps me catalog and organize all the unusual options my scan pulls so that I can quickly sort through everything to find what is seeing alot of action.
Your feedback is greatly appreciated, if there’s things we could make better, things we can improve upon, etc. Please leave it below or email me.
Again this link below will expire tomorrow morning at the open 9:30 EST, that will be the case everyday, the people in the live chat will have full access throughout the day. If you need it during the day, switching to the live portion is the only option otherwise subscribers will get a new link every afternoon.
Thanks again for being here and enjoy
Today’s Link
Recent Trades
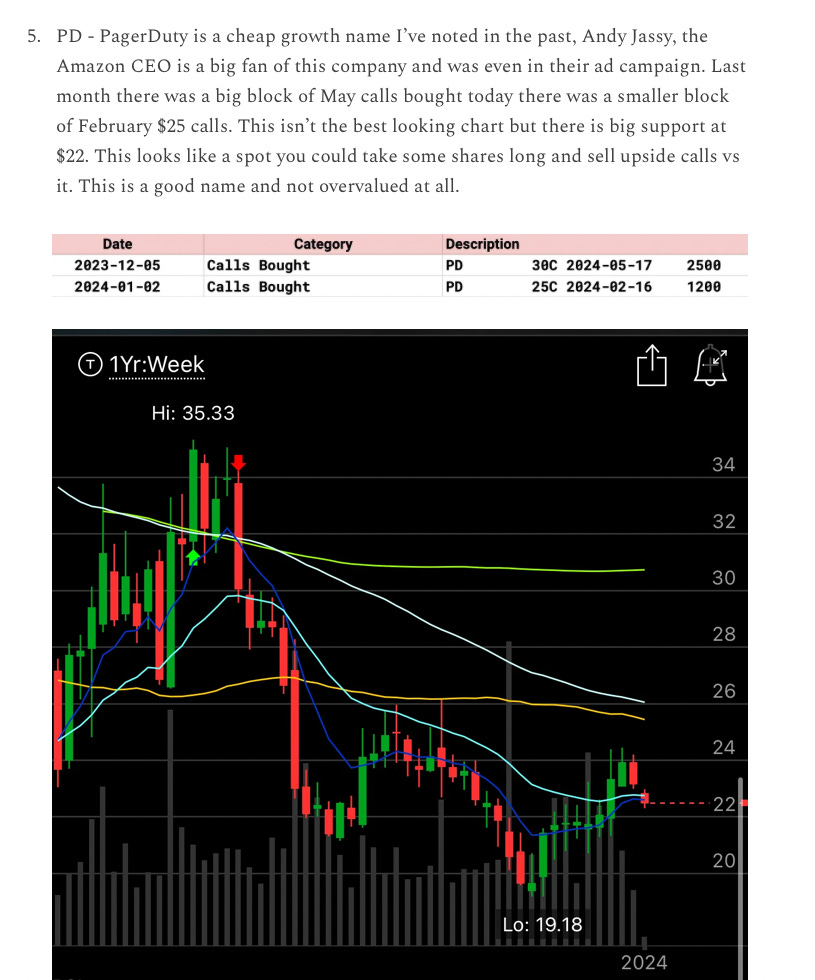
Also did any of you notice PD today? I said I wasn’t going to write a recap but I highlighted that one on the first day of the year, it is spiking right now +15% intraday over $26/share, there must be news but I haven’t had time to check it out while writing this but nearly a 20% gain in the last 8 days.
Great work on the web app! Would it be possible to include the trade premium as a column? That would help me understand the magnitude of the trade without looking up the contract price and running the math separately.
Great job putting the app together. Only suggestion I can think of is ability to sort columns. So click on expiry heading to sort by expiry date for example.