
FAQ
An FAQ

What Is My Objective?
To provide the best options data available anywhere for a very reasonable price to retail traders. Most options services charge alot and provide an overload of data, I try to cut the noise and provide a curated list of 70-100 trades a day that I find to be the most intriguing. Having done this for a very long time, I know exactly what I am looking for in terms of parameters to find trades of interest. I know the average retail trader cannot pay $2,000/month to access data via a bloomberg terminal like a professional. I also know that just having a bloomberg terminal isn’t going to do much for someone who has never used it. I am sharing my own daily notes and musings on setups and option flows which are my guide for what my plan is the next day. My goal is to gain an edge on being directionally right using the options data to model trends.
What makes a trader successful?
The ability to be directionally right. That’s it. If you’re a trader and you’re constantly on the wrong side of the right move, then you should probably look for another hobby.
What is my approach exactly? Why is it Unique?
My philosophy revolves around trading trending names. I am a believer of combining all the available information and using it to find pockets of strength to attack. What information do I combine? I believe in a simple concept of being unbiased and following the money. I combine 3 major things: Charts, Option Flows, & the concept of PEAD. I will explain each separately.
Why Charts?
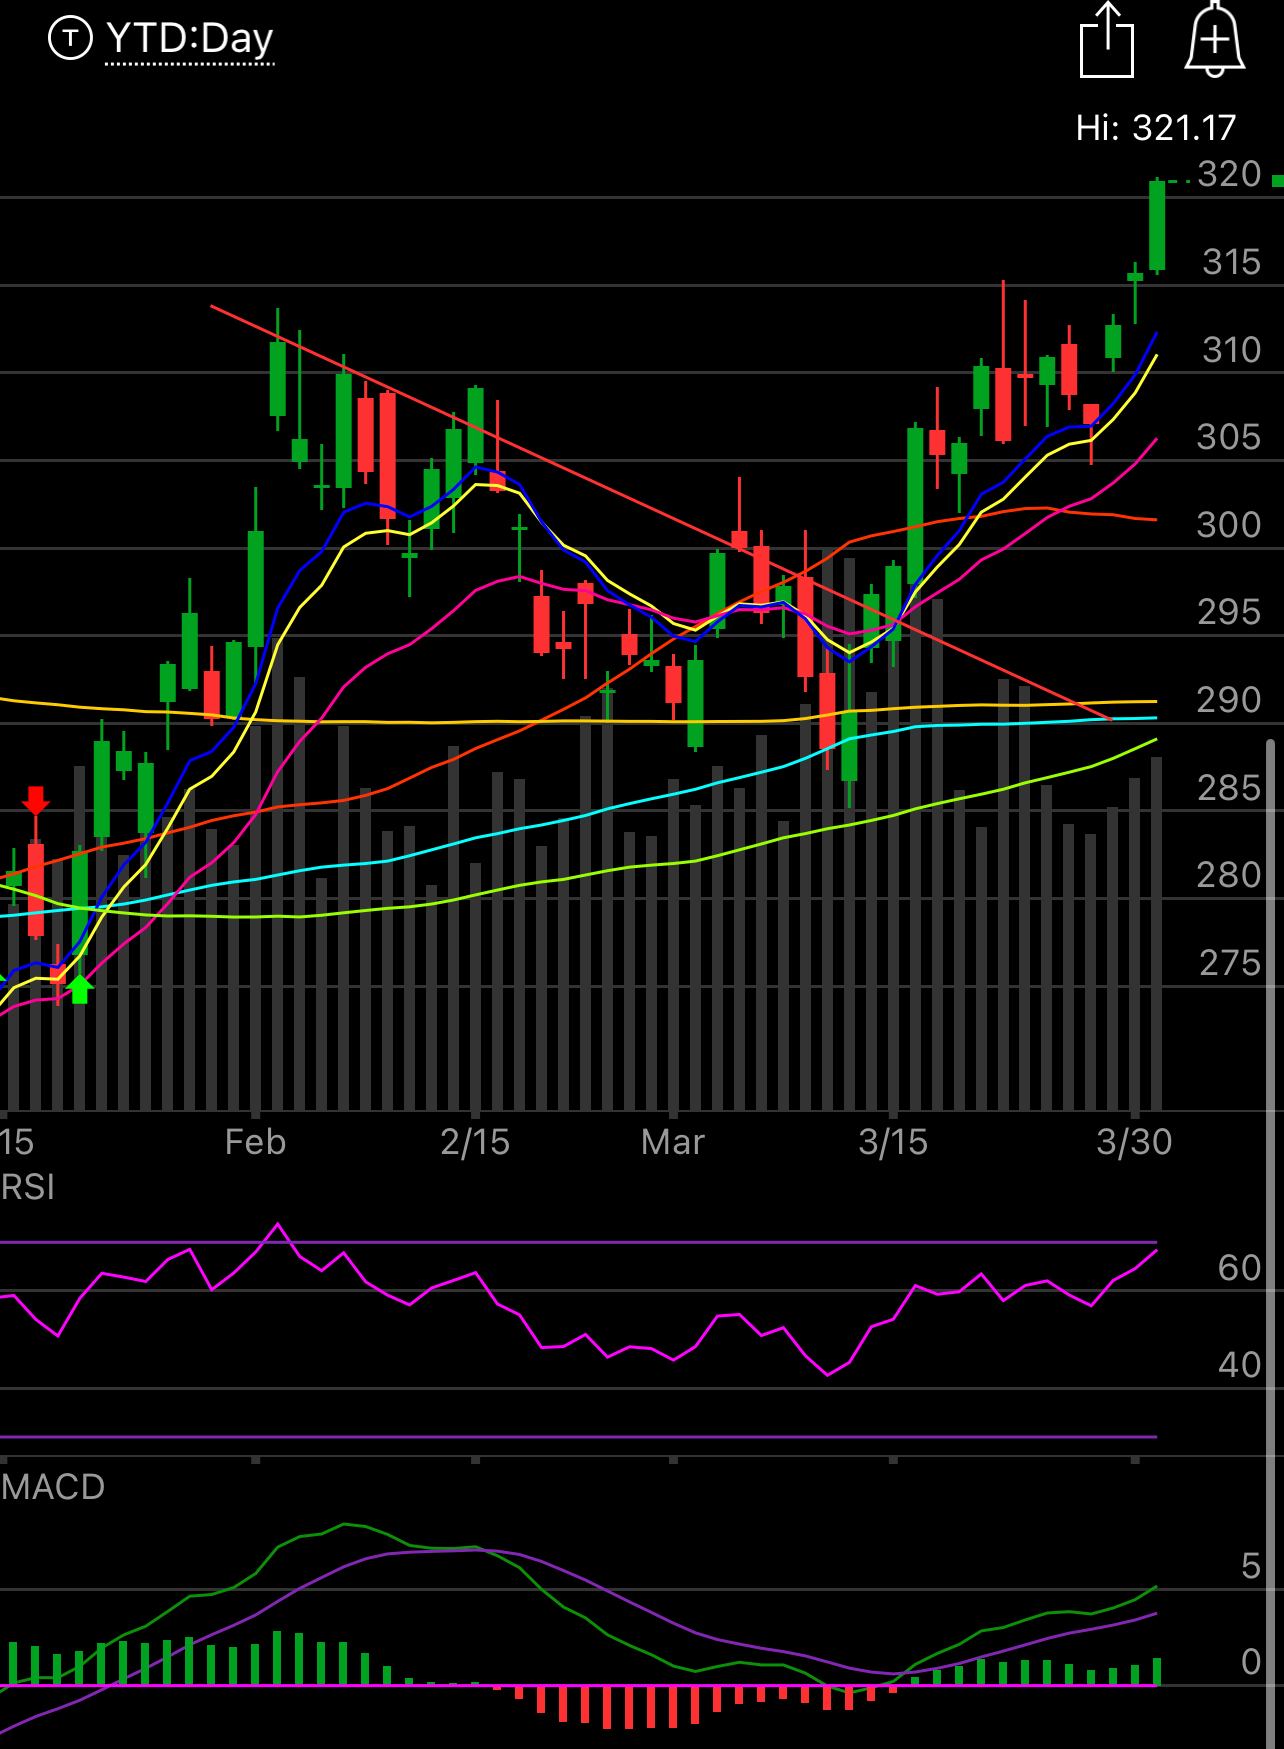
You always hear the fundamental investors proudly pound their chest on how charts don’t matter. What they’re really saying is they have no idea how markets function in the short term and they’re too lazy to take time to learn a new subject so they just hold stocks for years and stocks in general go up over time, hence they eventually make money. The reality is the majority of the market is algos trading back and forth off key moving averages, the patterns that form in the charts simply show buying or selling. It isn’t anywhere near as complex as people make it sound. Think of a candle as a story, and the story is being written and we’re all on the other end interpreting it. That’s it. Go back to my susbtack writeup on 3/19 and you can see this…….
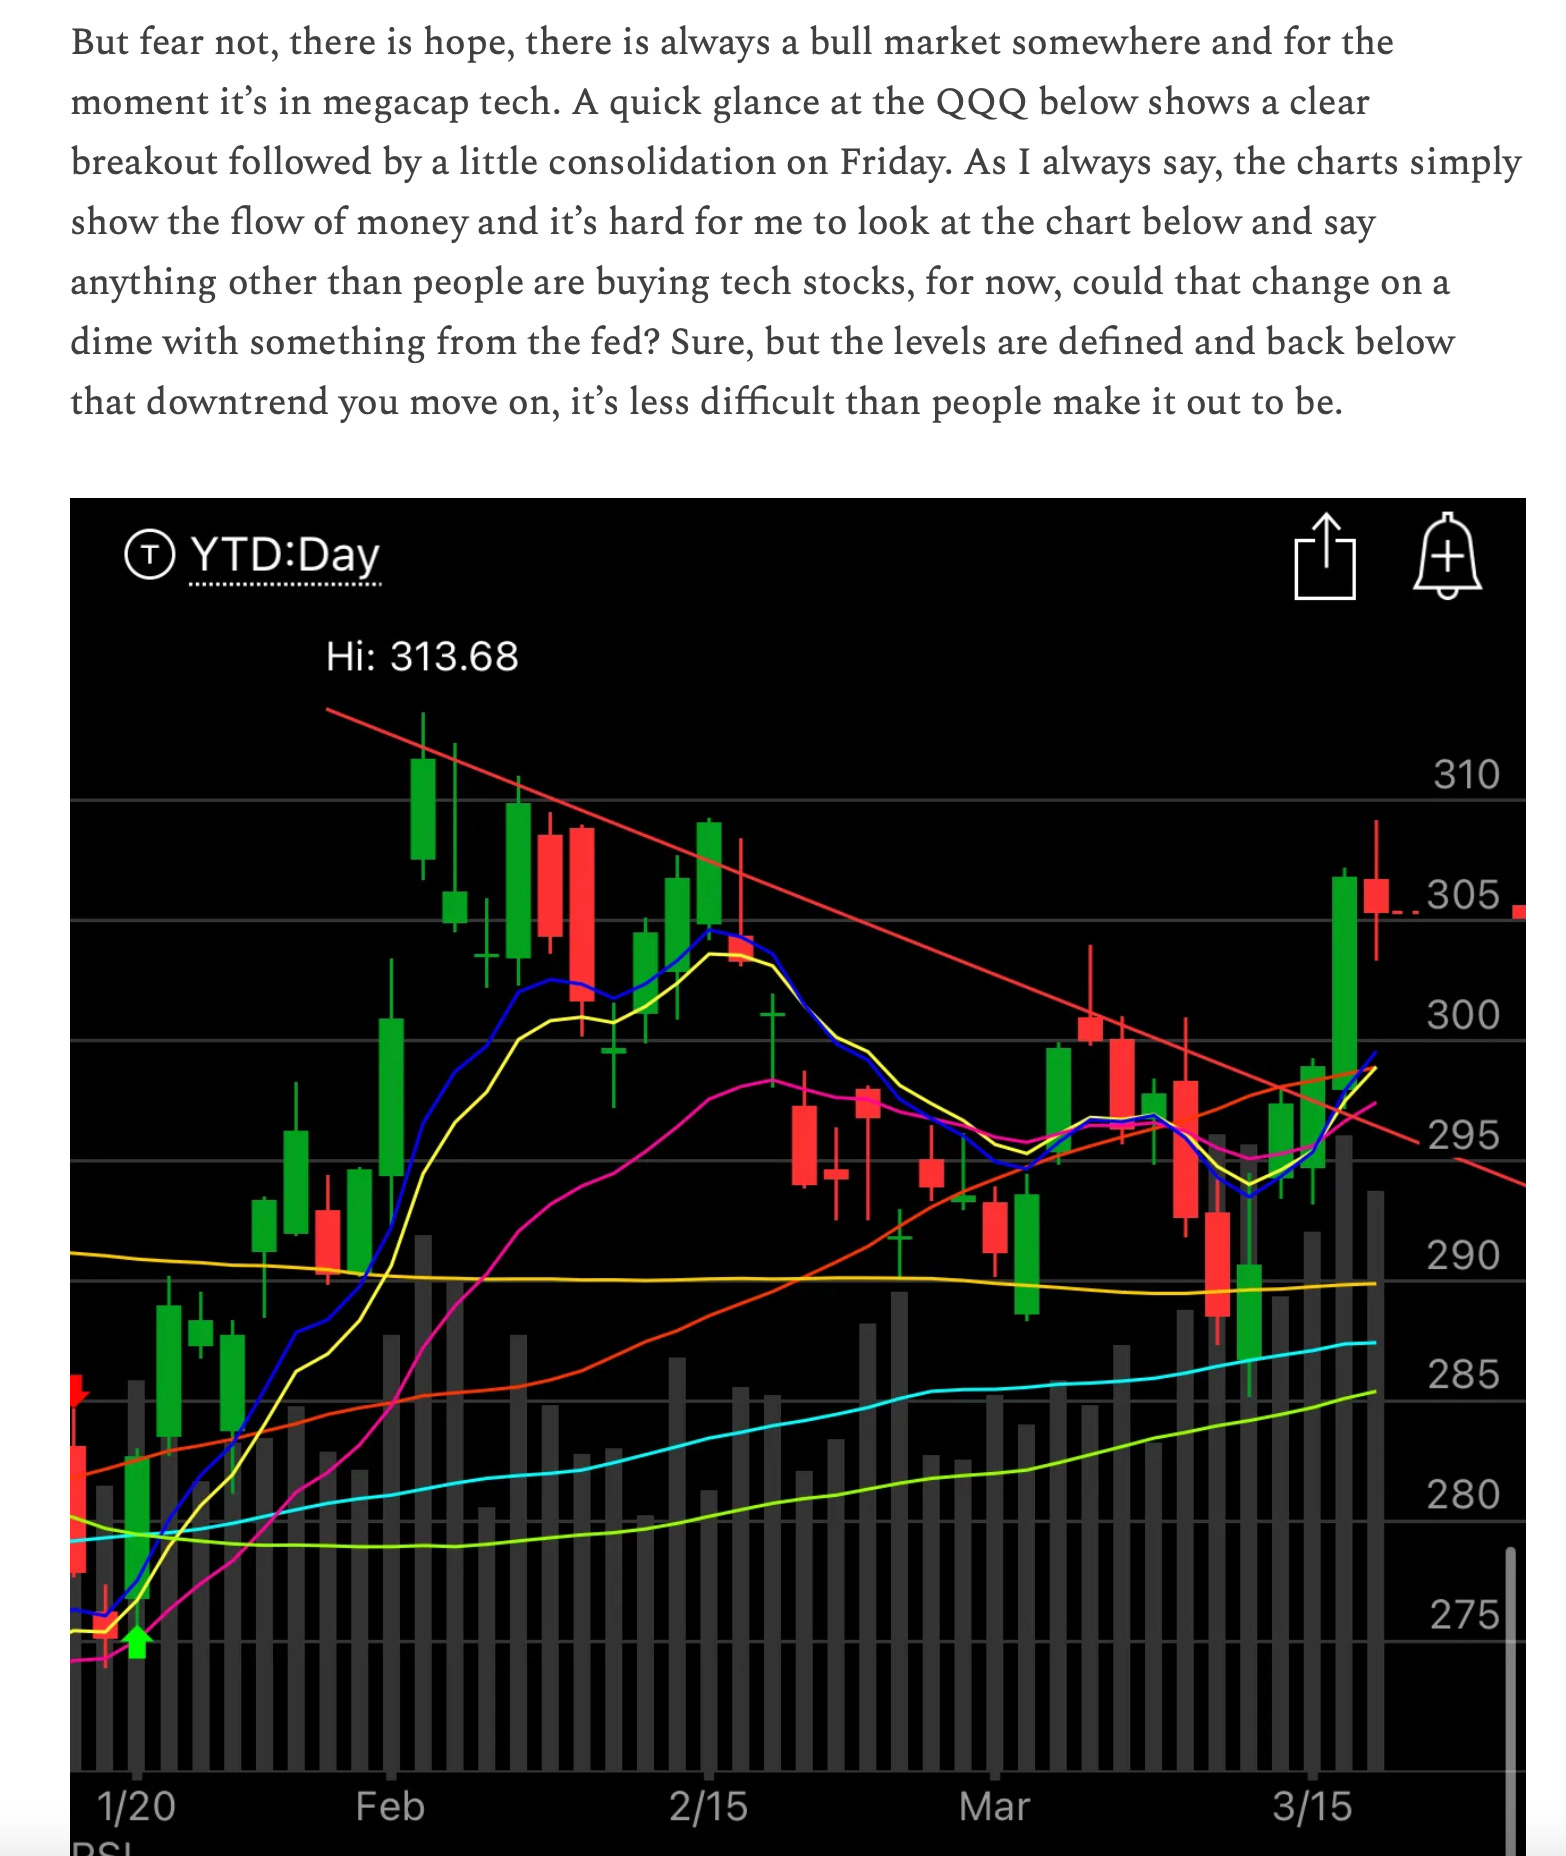
See how I said a breakout was happening in megacap tech and what happened since? The breakout continued. Why did that happen? The chart was showing us the MACD was flipping positive, it was showing us a break of the downtrend, the RSI was curling up, everything was going in the right direction for this particular sector and the move continued. That’s how the game works. This had nothing to do with earnings, it was all about, what are the big players buying next, that is it. When you begin to accept that this is how markets work in the short term, money flowing from one area to another, you will have an epiphany where trading becomes easier.
Why Option Flows?
Because option flows are truth in a world of lies. Investors are focused on 13-f’s which come out way after the fact. You look at last year, Dan Loeb went on rambling how Amazon was $1T undervalued and investors got excited when his 13-f came out way after he took his stake, and within a quarter he had cashed in his stake. So why focus on data that’s looking backwards is my answer. The options market is live and I try to capture the most unusual action within it daily, I then put it in my database to help me build trends which I can then use to find strength. That’s how we end up with something like last week me making JD my best idea of the week and then it going up 10% on news of the spin off. The spin off was known to all the funds who were buying those options, I caught wind of something happening, my database saw it repeated over and over, same with BABA for weeks on end and voila, there was indeed something.
Trends
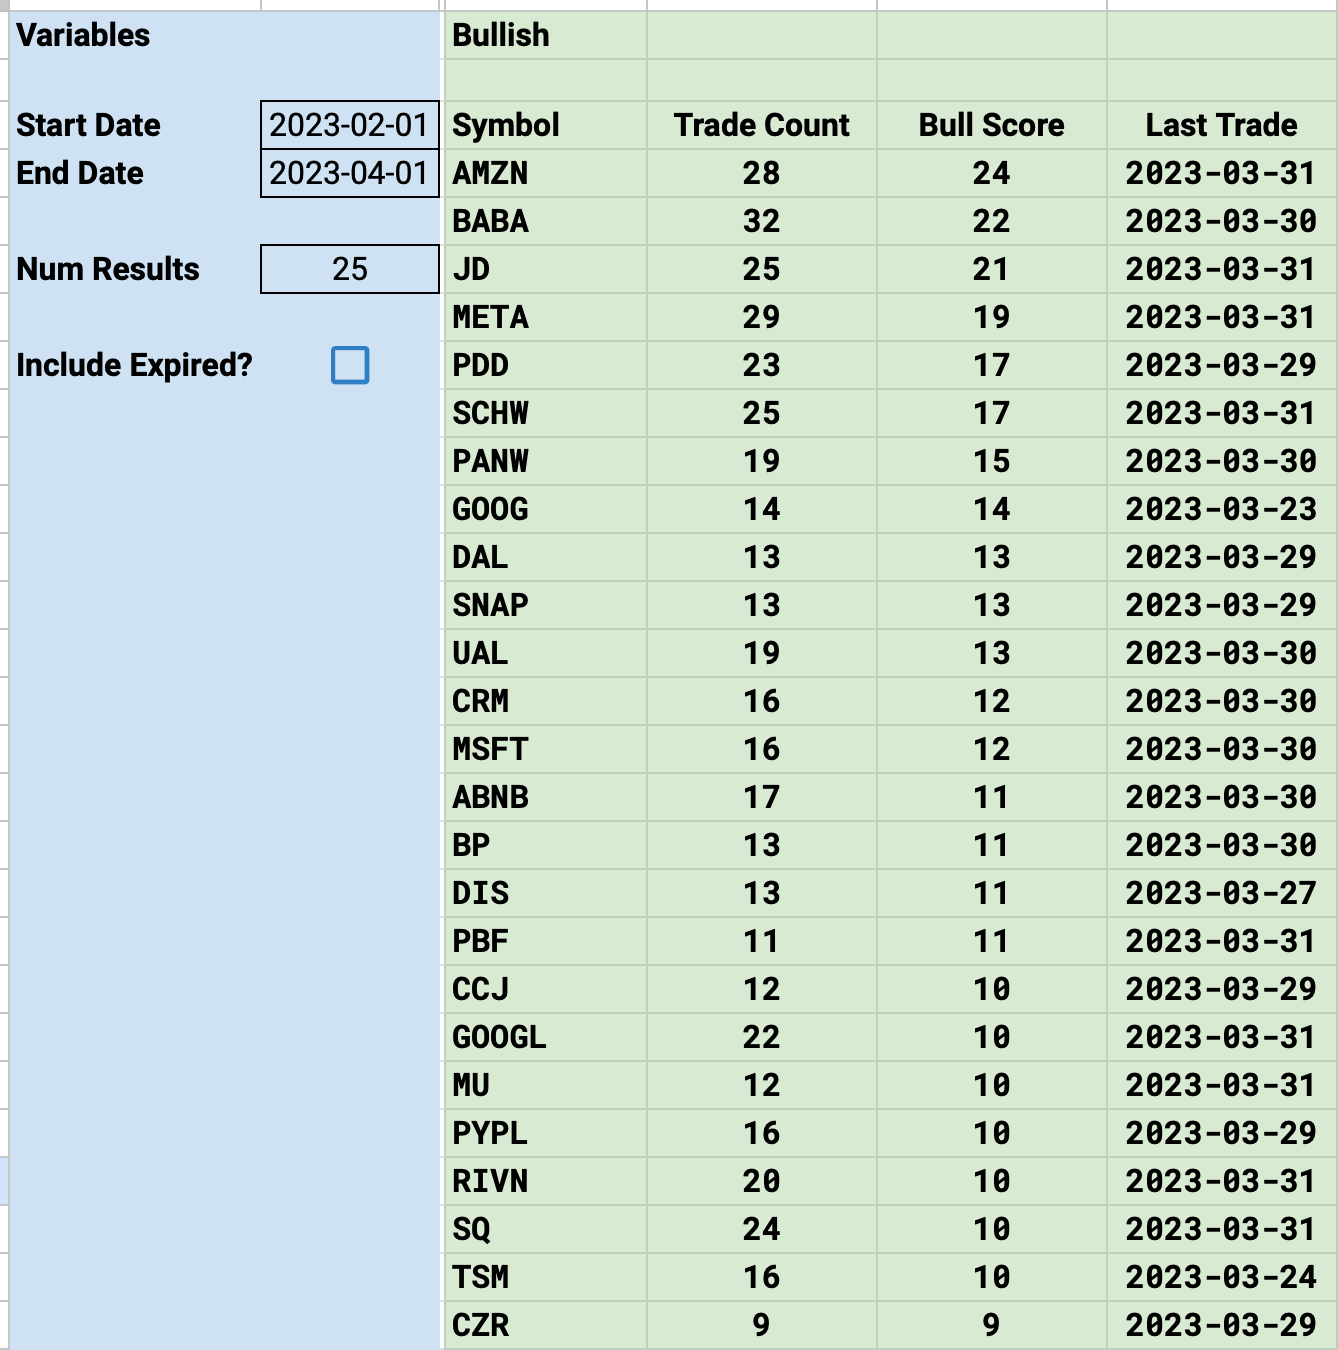
You see me post trends for multiple timeframes daily. Why do I do that? So you can see what is trending. Here are the top 25 trending bullish names the last 2 months, what do you see? How do the trends work? They are just a net score of the trades so when it says 28 trades were placed and a bull score of 24 that means 26 trades were bullish and 2 were bearish to get to 24. Many of the names at the top were the ones with the biggest moves recently. So the trends allow you to see the most bullish/bearish names over multiple timeframes to see how you want to think of things shorter and longer term.
What is PEAD?
Post earnings drift, it is a thing, when a name has a good earnings reaction, it tends to drift for a quarter and I tend to spend the quarter trading it by selling puts below the gap it created on the earnings move up. Strong names trend up, weak names trend down for a quarter, that’s just simply how markets work. I try to wait for earnings to play out and then sell puts into strength, that is one of my specialties.
So how should one use my data?
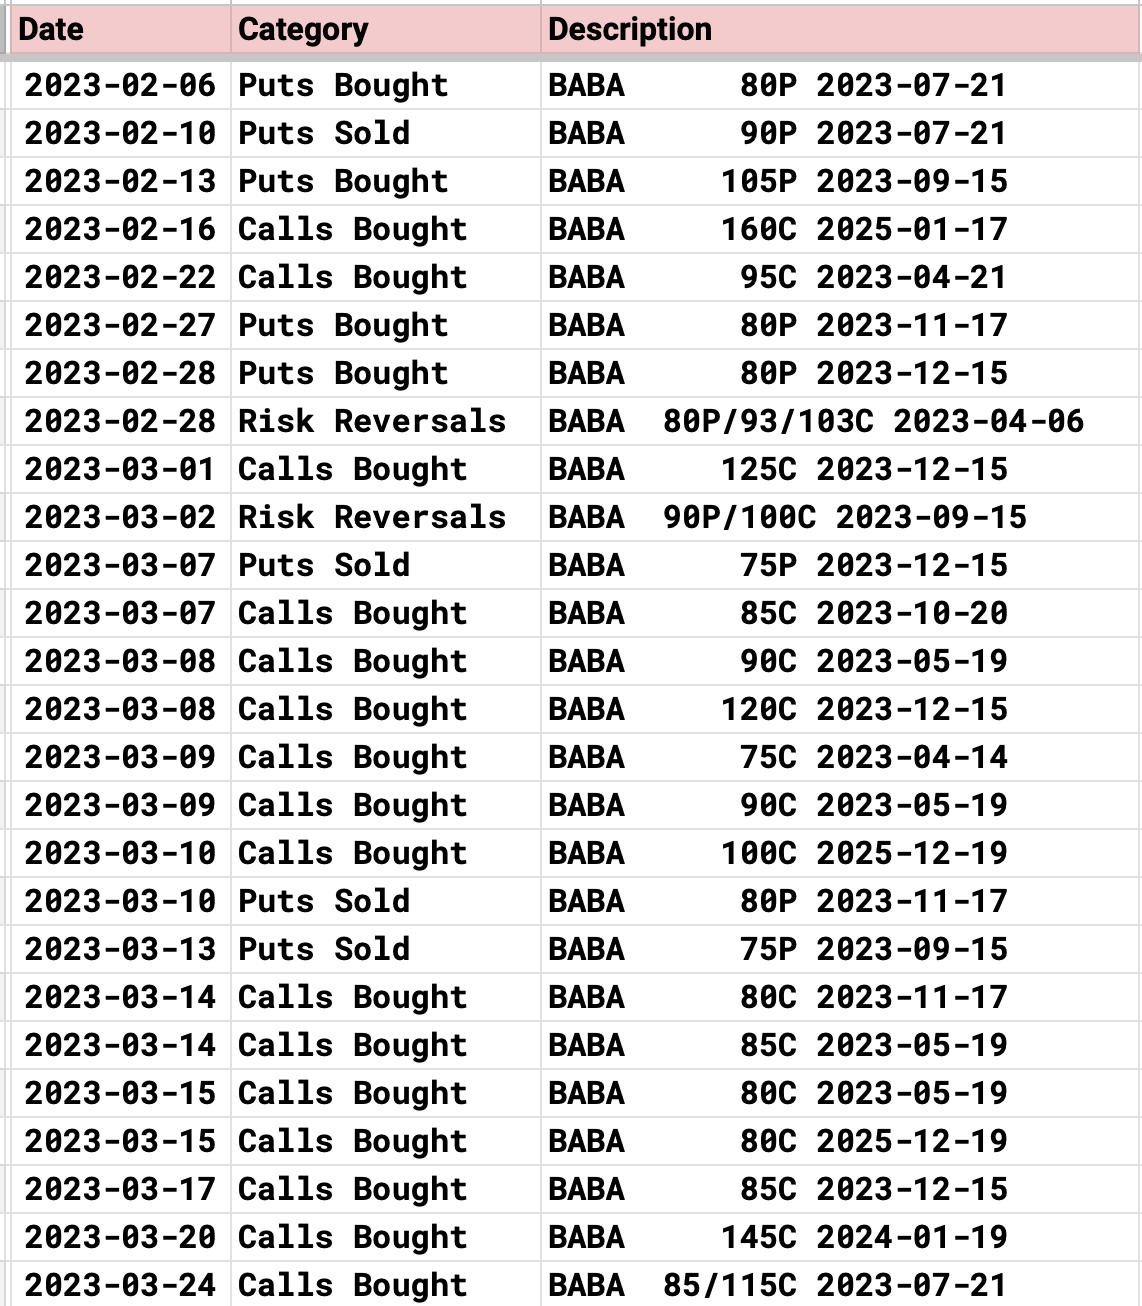
However you like, that’s the beauty of data. I’m simply giving you information on what is trending strong or weak. Daily I give you a table like the one below, 70-100 trades everyday that are showing you what institutional money is doing. Whether you want to sell puts with it, buy shares, buy calls, that’s all up to you. Take this recap from 3/20 as an example. The colums are straightforward: calls bought, puts bought, and puts sold. With calls and puts bought, you never know if they’re hedges vs a long or short position, but if with puts sold, you know that is a level where an institution is looking to get long, so I take those with great importance in looking at levels I want to sell puts at for myself.
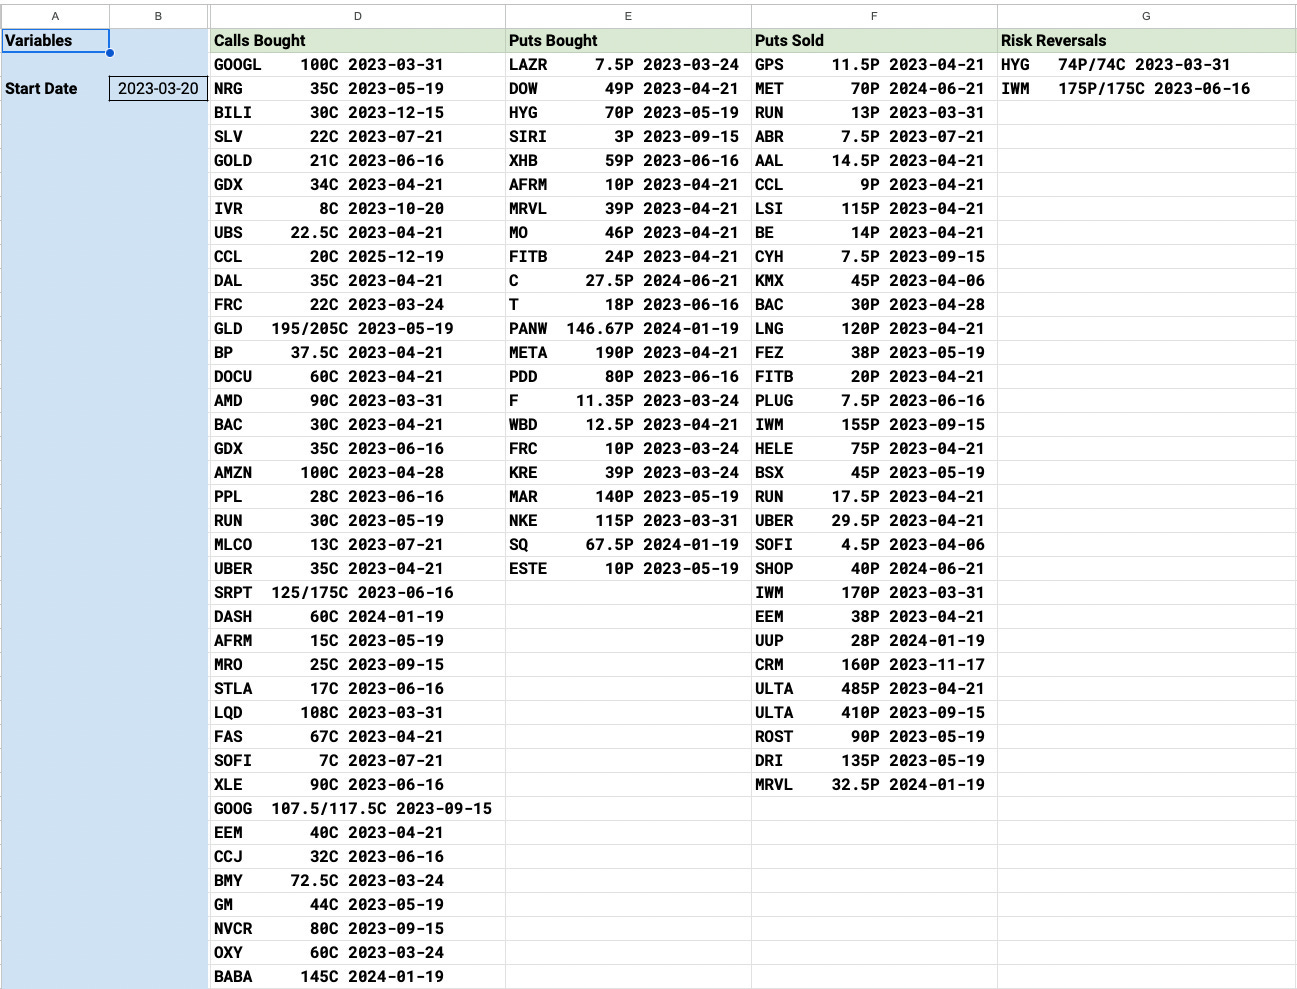
Of course 1 day doesn’t mean much to me which is why I log each unusual trade I see to build up enough data to see what direction is ahead. 1 trade could be a hedge, 30 trades pointing higher, are not. Take BABA for instance, we all saw the 30% move this past week, and you see it above in my top trends from the last 2 months but what did I see beforehand? A ton of unusual action, look at the dates they were placed, and almost all of it was directionally bullish. BABA kept drifting lower and they kept adding to their bullish positioning and finally, it popped
Why do I sell puts mostly?
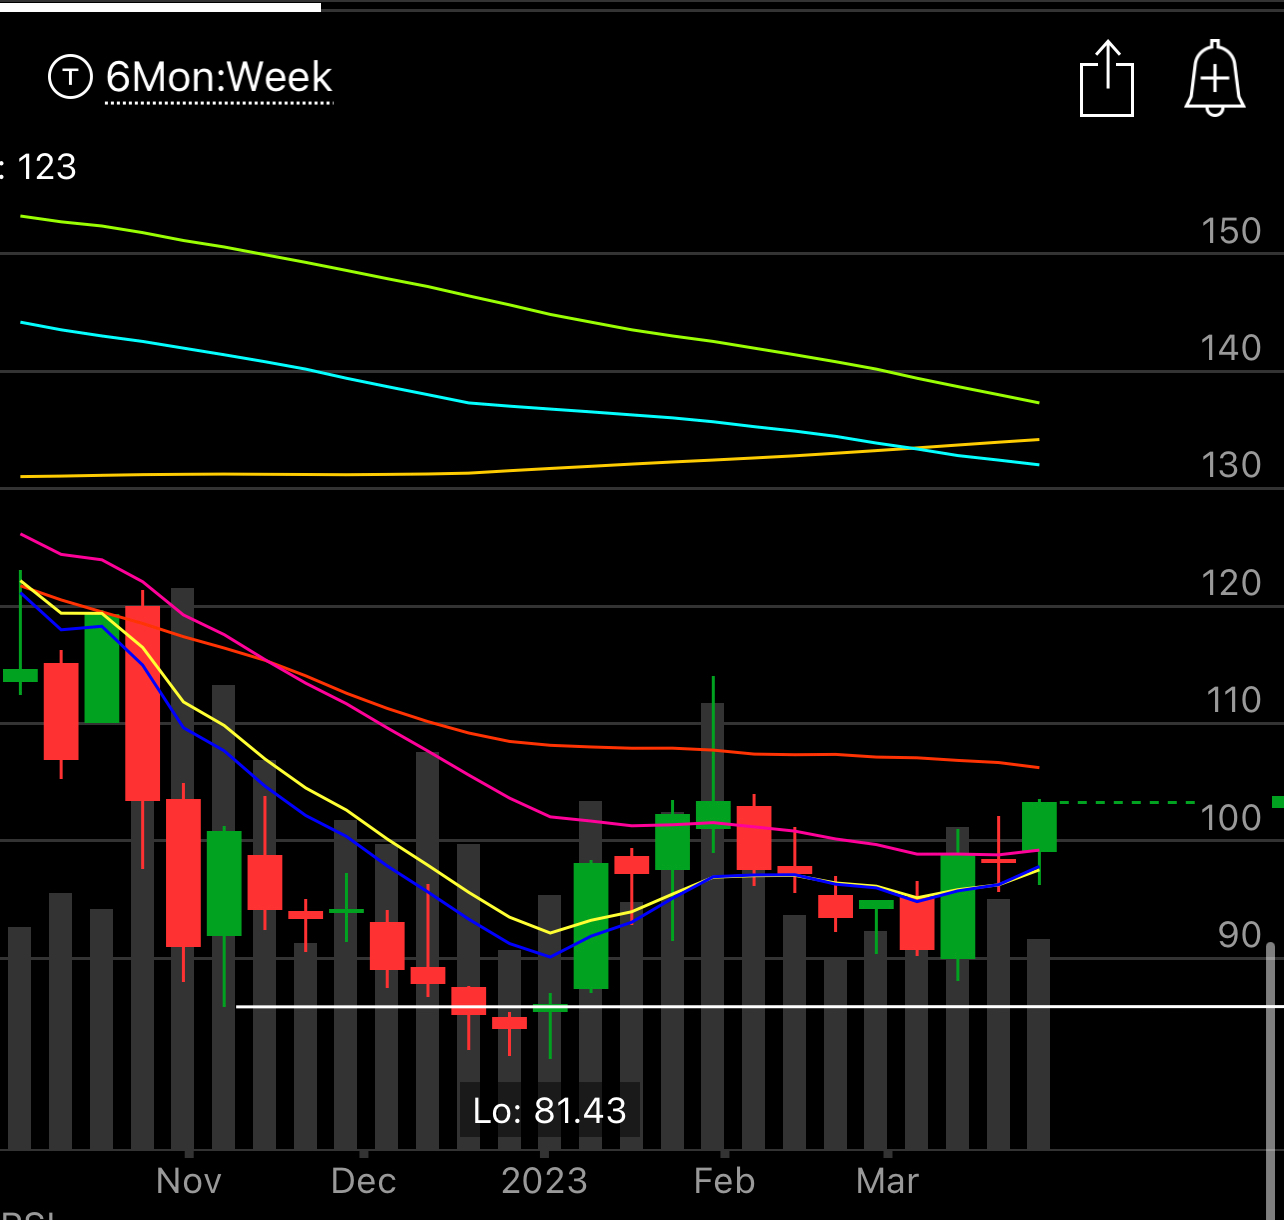
Becaue probabilites of a successful outcome increase. You see my balance, I’m not trading $50k trying to hit a home run, I’m trying to generate slow and steady income on shorter timeframes. I’m trying to find strength using all the data I posted above and then I try to sell puts lower into the strength with the belief that the strength will not come lower, but in the off chance it does, I’m there ready to buy quality names at very reasonable valuations. The nice thing with selling puts is you can profit even if you’re wrong. What do I mean? Say Amazon is $103 today and I sell puts at $85 in June. Let’s say Amazon has a horrible quarter and ends at $90, that’s a big move down, but I was still right on my $85 puts that I sold. Why did those work? Because that was a key level and Amazon likely holds it, look at the chart below and see why I chose that level
When you sell puts, you dictate the level you’re a willing buyer at. If you have data on what is trending and you have the ability to see levels of support and resistance on a chart, and you can combine that with the ability to see how funds are positioning into a name, wouldn’t you say you have an edge? Even if just a slight one? That’s what I’m trying to create. I don’t see anyone else doing anything like what I’m trying to build and showcase here. There are guys who post unusual options flow, but so what, there’s a million trades a day, it’s meaningless unless you conceptualize the totality of the options flow and do it for hundreds of names to make more educated guesses on future direction.
Should you use leverage?
Do I use leverage? Yes. Should you? I don’t recommend it, but I can’t stop you from doing whatever it is you do. I’ve been around these instruments for a very long time, I’m comfortable with what I’m doing, but you aren’t me, so I do suggest you only use cash secured puts. That’s just me being honest and telling you to not bite off more than you can chew. Once you have a better feel on things, if you want to use leverage, be my guest, this entire country was built on leverage, so I am a fan.
Who is the ideal user of this data?
I would say anyone with a decent bit of capital to trade. I mean could you use this data to buy calls and returns hundreds of percent? It’s possible I suppose, it isn’t what I do as a premium seller, but this is likely the most curated list of options data available anywhere so what you do with it I can’t say. Selling puts like I do is a slow and steady game, the more capital you have the more you can generate is just the honest truth. With that said there are lots of guys in my substack who just use the data provided to buy shares or buy calls, there are so many ways to use directional data that there isn’t really a correct answer on how much one needs to succeed and everyone ends up developing their own style that they are comfortable with. There are people in here trading multimillion dollar books and there is a kid in here who started with $8,000 and built it up to $23,000 in a few months just swing trading names within my data as he noticed repeated flows. Savvy people can make use of it in whatever way they choose, that’s the bottom line. If you cannot generate more than the monthly involved here in 1 trade, then this isn’t the platform for you, just being honest.
Discord
There is a discord community that you get an invite to in your welcome email. This has become a tremendous community to engage with. There are 200+ people in there from all walks of life: finance professionals,doctors,lawyers, start up founders,etc and they are all down to earth and easy to engage with. Many are also well versed traders and are there to help out when you have an idea to bounce around. Maybe you have a question on something, maybe you have a trade idea you want to get an opinion on, whatever it is, there is a community of people there to discuss things with you 24/7. This alone has become one of the greatest tools around.
Hey James, great summary that answers most of my questions - thanks a lot!!
Not sure if you can edit the post but if you can add what is risk reversal and it’s significance, that would be great.