
Put Sale Win Rate Analysis

I am sharing an extra post this week, tomorrow I will have a best idea for this coming week but I wanted to let someone else I know and trust discuss some of his findings regarding the put sales in my database. I hope you enjoy this and start to understand why I always say the put sale column is the most valuable datapoint in all the data I share. He sent me a PDF so I’m attaching screenshots of it in here because there was no other way to embed it. Hopefully this sheds some light into why I trade in the manner I do which is simply looking at directional data in my database and trying to conservatively sell puts lower and catch the drift higher. Would I make more buying shares? Sure, but I also take on significantly more risk, by selling puts I can still profit even if share prices decline. That is the main point of emphasis here, the data is being organized either way, if you think a stock is going up, why not put on a higher probability trade selling puts on it materially lower. Again remember every stock is a buy somewhere, that somewhere is visible on a chart by looking at the various moving averages. I know it sounds intimidating but when you put it all together with option flow and charts you increase your probabilities of a successful trade manyfold. Anyways enjoy, I’m going to make a separate channel within the discord for all of you to discuss this stuff it will be called put sale data.
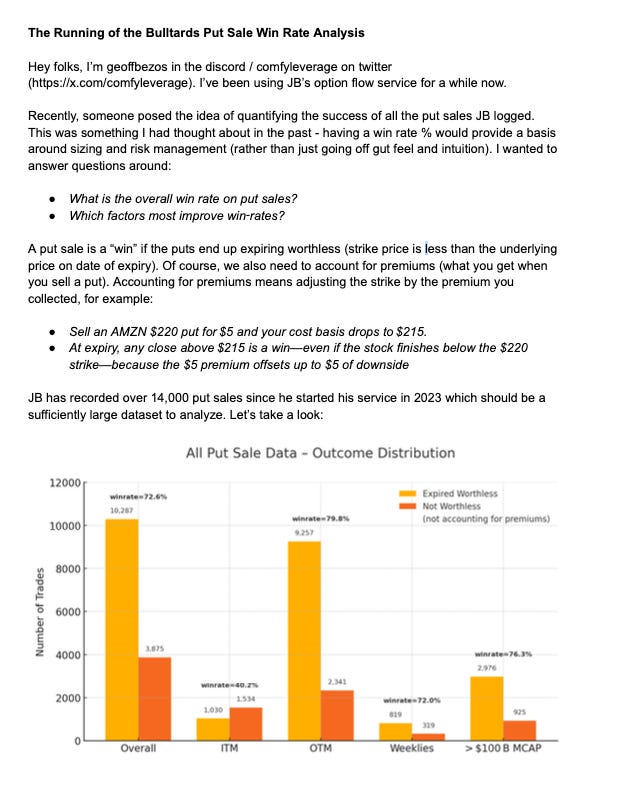
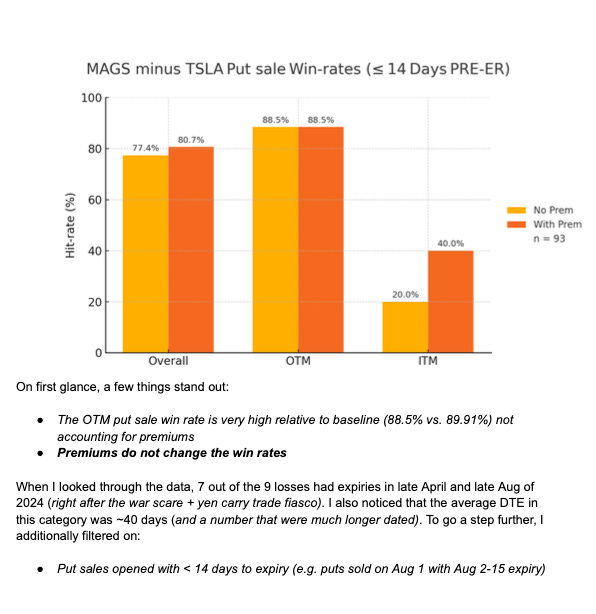
Here is the bottom line, institutional put sales are the end result of hours of research, collaboration, and strategic planning on where to get long a name. Following that by itself gives you an edge, but adjusting those put sales in your favor by going a little bit lower, just increases your already high odds even higher. Think about what we’re talking about here, if 80% of the last 14,000 put sales I cataloged expired worthless, imagine the odds if you go a few percent lower? You could be talking at or above 90% odds of success and when it comes to trading, tilting probabilities in your favor is always the key. Markets are not a hard game, you have to be in the right names at the right times, I feel like my database does a tremendous job showing what names are seeing the most repeat bull flow.
If you combine that with simple market trend analysis which i discuss constantly, you should be able to understand when it is time to push things and when it is time to take a break below the 21 ema. If you stay disciplined and accept these simple market rules you will avoid the vicious downturns where people really get hit hard. For reference look at this chart below, that is the SPY with only the 21 ema and all my other moving averages removed. What do you notice? You will see 1 break in February which led to a multi month move lower and then in mid April we reclaimed the 21 ema and it has been smooth sailing since. Look at this extra email I sent out on February 27th said “Is the Downturn here” .
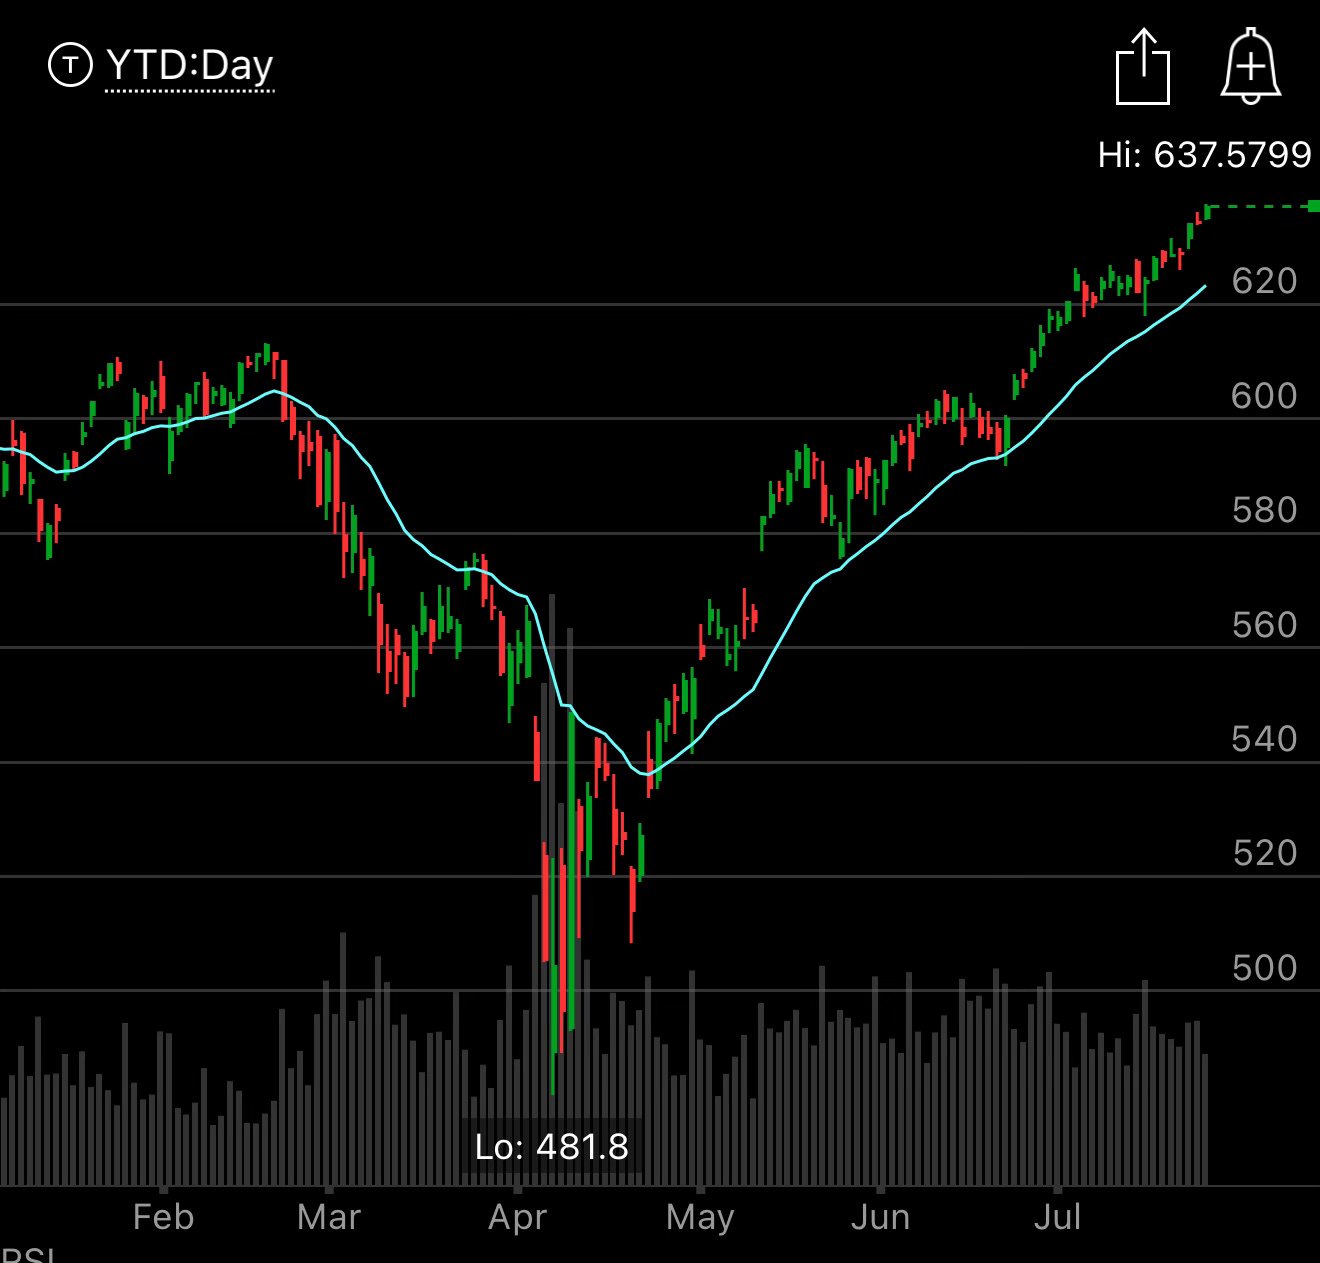
That email was simply me seeing the 21 ema being lost and it being time to dial back risk. So when people say you cannot time the market, they’re just ignorant, of course you can time the market, the day the 21 ema is lost if you are a disciplined trader you simply go to all cash or if taxes are a consideration for you, you sell covered calls and buckle up for the period of weakness or if you’re using leverage you use way less of it if you want to stay long. There will come a time again where we lose that 21 ema and if you stay disciplined you too will not get clobbered. Hopefully now you understand deeper why I’m ok utilizing the leverage I do at this moment and how I know when it is time to stop. One thing about me is I tend to be in the right name at the right time often, for those of you who’ve been here since I started in June 2022, you’ve seen my book grow enormously and it doesn’t matter what my biggest trade is whether it is being all in Twitter in 2022 or being in huge size on that AMZN call spread for that 18 month period to now what I did this year attacking various names. My positioning is simply based on what I’m seeing in my database, it isn’t me pulling names out of a hat. You see where I’m heavily skewed everyday and the returns speak for themselves I’m now up 526.5% since this whole substack began on June 8,2022 and the SPY is up 77.78%. To be up 526% over any 3 year period is fantastic, to be able to do it while detailing every trade along the way is something even I couldn’t have dreamed of when this all started.
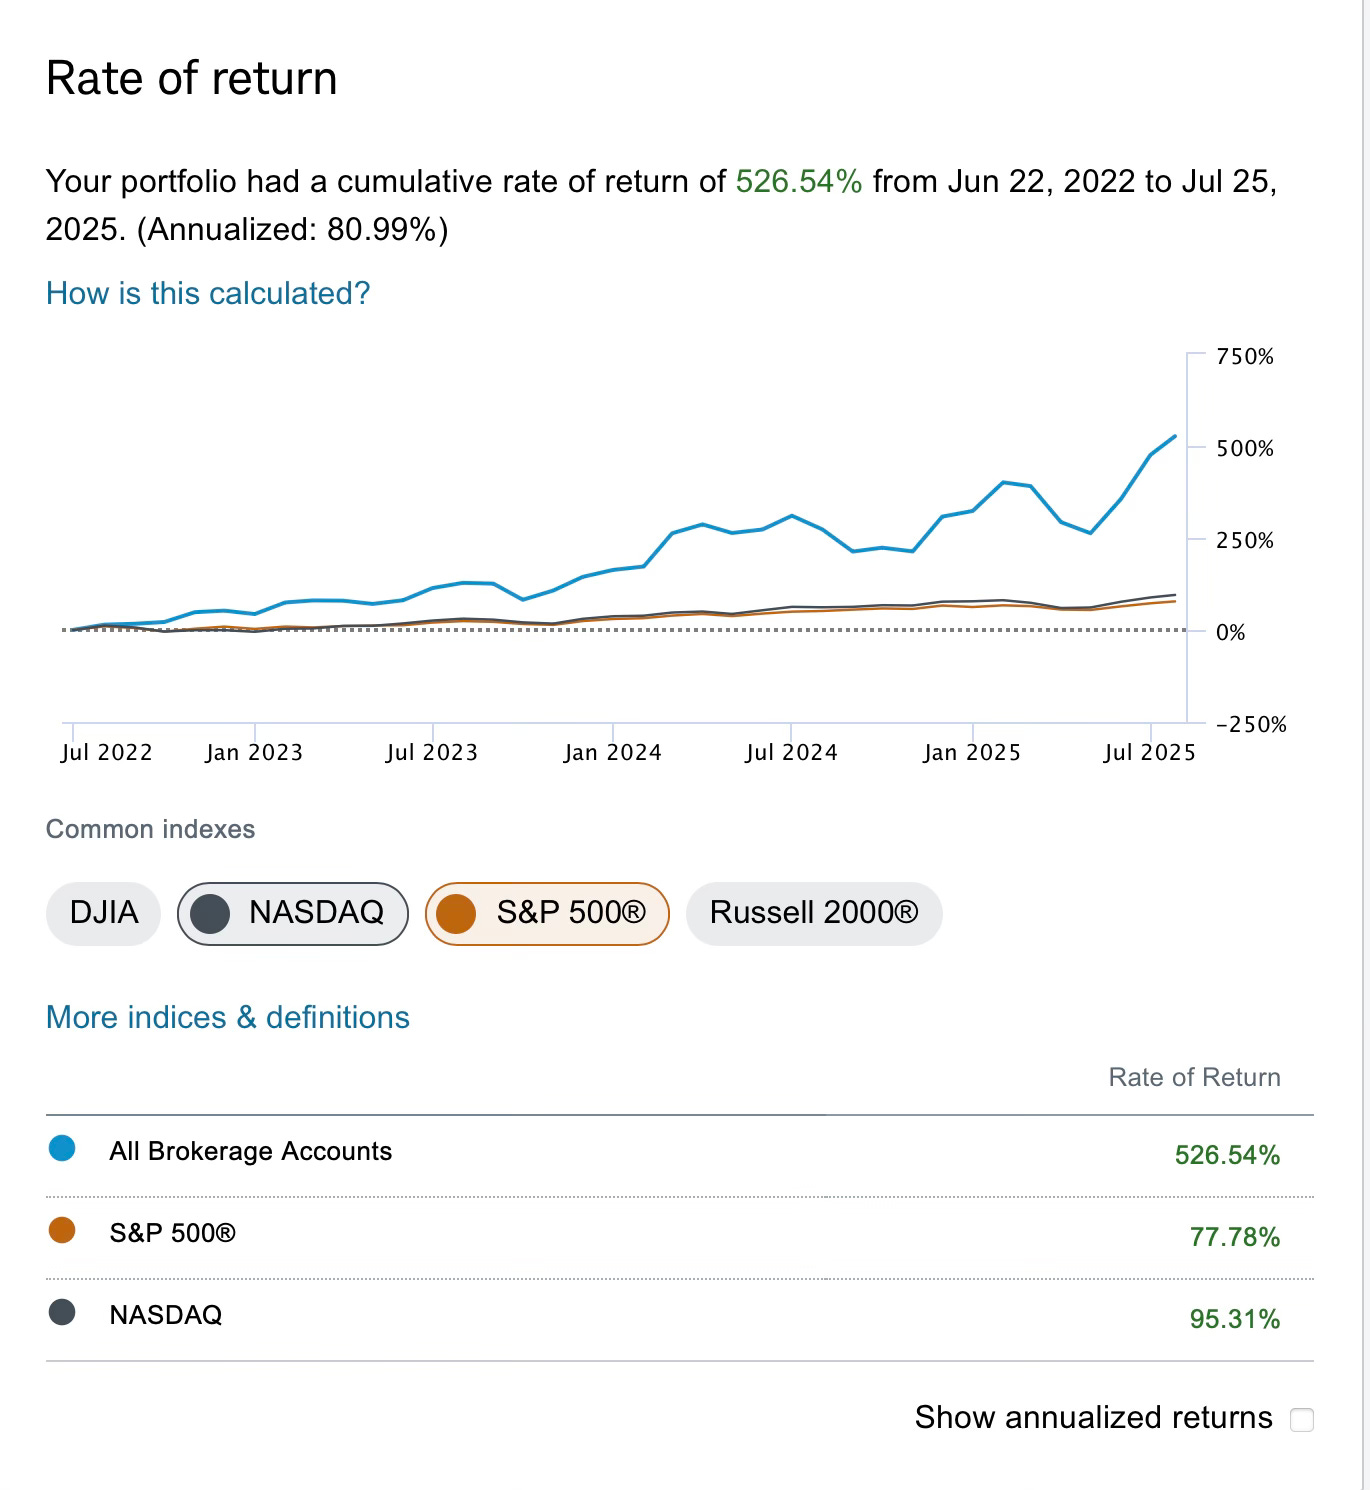
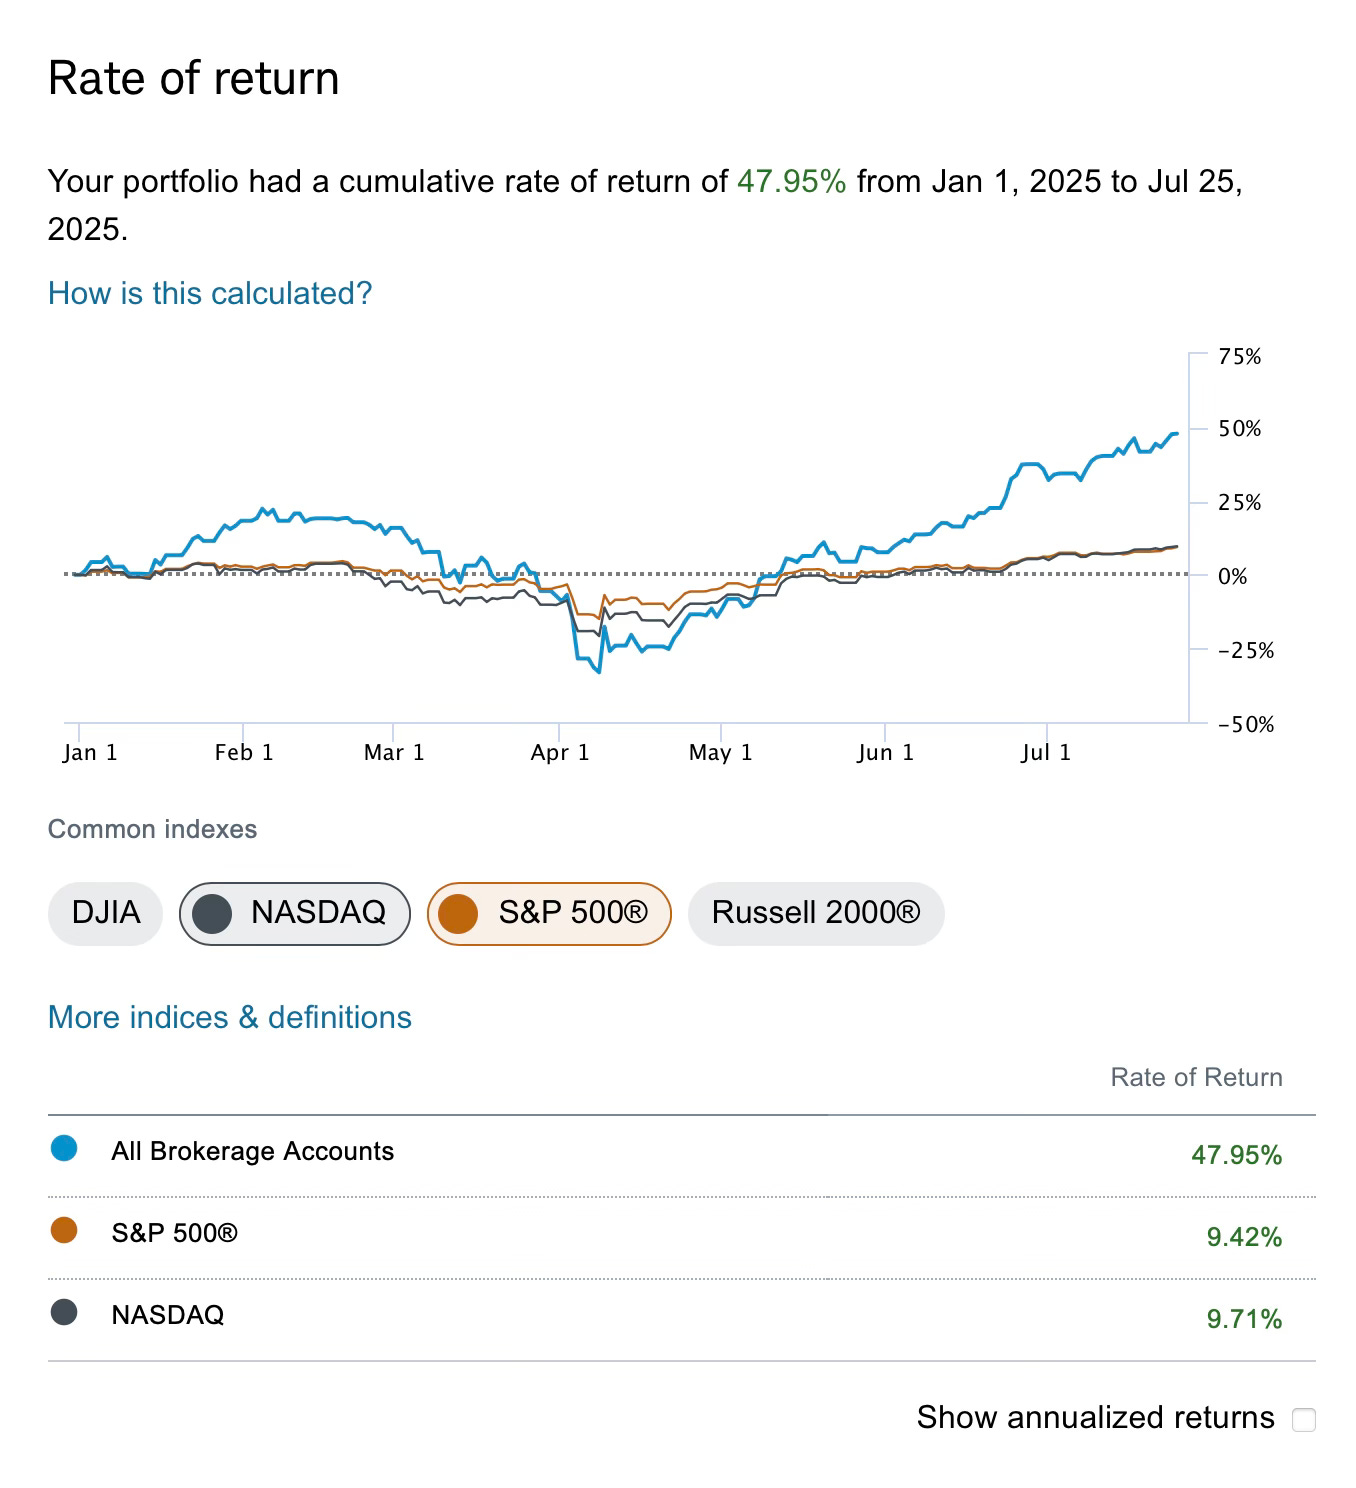
On a shorter term basis of this year I’m up 47.95% while the market is up 9.4%.
Why did I get hit so hard earlier this year if I knew exactly to the day when the market lost its uptrend? Because I got complacent that’s why. In markets when the SPY loses the 21 ema, 9 times out 10, the dip is shallow it might be a few a days at most, and me thinking back to Trump’s first term where he was constantly referencing DOW JONES daily levels, I thought the dip would be shallow. I thought Trump would begin to pump markets, I was wrong. If you remember at the time in February I closed up all my longs and put my money in treasuries for a month but I didn’t close up my short puts. That was what bit me hard. I also understood when the market reclaimed that 21 ema in mid April that it was time for max leverage again and I’ve been pushing it since. Going forward I think I’m just going to take my discipline to another level and just shut down everything below the 21 ema even longer term put sales and just take a break simple as that. If the dip is shallow, then I will get back in when the uptrend is reclaimed.
This game is one where you’re constantly learning and improving your skillset, even for me, and I learned my lesson this year with maintaining leverage under the 21 ema. Yes it is ok the majority of the time, but that 1 time where the shallow 21 ema dip becomes a full blown market crash, you can get yourself in trouble and I did. Just remember that never in the history of markets have they crashed while being over the 21 ema, it really is a simple game, the trend of the market is always there and visible to us, but our ego sometimes gets in the way of doing what we know we should. We want to nail every bottom and be levered long at all times, the reality is, the charts are truth and if you embrace what they’re telling you, life is alot easier.
Great post, James! I have two questions, want to hear your takes. 1. I sometime see far ITM put sales in your database. They likely won’t expire worthless, how do we interpret that? 2, in put selling, a key is to manage the loss when the put is broken. Even if I win 90% the time, that 1-put loss may take away almost all the profits from the 90% wins.(I had a tough lesson on $$SMCI last year☹️) With a sudden gap down on non-ER event, I don’t even have the time to stop-loss. Then weather to hold it further or cut with huge loss was a poisonous pill. Do you have any suggestions on how to mitigate/avoid such situations?
Two questions.
1. What do you recommend when the underlying breaks its 21-day but the S&P doesn't -- or vice versa?
2. GB's data presumably counted a position as a win even if it fell below break-even but recovered before expiration. Does it make sense to hold below break-even hoping for a recovery? (An argument against that: it's likely that once a position breaks below break-even, the 21-day will break soon after.)