The Setup In Cameco

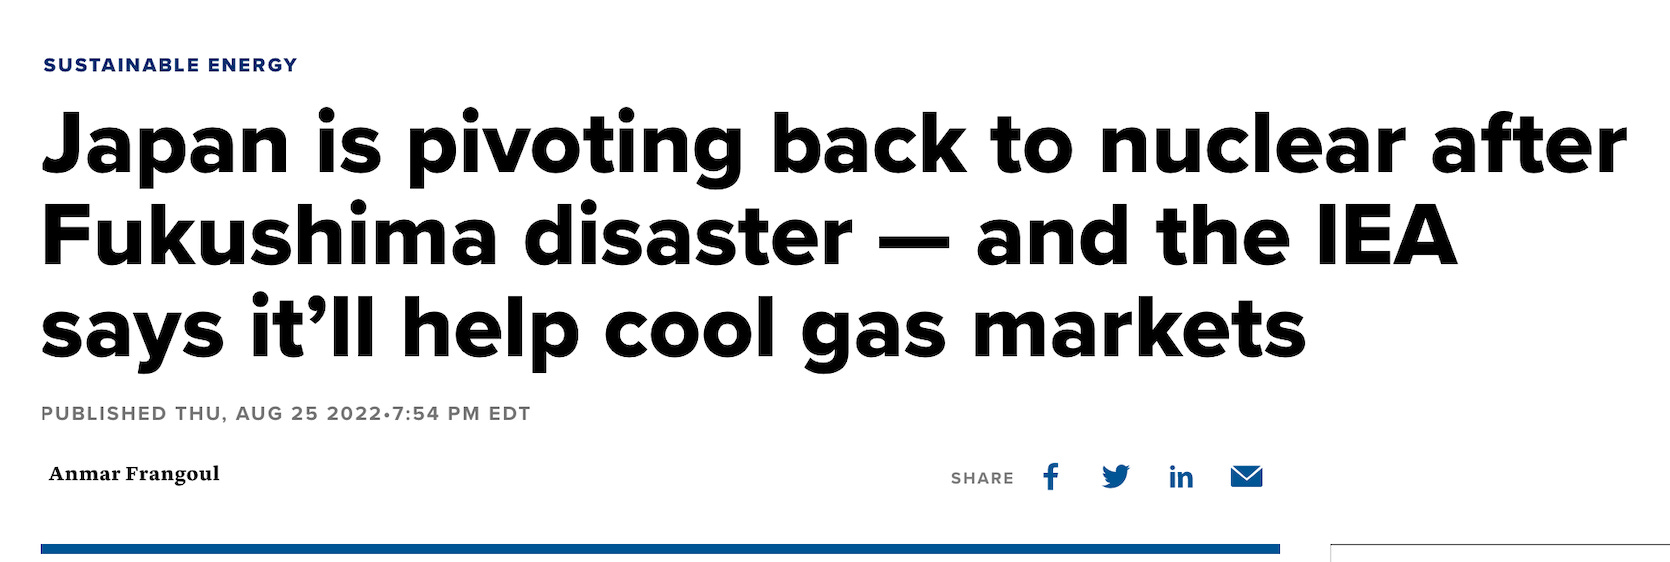
I’ve been thinking about this, I obviously want my best idea to work. 15 out of 16 thus far have, but going over charts from last week to see what emerged with strength in that horrible tape we had and I kept coming back to CCJ. I know I’ve been mentioning it for months, but this is too strong a setup and sector to ignore here. Headlines like the one below out of Japan recently have gotten CCJ rolling. After all, it is over 20% of the Uranium ETF, URA, but I’ve always said I’d prefer to own the best name in the ETF than the entire ETF which isn’t looking as good
Then we got a secondary headline out of Iran right after the Japan news
“IRAN HAS BEGUN ENRICHING URANIUM WITH ONE OF THREE CASCADES OF ADVANCED IR-6 CENTRIFUGES RECENTLY INSTALLED AT UNDERGROUND NATANZ PLANT”
and the “Nuclear” trade was on.
The Trade
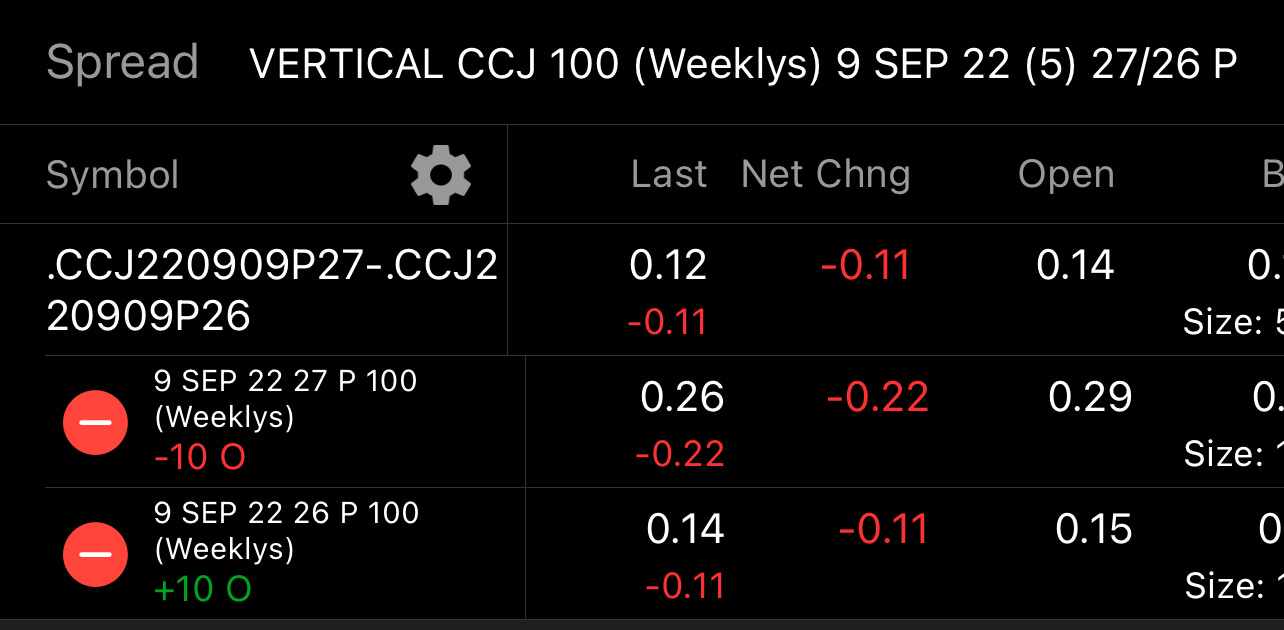
I like selling a 27/26 put spread for this week. That is selling the $27 put and buying the $26 put for a credit of .12 which leaves you with a near 14% return of .12 on .88 of risk.
I’m going to be aggressive here again
Because it’s a short week, only 4 days
Because CCJ is a name I don’t mind owning
The Charts
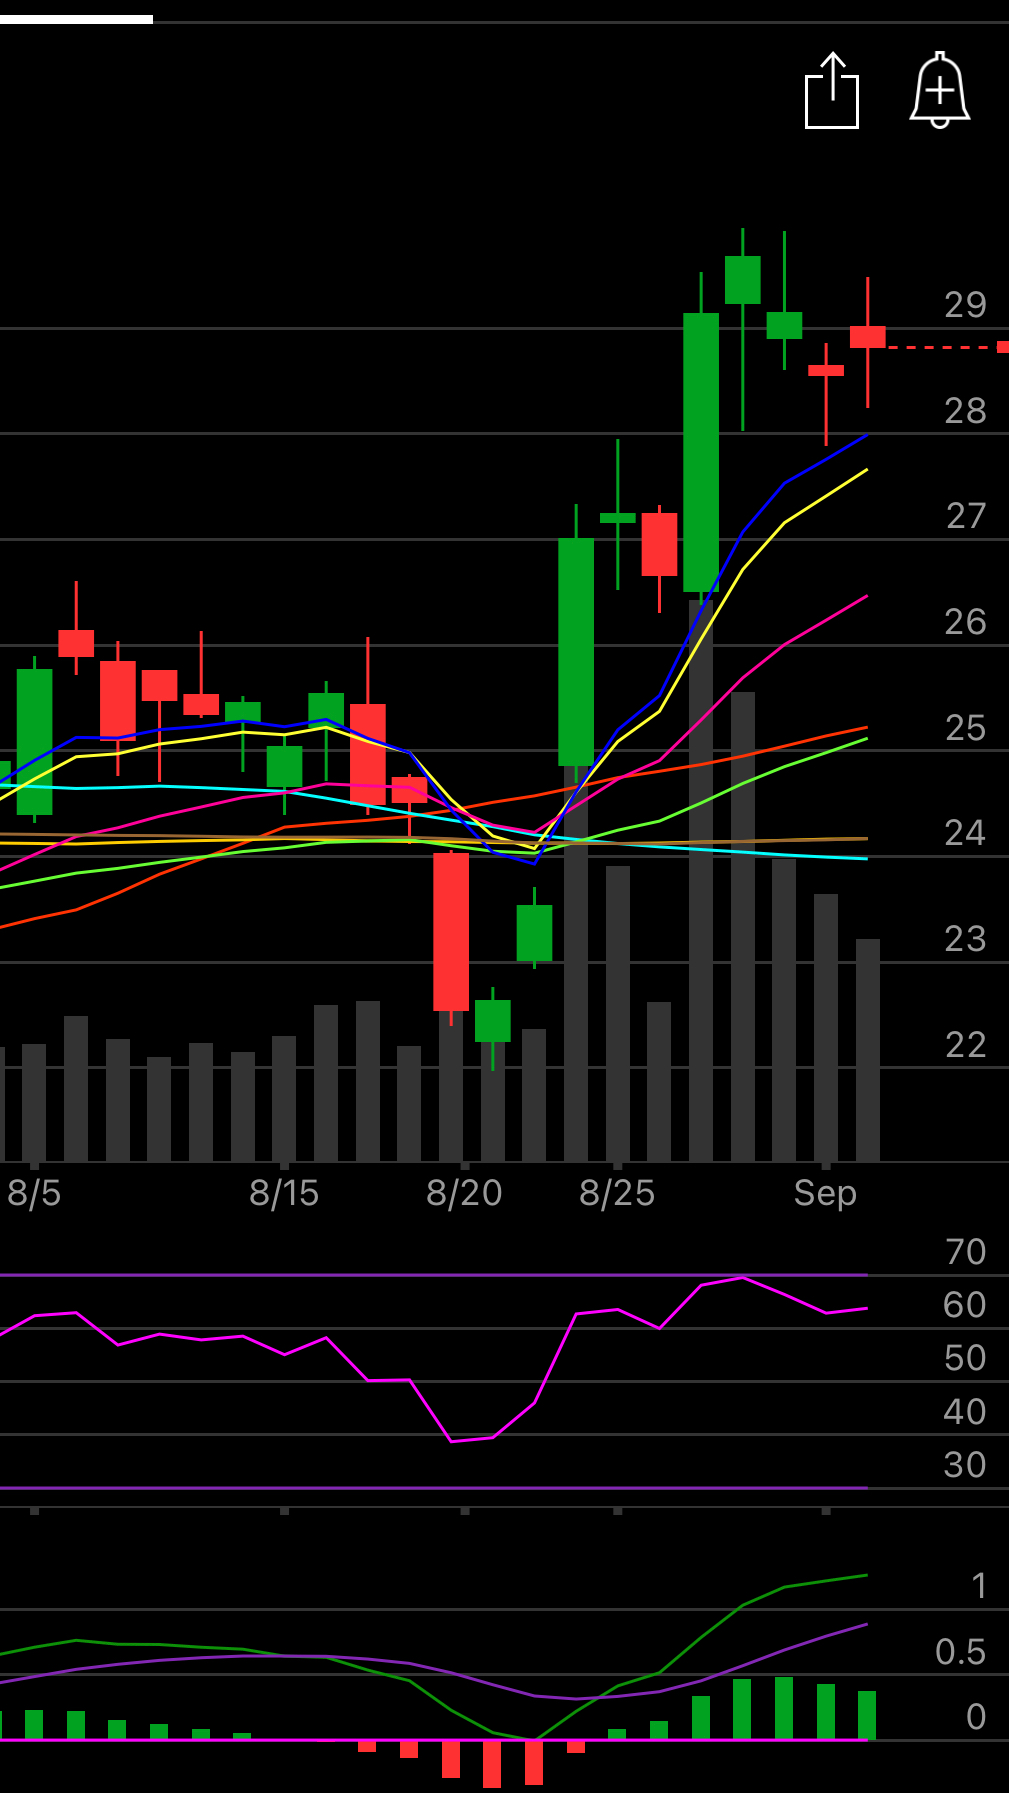
The daily shows lots of gaps below at sub 24 and sub 23. For the time being I am not concerned about those gaps on a 4 day trade in a name that is flagging on the daily above all the key moving averages. You can see the large bullish engulfing candle CCJ posted last monday.
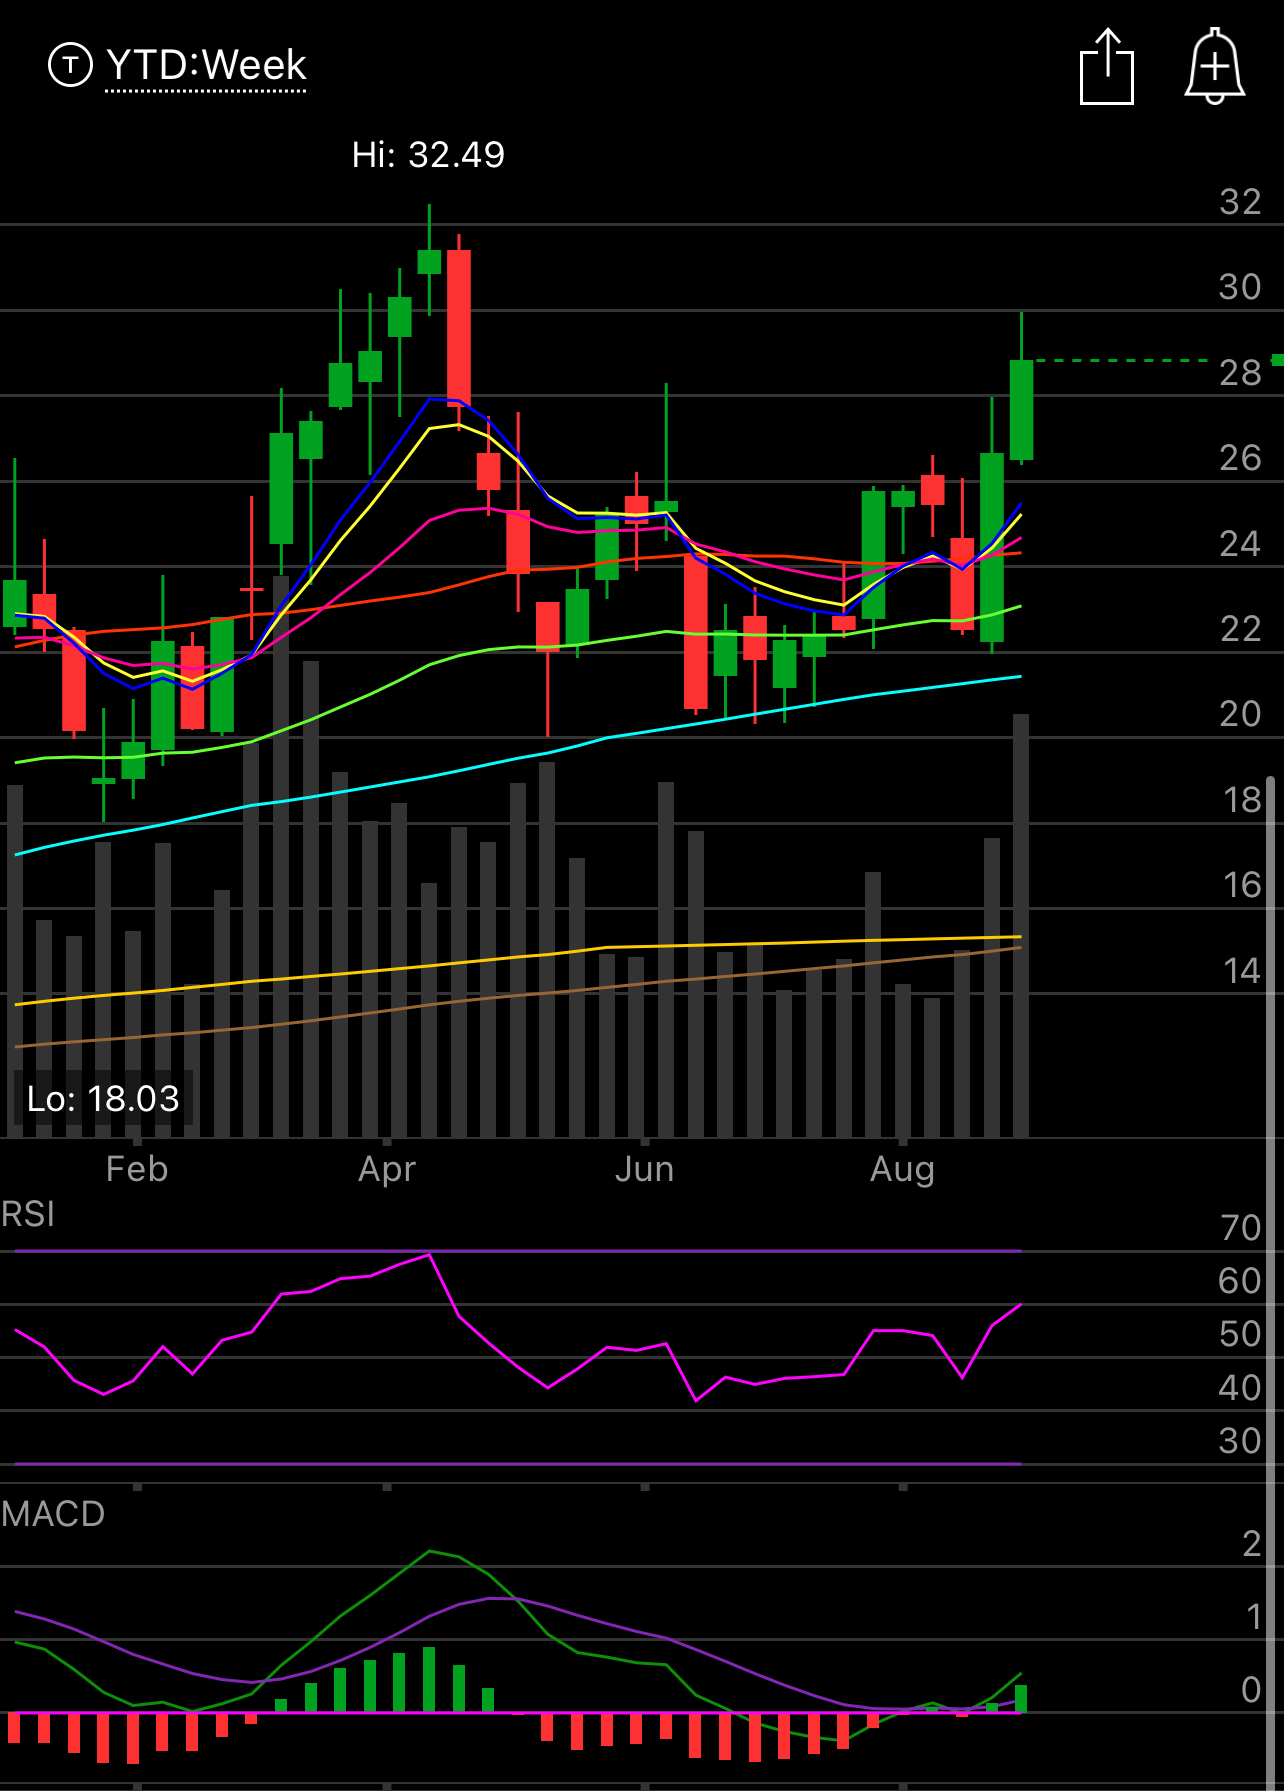
The Weekly shows a strong candle last week in an overall horrible tape in the market. This was a nice followup on the bullish engulfing it posted the previous week which also ended in a horrible sell off. There is alot of emerging strength here as people begin to position for this shift back to nuclear as the world watches Europe burn because of their poor, ESG based decision making which is now biting them in the ass as Russia decides their fate.
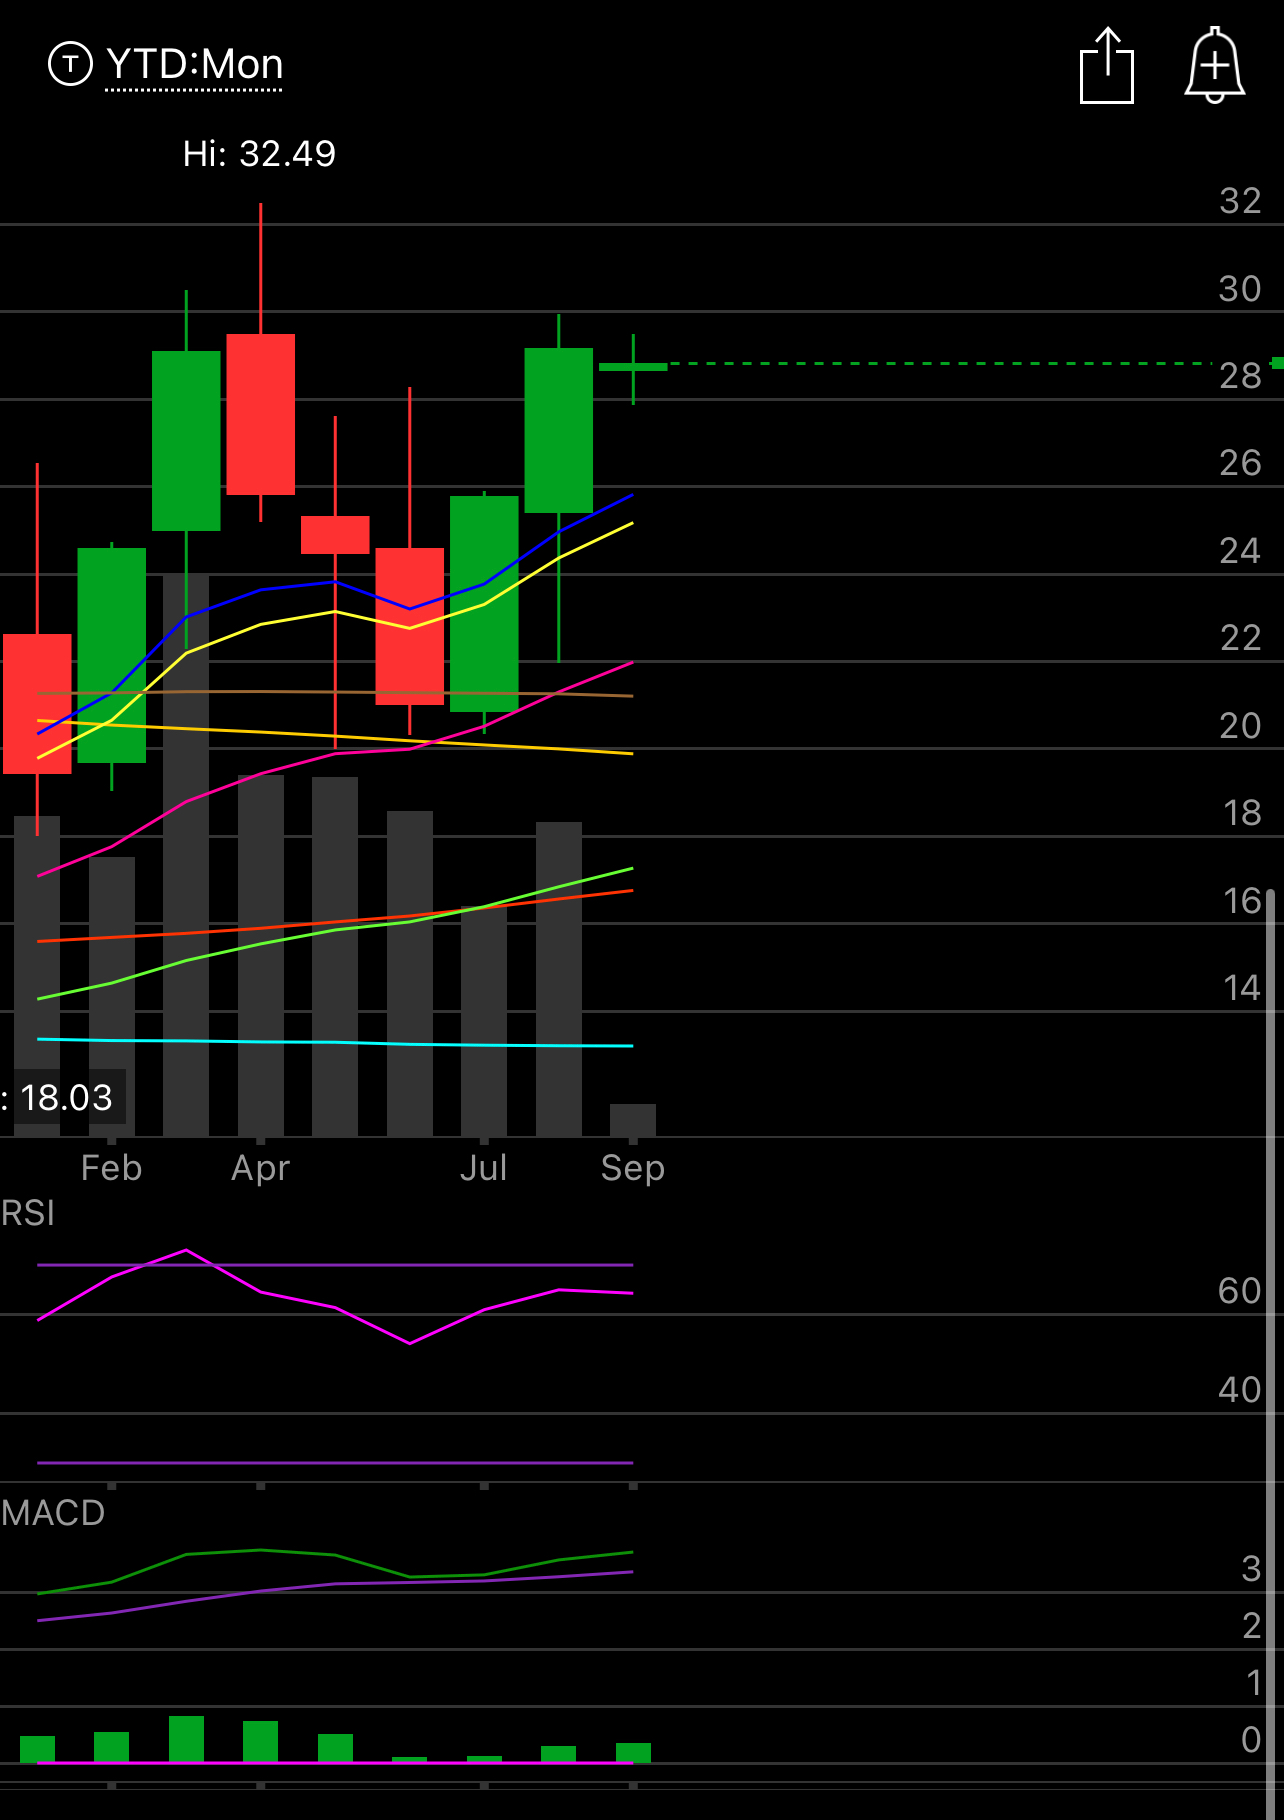
The Monthly also shows a bullish divergence with all the key moving averages sloping up with $26 looking like logical support this month. My trade targets a long at 26.88 so if I’m stuck with shares I can sell covered calls afterwards, hence my lack of concern getting put shares.
Unusual Options Action
There has been ALOT here. This past week alone
3900 January $43 Calls bought
15,000 Dec $31/37 Call spreads bought
5,300 October $30 Calls bought
Recently there have been other massive trades including
5000 ITM March $15 calls bought 2 weeks ago
9500 October $25 calls bought
1200 Dec $22 calls bought
15,000 September $20 puts sold
There’s plenty more but those were the ones that stood out to me very recently. The options flow in the name is very bullish and you know my philosophy, in the market, the hierarchy of importance is
Options Flow
Charts
Fundamentals
As long as you embrace the rules of the game, the game will become easier to play over time.
Enjoy the rest of your weekend!
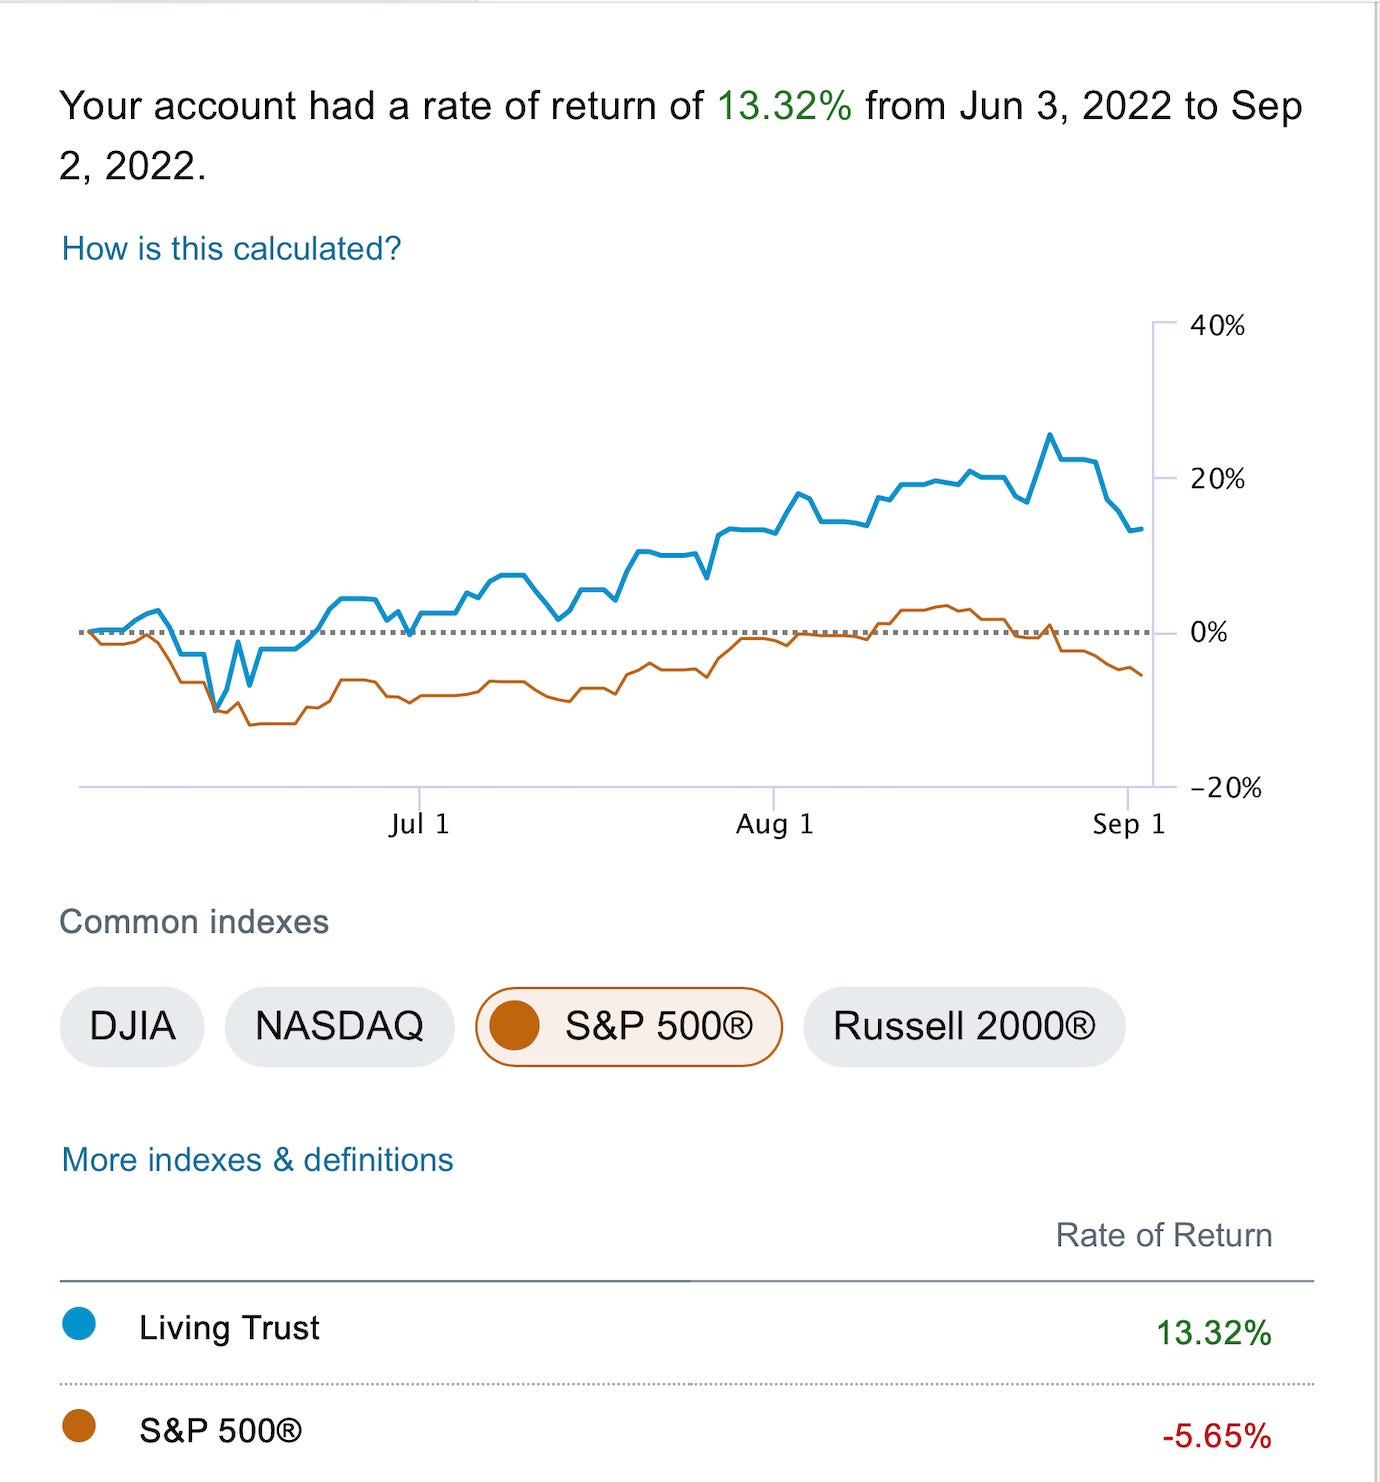
PS -someone asked me about my comment yesterday in regards to outperforming the market by 20% since I started this substack, this is what I was referring to, even after getting dinged a little this past week, I’m still up 13.32% since June 3 vs a -5.65% return for the market in that timeframe. That is using Schwab’s rate of return for the last 3 months tool.