

The SPY continues up and to the right, as I’ve been telling you everyday for weeks now, there really isn’t much context for me to add because you can easily look at the chart below and see we’ve just risen along this 8 ema since the ceasefire. We’re had 1 close below it in basically 2 months, this is just a very strong uptrend and discussing all the how and why is irrelevant. Price action is truth and until we violate that 8 ema and head towards the 21 ema for a real test, there isn’t much to say other than book gains where you want because we’re overextended but also realize this uptrend can go on for a long time and until we first lose that 8 ema, the dark blue line, there isn’t much to pontificate about.
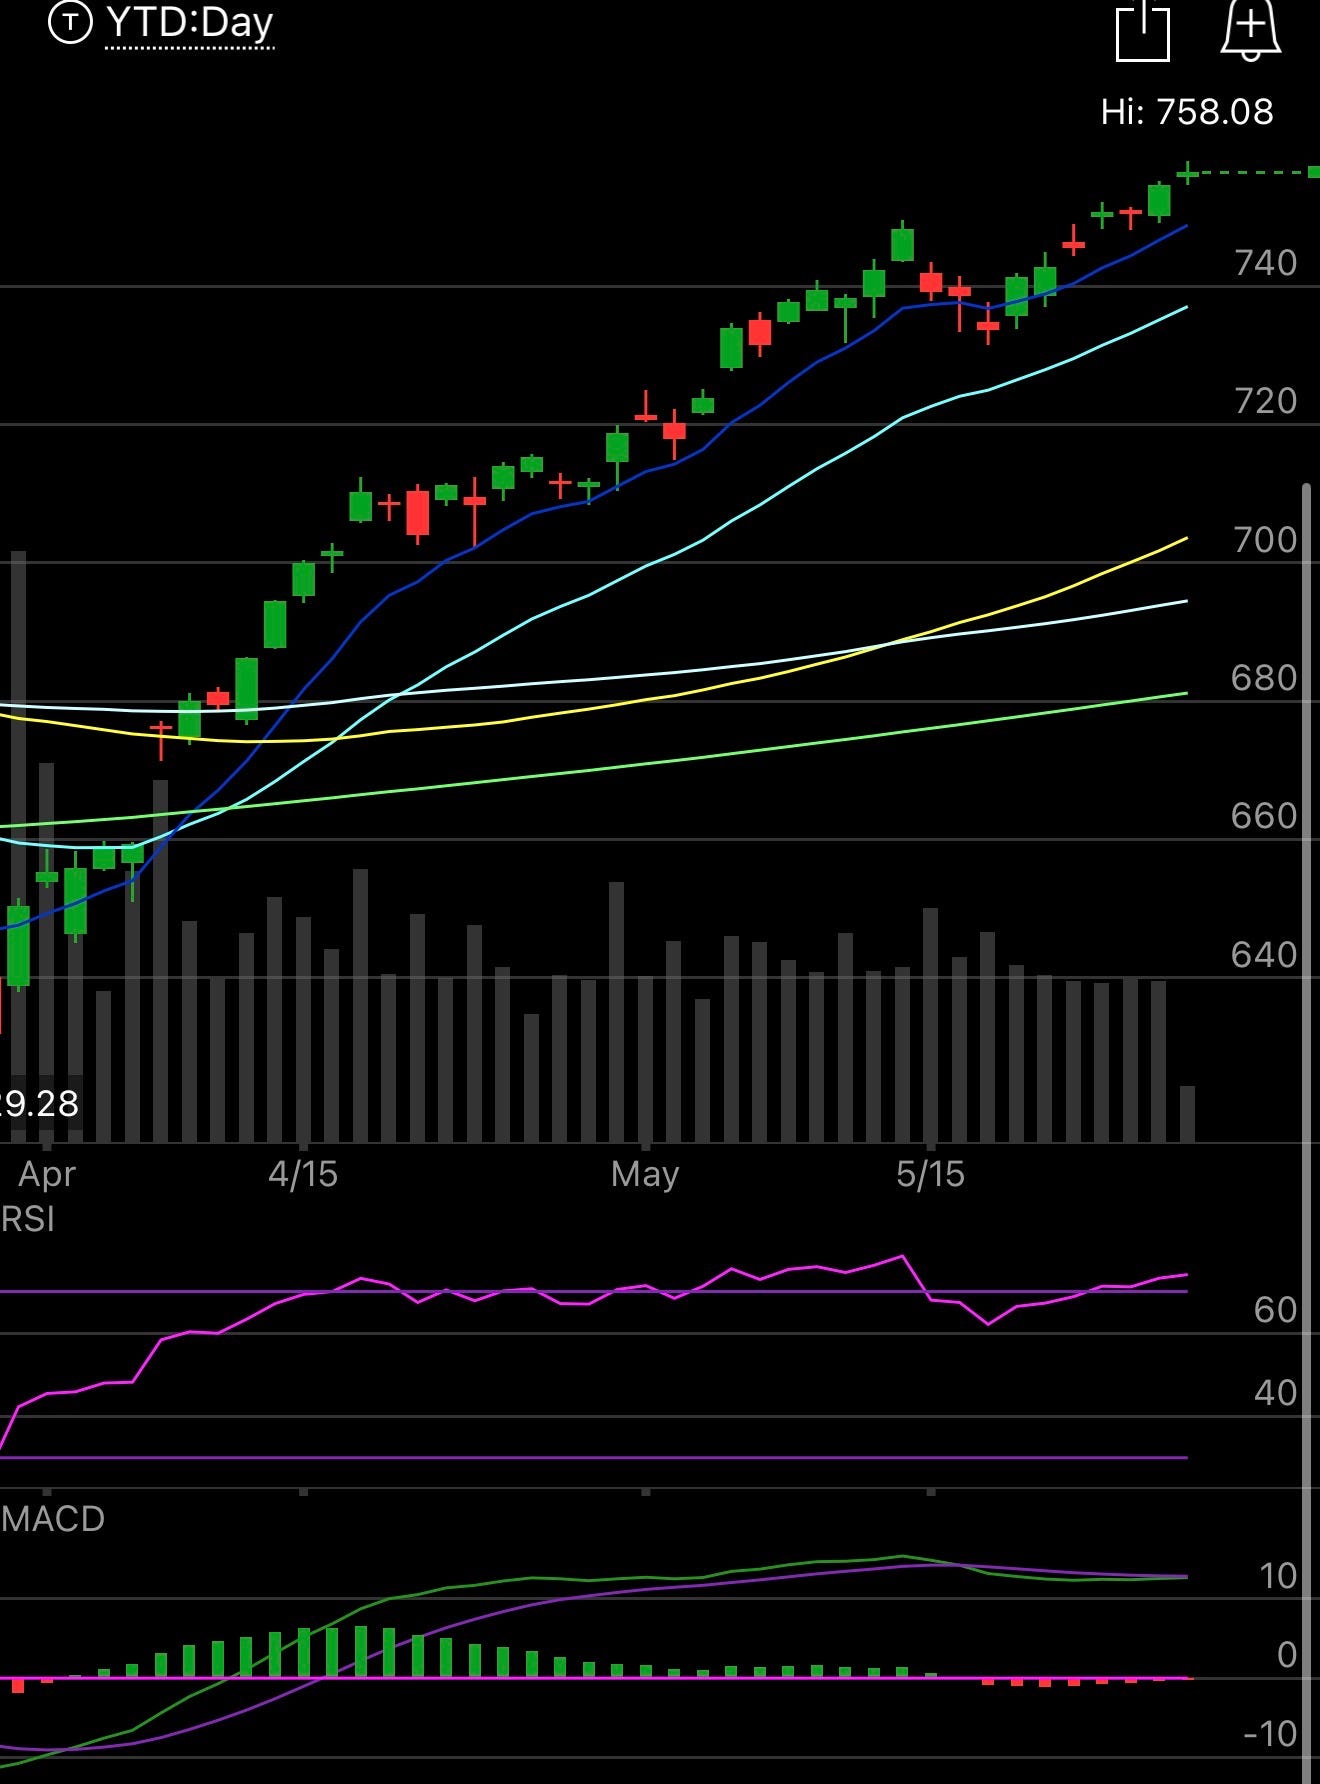
I think the most important thing you can take from me is I don’t waste your time with thesis’ on the how or why. The chart above is just being bought that’s it, all the fundamental stuff you thought was important is less important than you ever believed. The charts and option flow are the truth and whatever fundamental story you believe is baked into the chart. Why does a chart look good? Because mine is piling into it. The same can be said for why a chart looks bad. The option flow is the second layer that confirms that thesis which is why you see things like MSFT and the move today after I highlighted it yesterday or IBM with the weekend best idea on Sunday and subsequent 15% move this week. This game is far less complex than people make it out to be, you just have to understand how it works and know that what you think about names is completely irrelevant. What is relevant is the flow of money and always trying to be in what is being bought, that’s it.
Database Changes
Again I ask if you find any issues or mistakes this weekend please let me know. DM me on discord/twitter because I take all the mistakes and immediately start working on the next version fixing them. I finally got to a point now where I’d say I’m 95% satisfied with where we stand. One of the hardest things was getting it to build trades that fit for everyone. I realized early on that I couldn’t have it suggesting put sales on a $800 stock like MU because not everyone has that sort of margin available. I think right now we’re in a good place where it only suggests defined risk trades meaning everything is put spread or call spread. That way it fits all budgets. If you’re someone with a bigger book and higher risk tolerance maybe you just sell the puts naked without the put buy to protect you. Whatever it is the logic is in the description below along with the audit I use to make sure it followed all my rules. You will know its the latest version by seeing v6.3 in the bottom corner. If you go back a few days you will see v3 or v4 and those are not as good. It also costs an arm and a leg to refresh hundreds of tickers with the latest version so it will only work on trades from here on out as I log them.
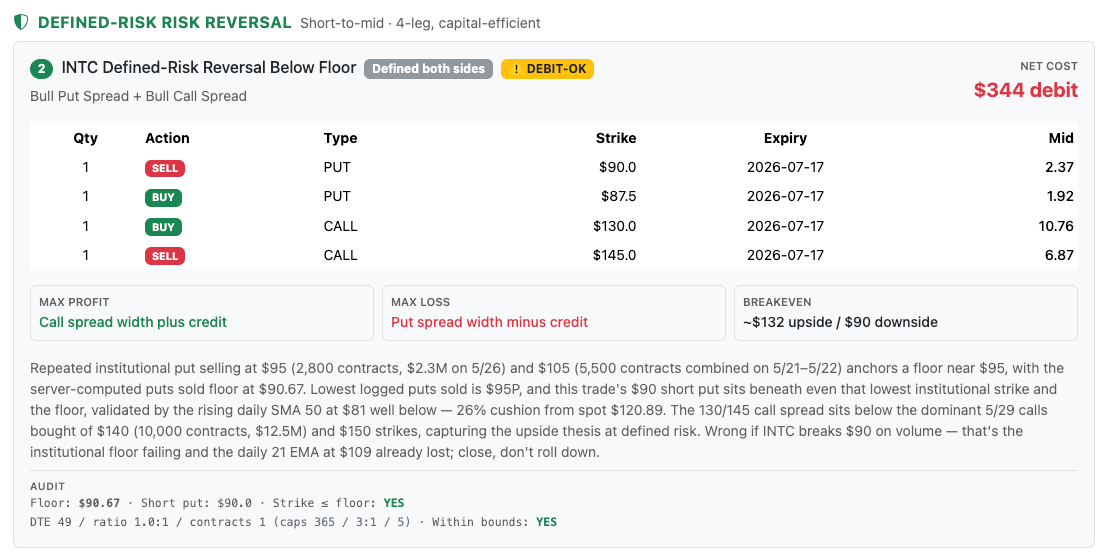
You will also notice many names in the database the AI wasn’t able to build a trade and I’m ok with it because I’d rather my rules be followed than it just build whatever it wants. The goal is to have all these trades is to use my database and explain the logic of why this particular trade was built. In the case of the INTC trade below you can see
“Repeated institutional put selling at $95 (2,800 contracts, $2.3M on 5/26) and $105 (5,500 contracts combined on 5/21–5/22) anchors a floor near $95, with the server-computed puts sold floor at $90.67. Lowest logged puts sold is $95P, and this trade's $90 short put sits beneath even that lowest institutional strike and the floor, validated by the rising daily SMA 50 at $81 well below — 26% cushion from spot $120.89. The 130/145 call spread sits below the dominant 5/29 calls bought of $140 (10,000 contracts, $12.5M) and $150 strikes, capturing the upside thesis at defined risk. Wrong if INTC breaks $90 on volume — that's the institutional floor failing and the daily 21 EMA at $109 already lost; close, don't roll down.”
It took the multiple put sales at 95 in the database and built a put spread to sell below that. Why? Well we know from this that the put sale win rate of my database is 80% so selling puts with a little better edge improves those odds dramatically. Then it looks all over for moving averages to align with how I think about trades and it’s pretty much downloading how I think about option flow/charts and taking it to every ticker in the database. As I continue to tweak this it will get better, this is still 5 days in with it live. The improvement from monday to now is enormous. By next friday it will be significantly better.
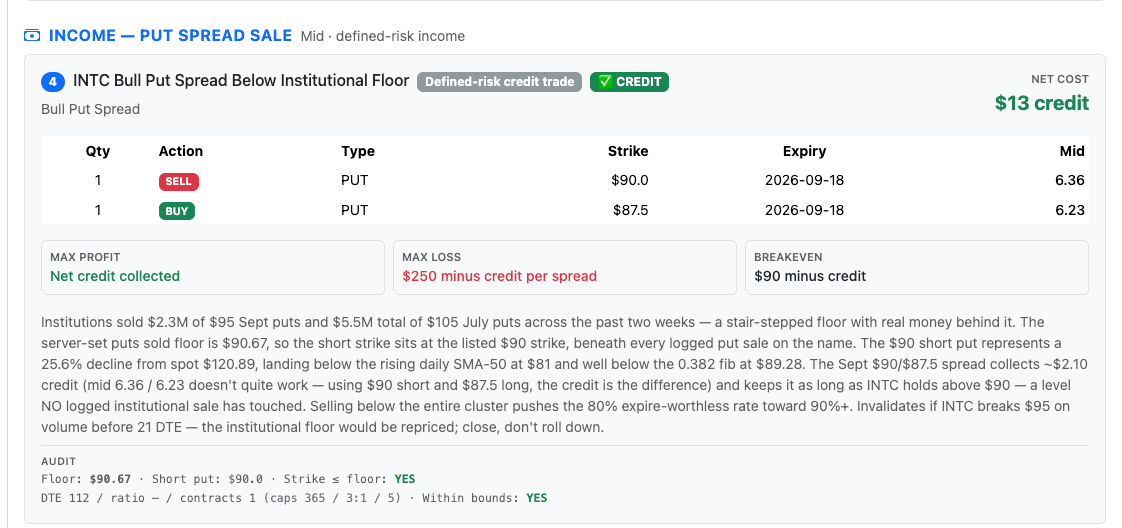
If you’re an income trader I attempt to drive an income trade on every name but again if the parameters don’t fit what I’m looking for it will tell you there is no trade and that’s ok, not every name has to be one where you can sell puts.
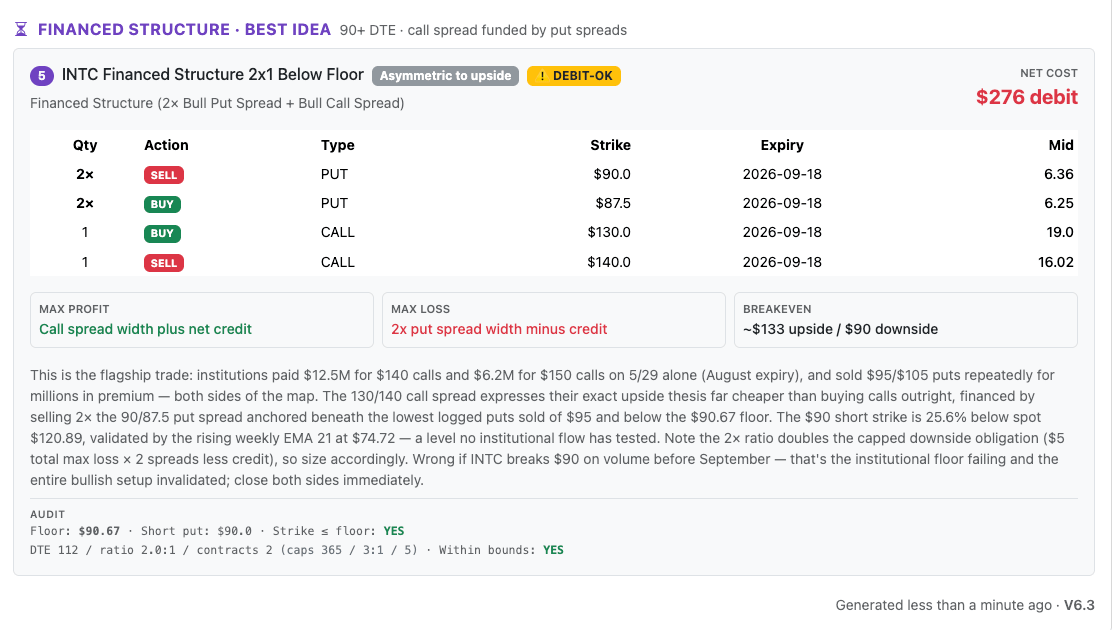
And lastly the “best idea” if applicable is always going to be a 2x1 ratio because that is my favorite structure because it allows you to sell 2 puts at key spots to finance the call buys. Again these are just the basis for your trade idea, you can always tweak the numbers and turn it into a bigger credit/debit whatever you want really but this should help you with levels of interest much quicker.
My Open Book
