6/11 Recap
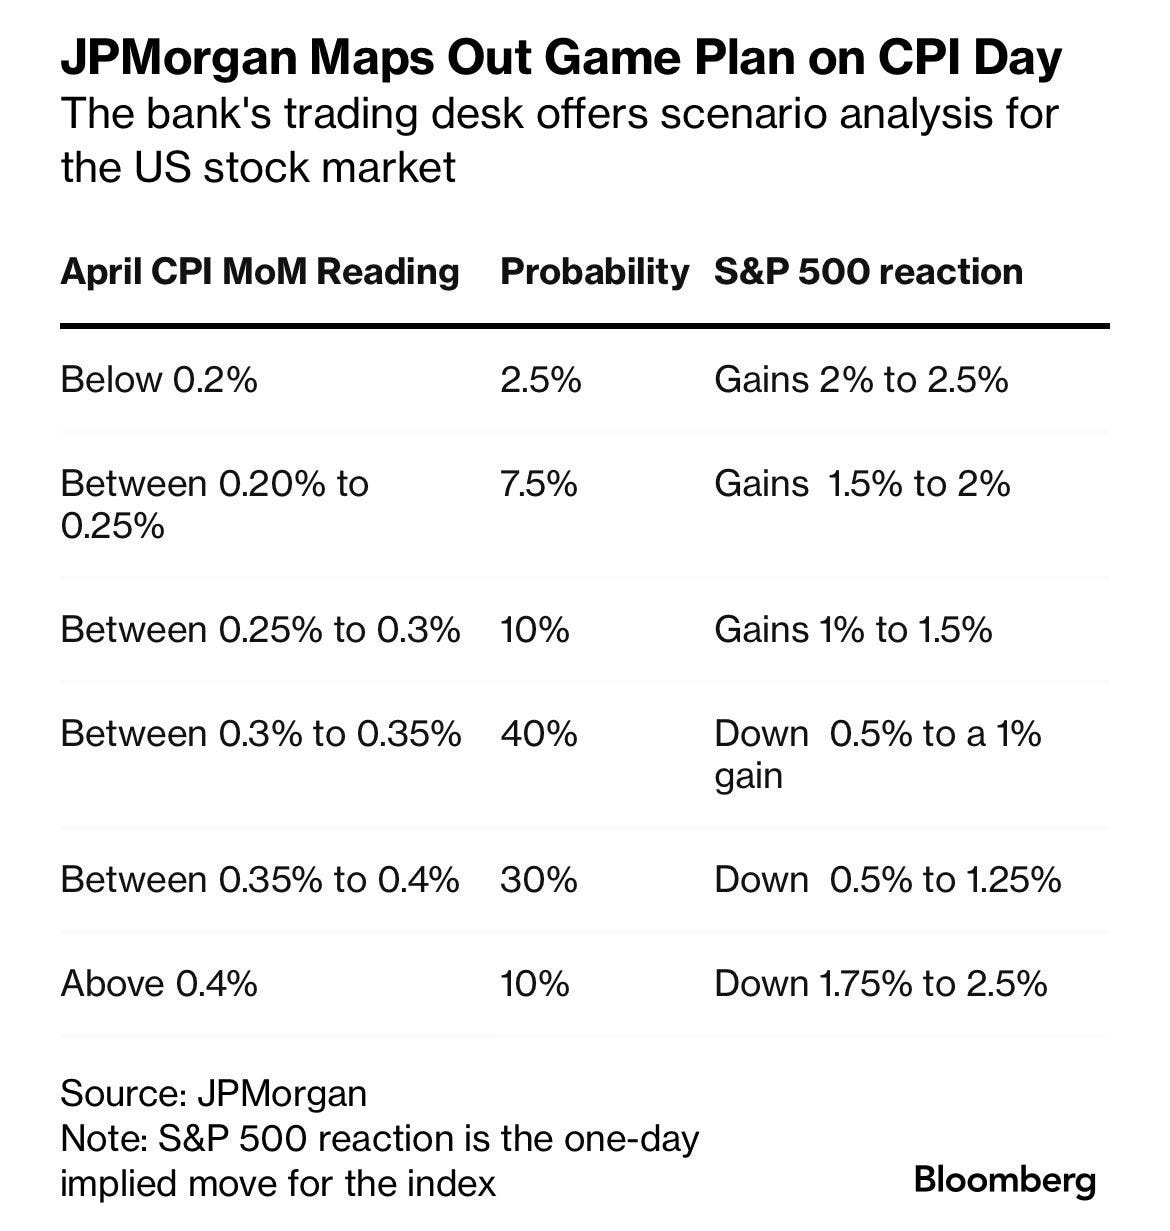
We all await CPI tomorrow morning, nothing really notable in the overall market so no sense discussing charts, tomorrow will give us a better guide on direction after we some data. Here is the road map for the data tomorrow courtesy of JPM if you want to place your bets.
Recent Trades
I have 2 to discuss today, one longer term one and one from yesterday’s recap.
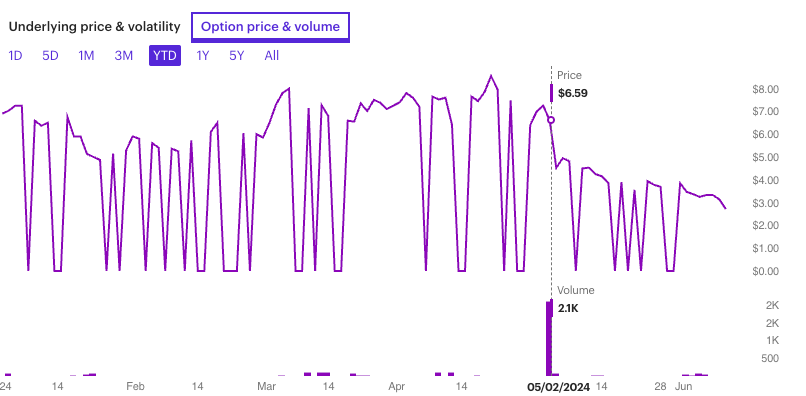
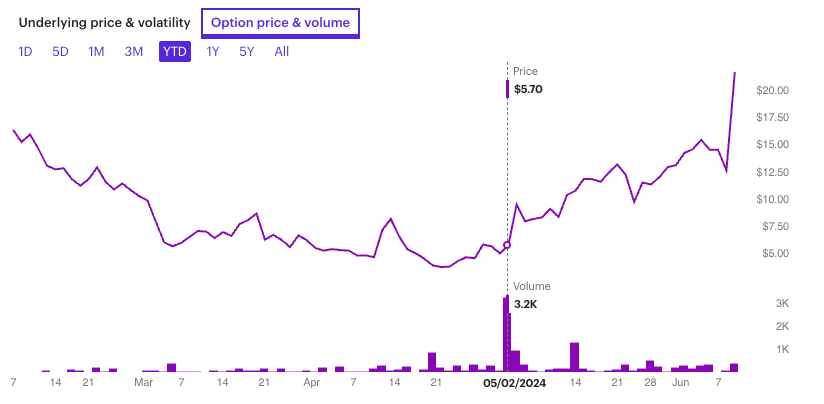
Today was a monster breakout from Apple, they had their WWDC yesterday and the market loved it once they had time to digest how big this upgrade cycle would be. If you remember I highlighted a big risk reversal on Apple on 5/2 here when someone put on a very big trade moments before earnings that was targeting October 2024 calls. The name has gone from 170 to 204 in just over a month since.
Those puts were sold for 6.59 see the volume bar here on May 2, they’re 2.90 now
The calls were bought for 5.70 they’re now 21.60 in a month.
That was an incredible trade and very well done by whoever drew it up. I hope you’re slowly seeing the immense potential involved when you add that 1 extra layer to your directional call buys with the sale of some puts.
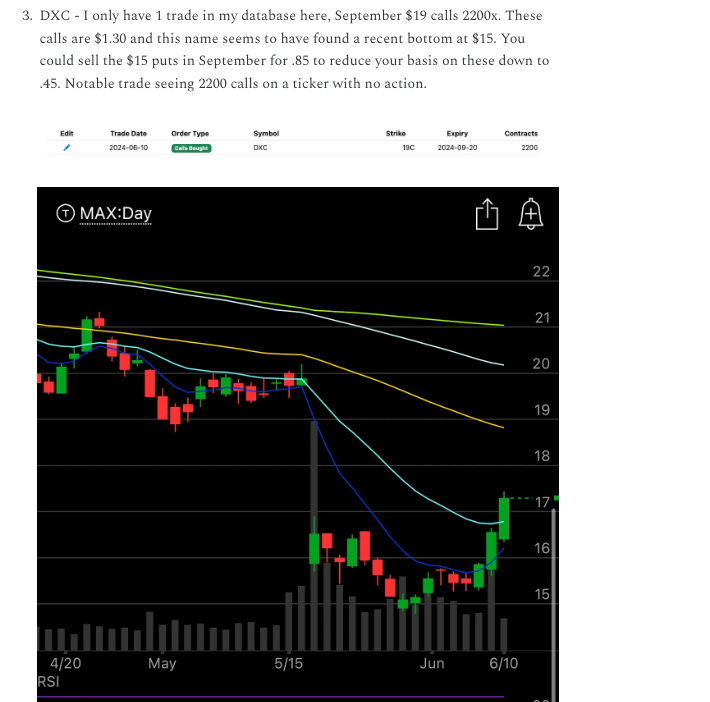
The other is DXC, this was really dirty, yesterday in the session I wrote this up.
In the final 15 minutes of the day, a rumor emerged from Reuters that Apollo was part of a joint bid to take them private at 22-25 and you can see the candle below. The stock got as high as 19.47 and has sold off a bit today to 18.30 right now. Those September 19 calls from yesterday are up over 100% right now. Does a deal happen by September, I don’t know, but Reuters is a reputable source. If you took these yesterday I’d look to sell today, 100% move in 24 hours is plenty on an obscure name like this, you can’t ask for any more.
Trends
Alot of you new people ask me what this is and simply put, this is just aggregate scores of trades in the database. The bullish trades minus bearish trades and the opposite. The point of this is for you to see what names are heating up, inside the database link I post everyday you can click the rankings tab and click each name and see each trade individually to help you visualize what is going on and help you see what levels you want to use in building your trades. It’s just a simple way to look at various timeframes and see where the big money action is flowing.
1 Week
2 Week
1 Month
Today’s Unusual Options Flow
Here is today’s link to the database, there’s alot more in the table inside that didn’t fit here. I will have the rest of the today’s trades in by tonight, I’m really sorry I usually have them in by the afternoon but as you know these last 2 weeks I’ve been going over to see my dad in the hospital everyday when I wrap up.


