
Where We Stand

Like last week, I will make this market post public so you can share it as you please.
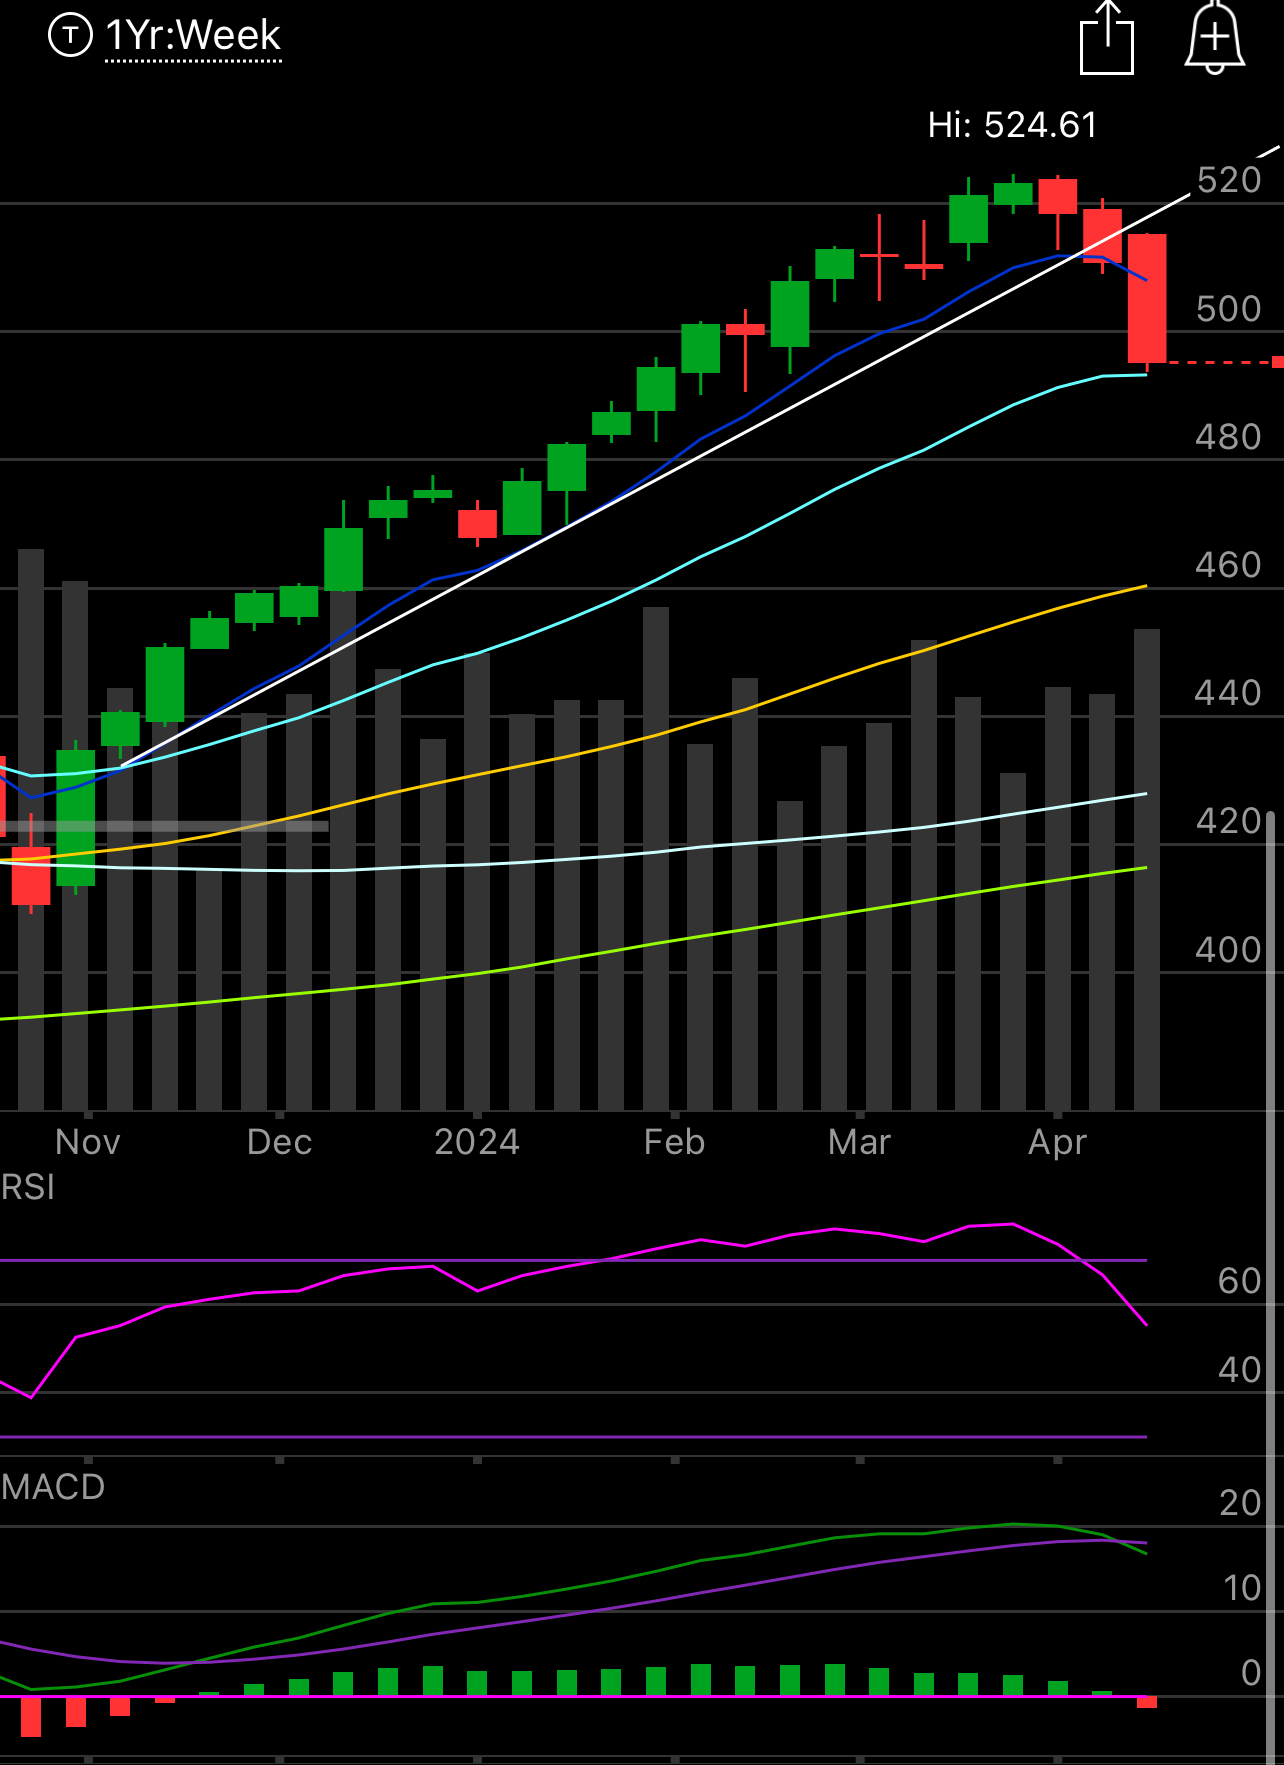
I know alot of you are in panic right now and there is really no need for it. Last week when we broke trend, the warning was set, we followed up that warning with a sell off. The old saying of “stairs up, elevator down” was more true than ever this week. That is why I told you all multiple times in the last 2 weeks to please close up short term calls and just let this little period of weakness unfold. It was clear as day that the uptrend broke. Now you can see the macd flipped red and the market had its move lower. Now we probably have a sustained period of weakness.
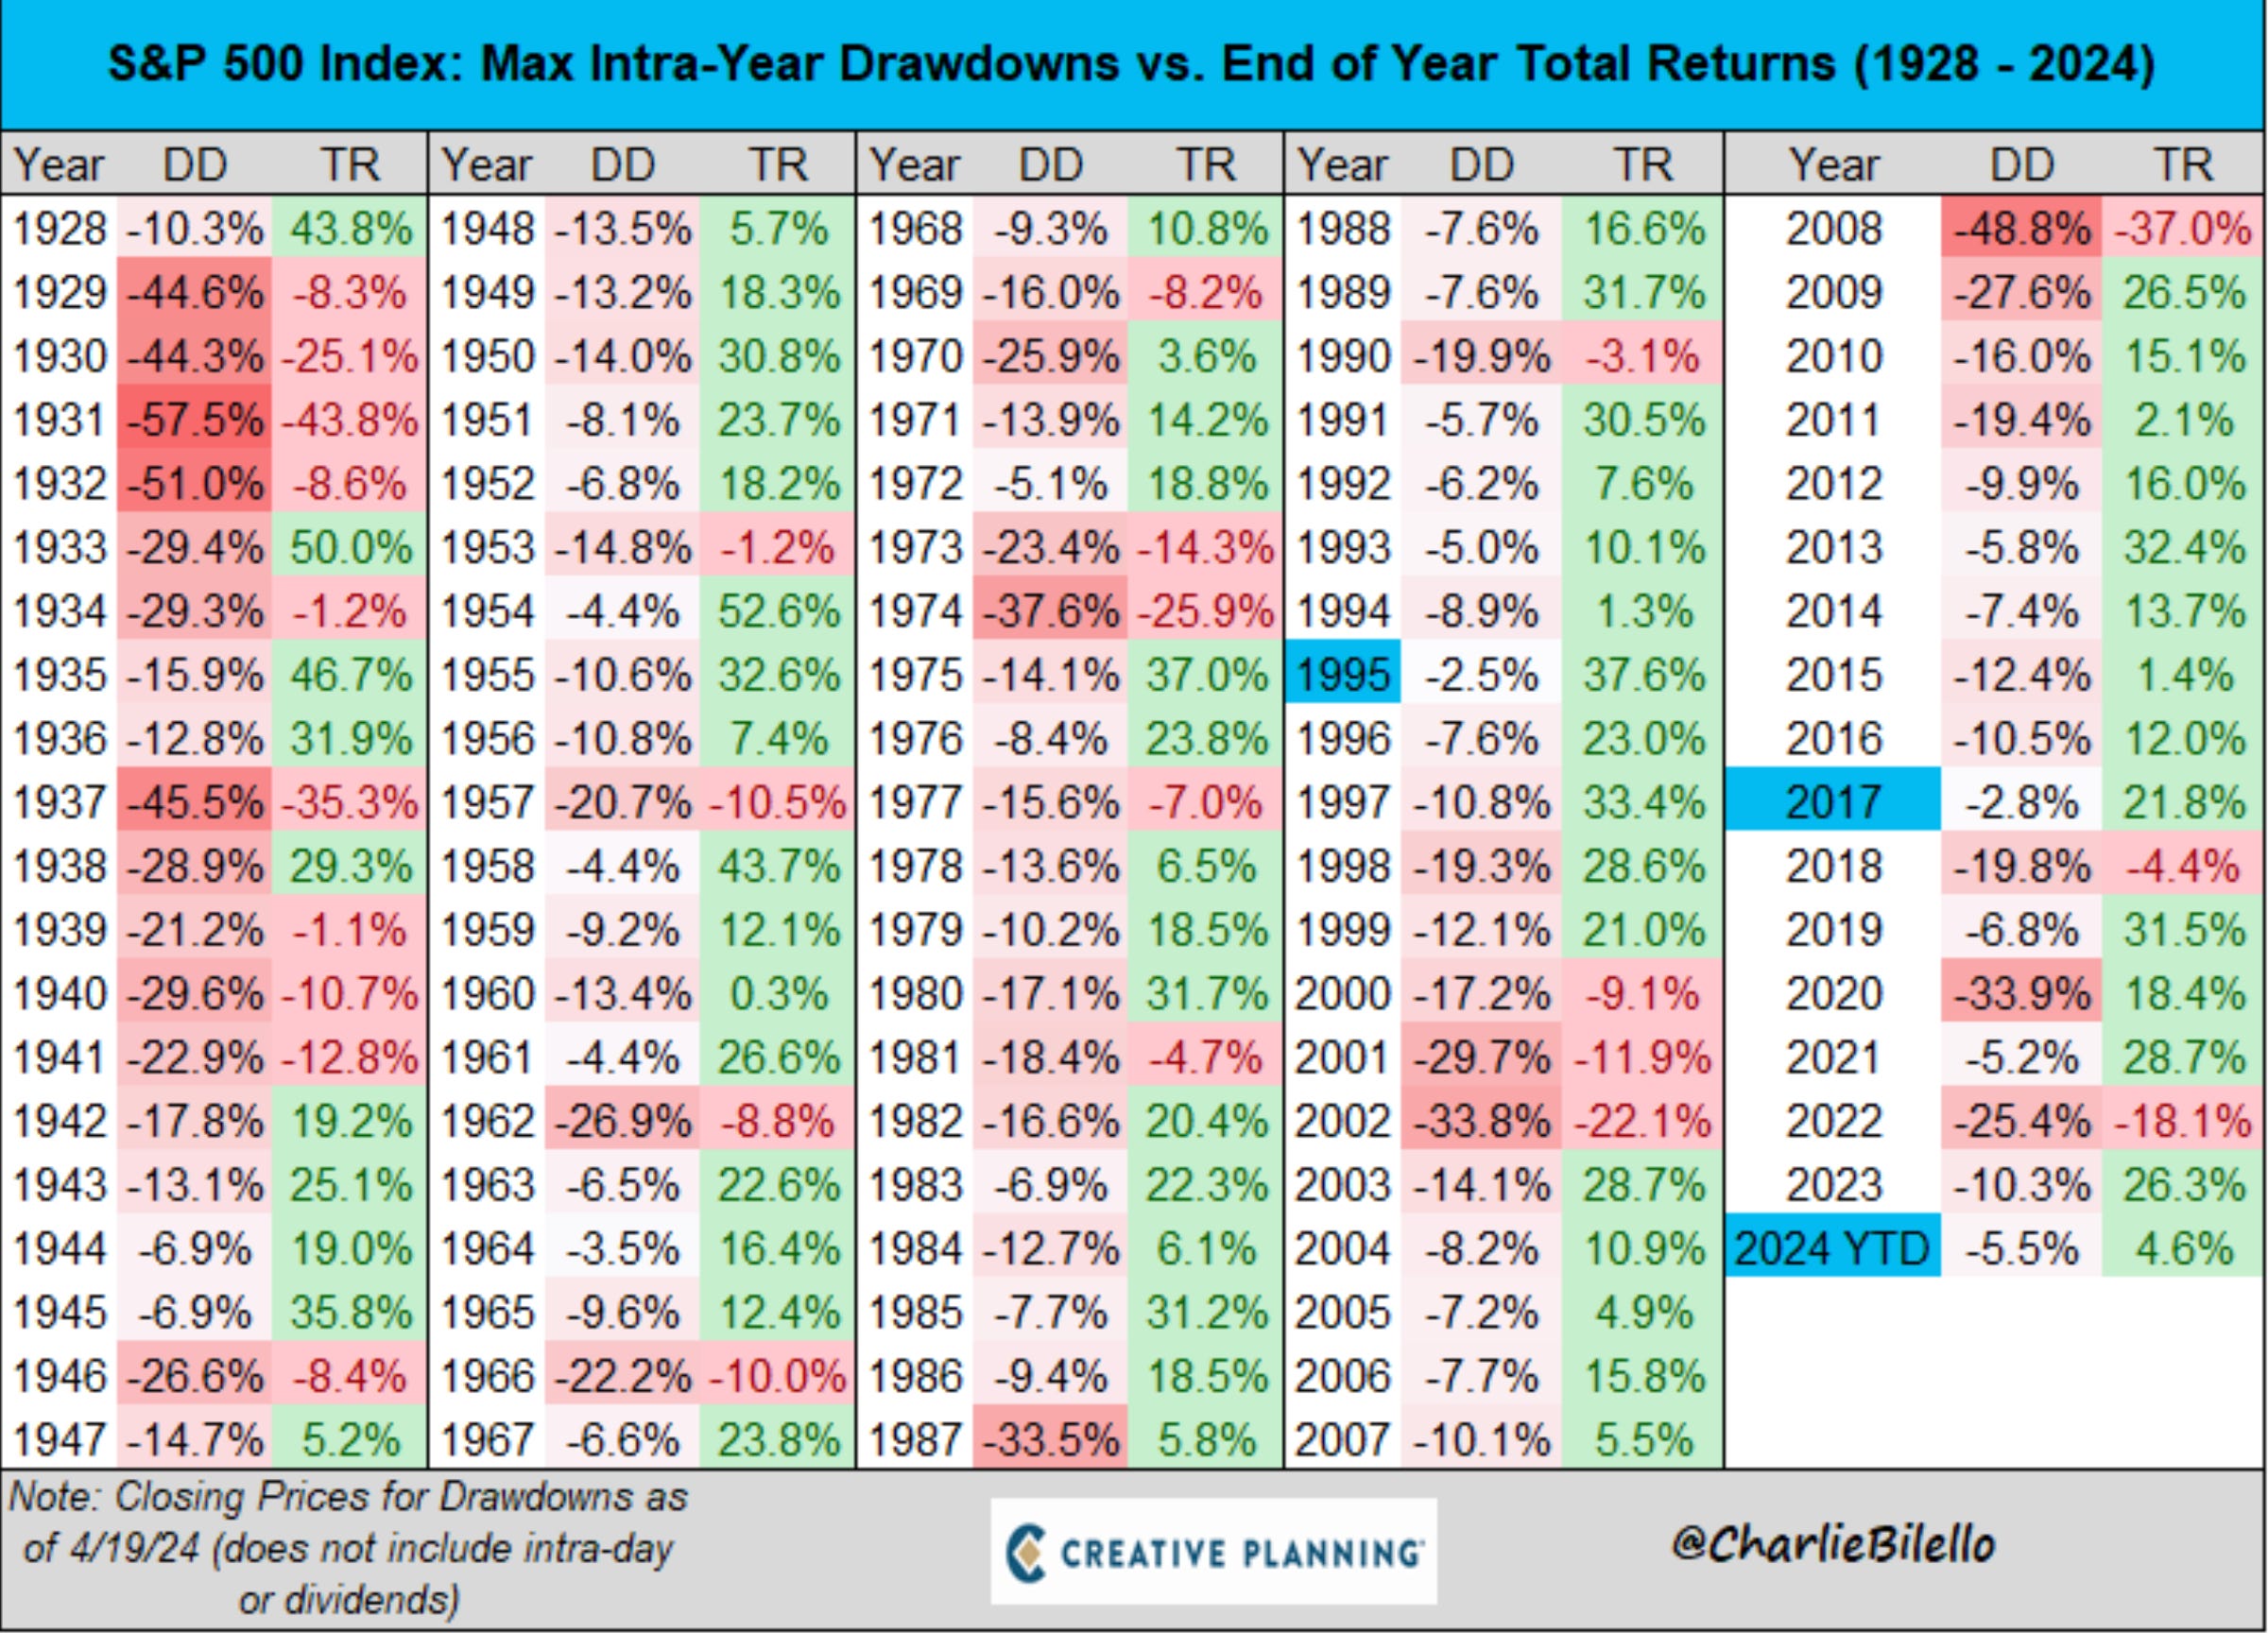
This chart below from Charlie Bilello shows you the max drawdowns in the market every year since 1928. We are now in a 5.5% decline with the market only up 4.6% now on the year. You can see how many times we’ve had bigger declines and still ended up much higher on the year.
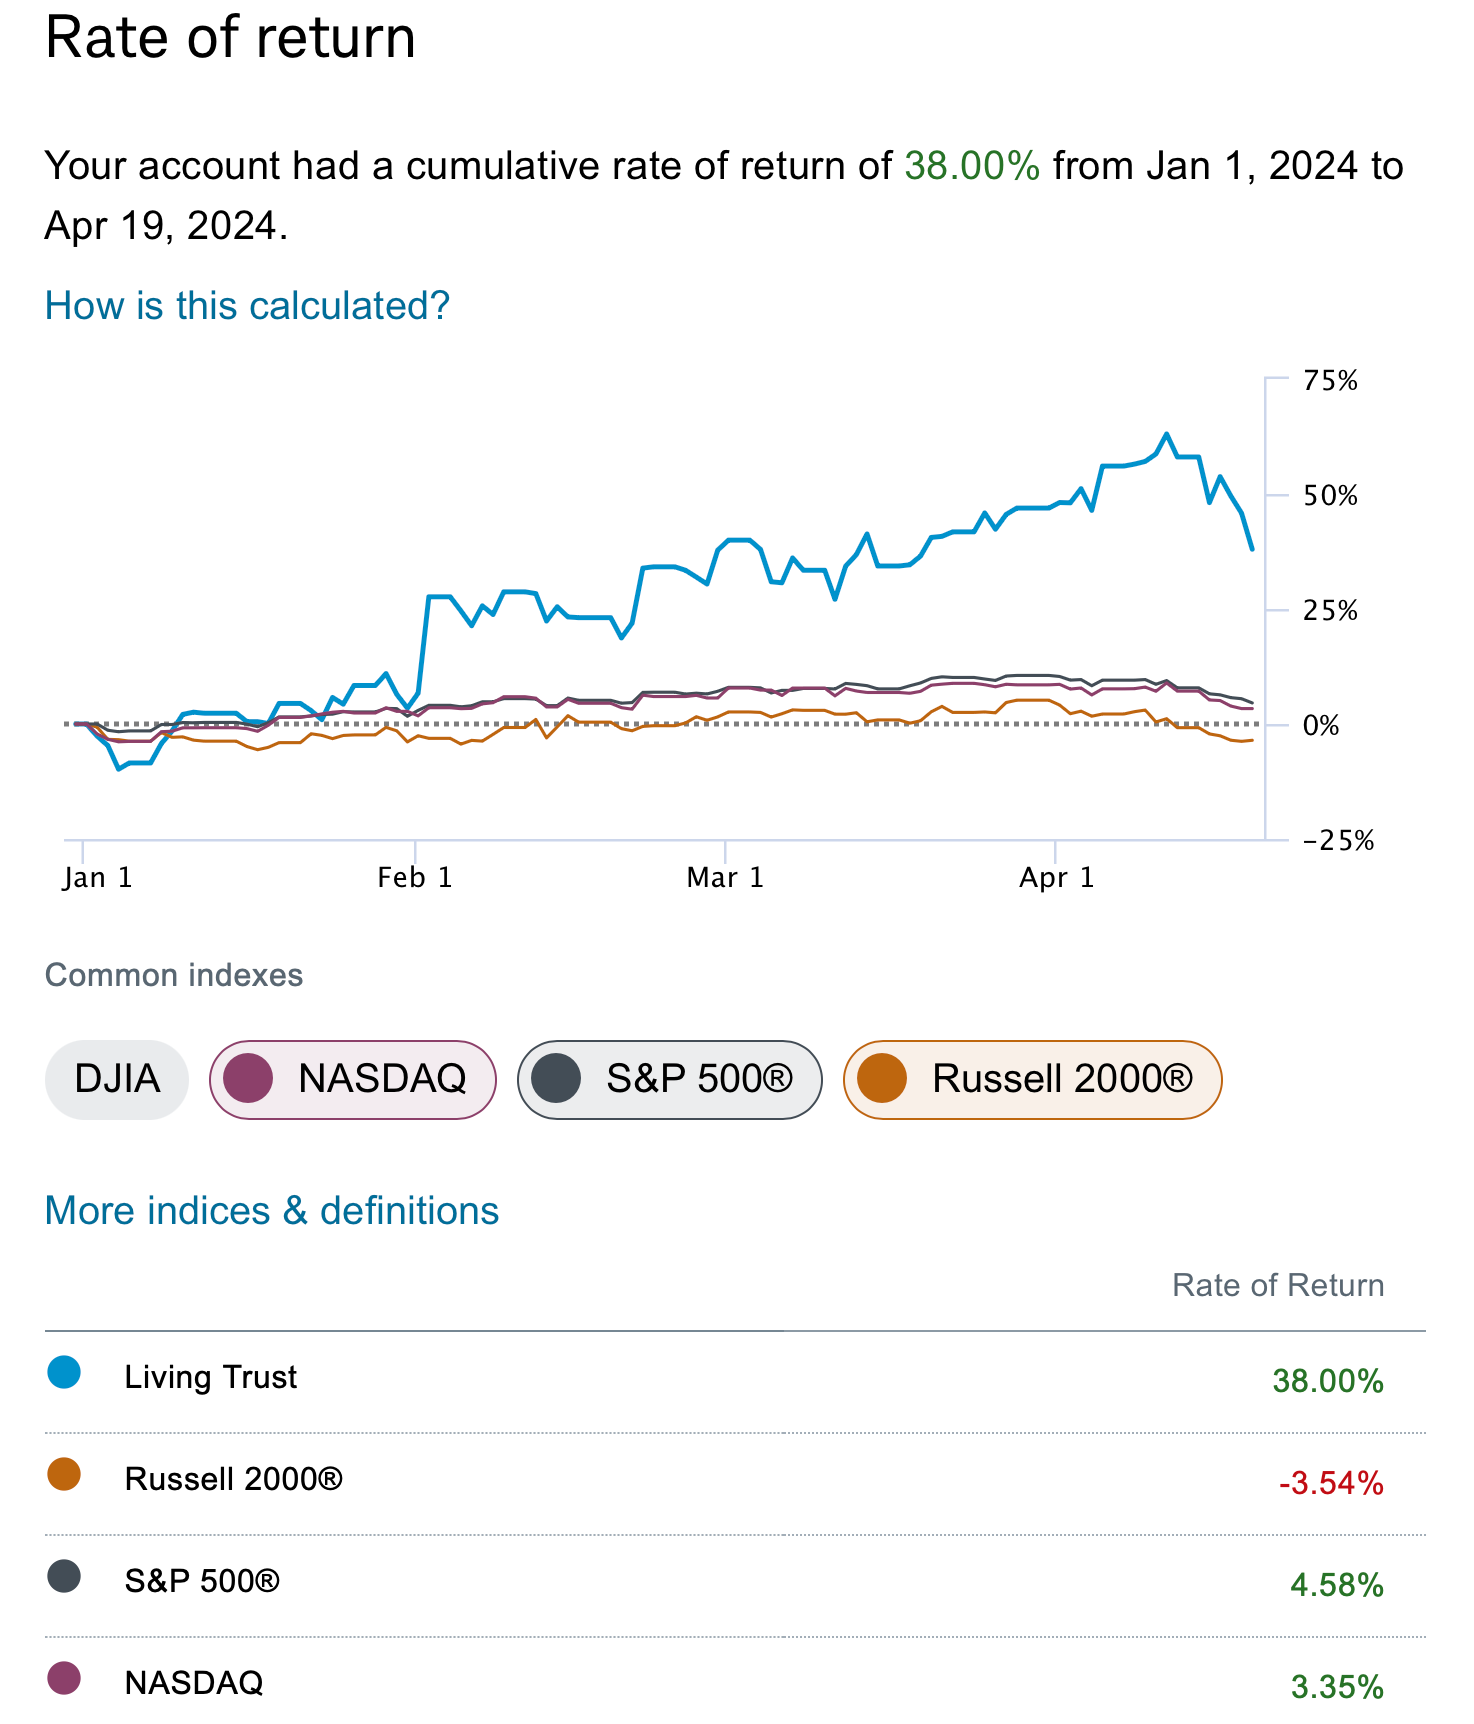
I see alot of your messages worried about what you’ve lost in the last 10 days and my answer to you all is, step back and have a look at your returns vs the market this year. I do not like judging myself on small timeframes but since so many of you insist on it, just look, I bet most of you are beating the market handily this year. I know I just glanced at my YTD and I’m still up 38% vs 4.6% for the SPX and 3.4% for the NQ. So in my world, anytime you can be long a Nasdaq component like I am, Amazon, with leverage, and still be beating the /NQ by 11x, you’re doing ok. The last week was not fun, but it isn’t like I’m now suddenly underperforming the market for the year.
Just remember your goal is simply to beat the market, that’s it. That’s everyone’s goal, many great professionals don’t beat the market, so if you’re doing that over the last say 12 or 24 months, pat yourself on the back and don’t fret. These pullbacks happen, they’re perfectly normal, and there is nothing to panic over as long as you remain in high quality names and most importantly not in any short term calls.
Where Does The Pain End?
The post from last weekend here shows you all the recent market corrections since 2018. Not one of them stopped after 1 or 2 weeks, so please get that out of your head. I saw alot of people saying we should bounce next week and while it is likely we see a small bounce just because this move down was so sharp, I wouldn’t be looking for an overall sustained market bounce right now. The technical damage done right now takes time to repair. We went straight up for 6 months, I don’t think 2 weeks of pain is where it ends. Again, it could, but past history doesn’t favor that.
So now we await the first batch of earnings from large cap tech this week. Here is the market calendar for the week ahead
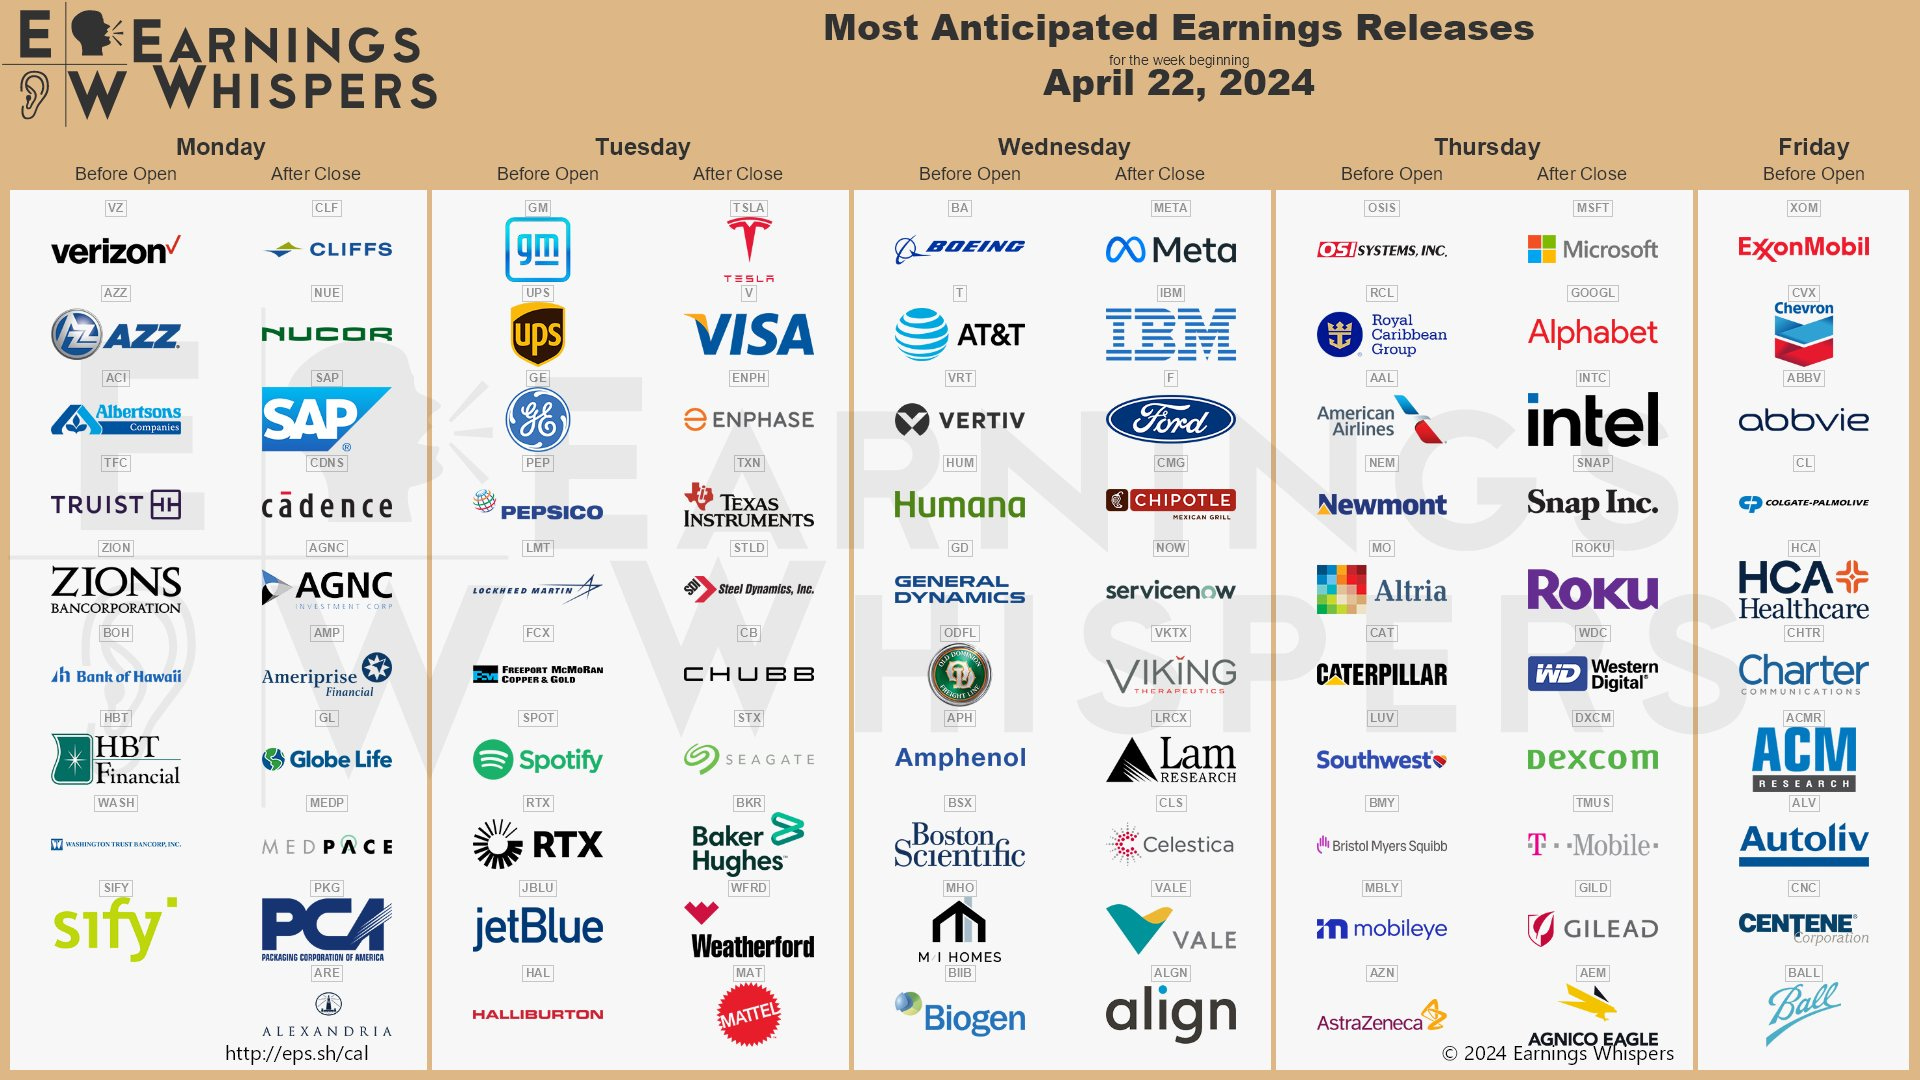
Microsoft for instance wiped out the last 12 weeks of gains in just 1 week. What will they say? How will they guide? I’m sure their earnings will be just fine. Google has easily been the strongest name in large caps, nobody seems willing to sell before earnings. Will they finally announce a dividend like META did last Q? Will we see advertising pick up meaningfully like META has guided to, the datapoints we’ve gotten so far show advertising accelerated in Q1 for all names. Aside from those we have some interesting consumer reads from names like UPS which had a disastrous Q4 and Tesla which is making new 52 week lows seemingly daily.
As I said last week, do not panic. Times like this investors often forget that assets can also go down at times. Nothing material changed at any of these businesses this past week, all that changed was value of the stock. If you liked NVDA at $950 a month ago then you should love it at $760. Equities got a little ahead of themselves as investors were front-running the rate cuts that don’t appear to be happening at all and now all the valuations are being adjusted to fit a world where rates remain over 5% for longer than planned. That is it. Again, you have to remember that when yields are 4.6% as they are right now and possibly going to 5% that tech stock of yours at 40x earnings only has an earnings yield of 2.5% which is attractive when we cut rates, but for the time being, it isn’t attractive if yields stay elevated longer than planned.
Bottom Line: The technical picture looks awful right now, we’ve done alot of damage, but it did in October 2023 as well and the megacaps saved the day. They’re basically all we have, short term, people are rotating to other sectors, but the market can never go up without big tech. Whatever happens, we are sure to get a better picture of what names are set to lead us for the quarter ahead very soon.
When Will We Know The Pain Is Over?
Just like the trend break last week was easy to see, on the flip side you’re going to see the 8 ema cross up through the 21 ema on the daily for a bullish crossover. This is the exact opposite of what we saw recently where the 8 ema crossed down through the 21 ema on the SPY for a bearish crossover. These things take time because you’re talking about the flattening out of a 21 day moving average, that alone takes a few weeks. You need short term strength to overcome that and that’s why when names dip, it takes some time for them to recover.
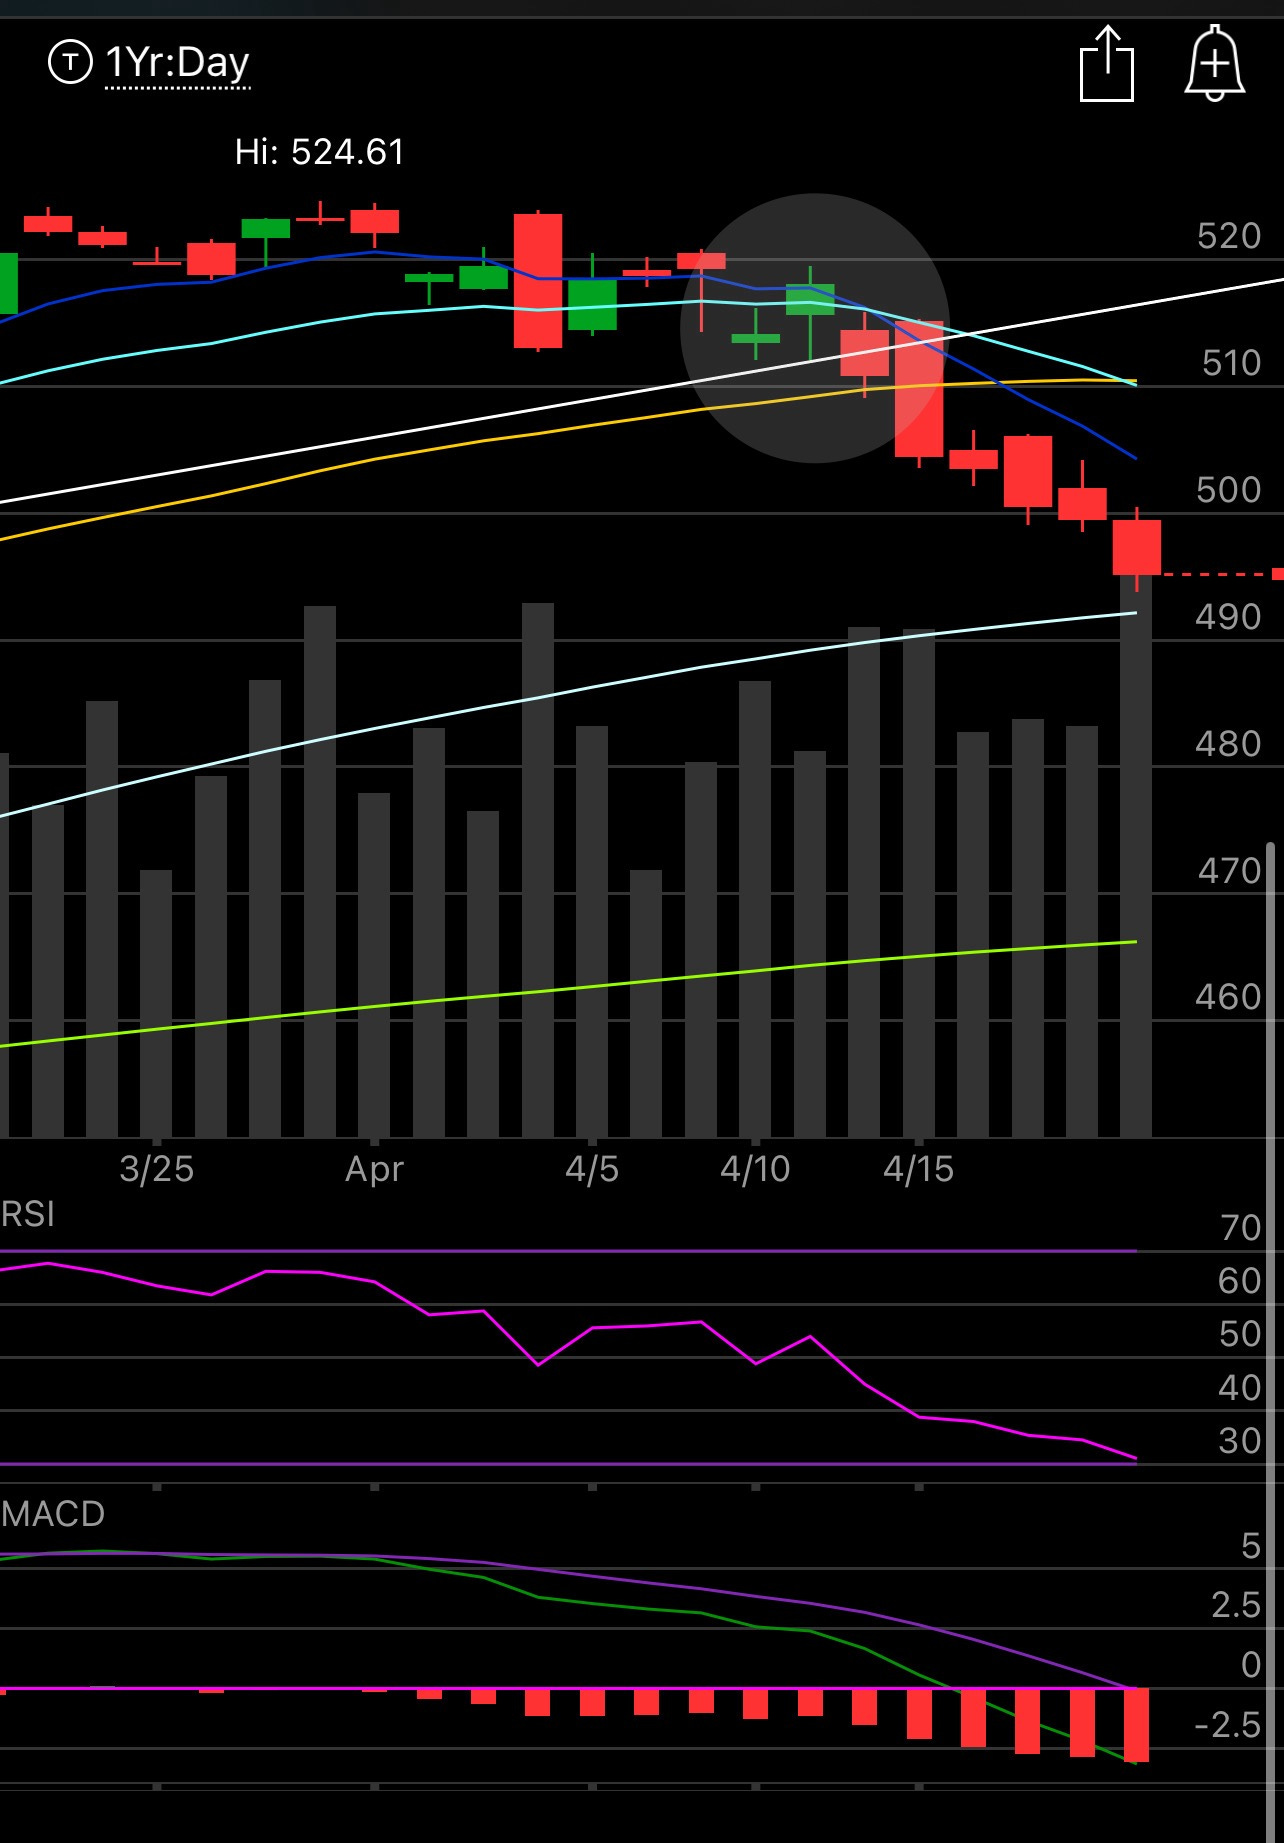
Take a look below
This first chart is the SPY and you can see 5 days after that bearish engulfing candle we had when I sent out that emergency afterhours post, we got an 8/21 bearish crossover. Look what happened in the next 6 sessions, it usually doesn’t go that smoothly, but this was a textbook selloff which is why you got my big warning last weekend.
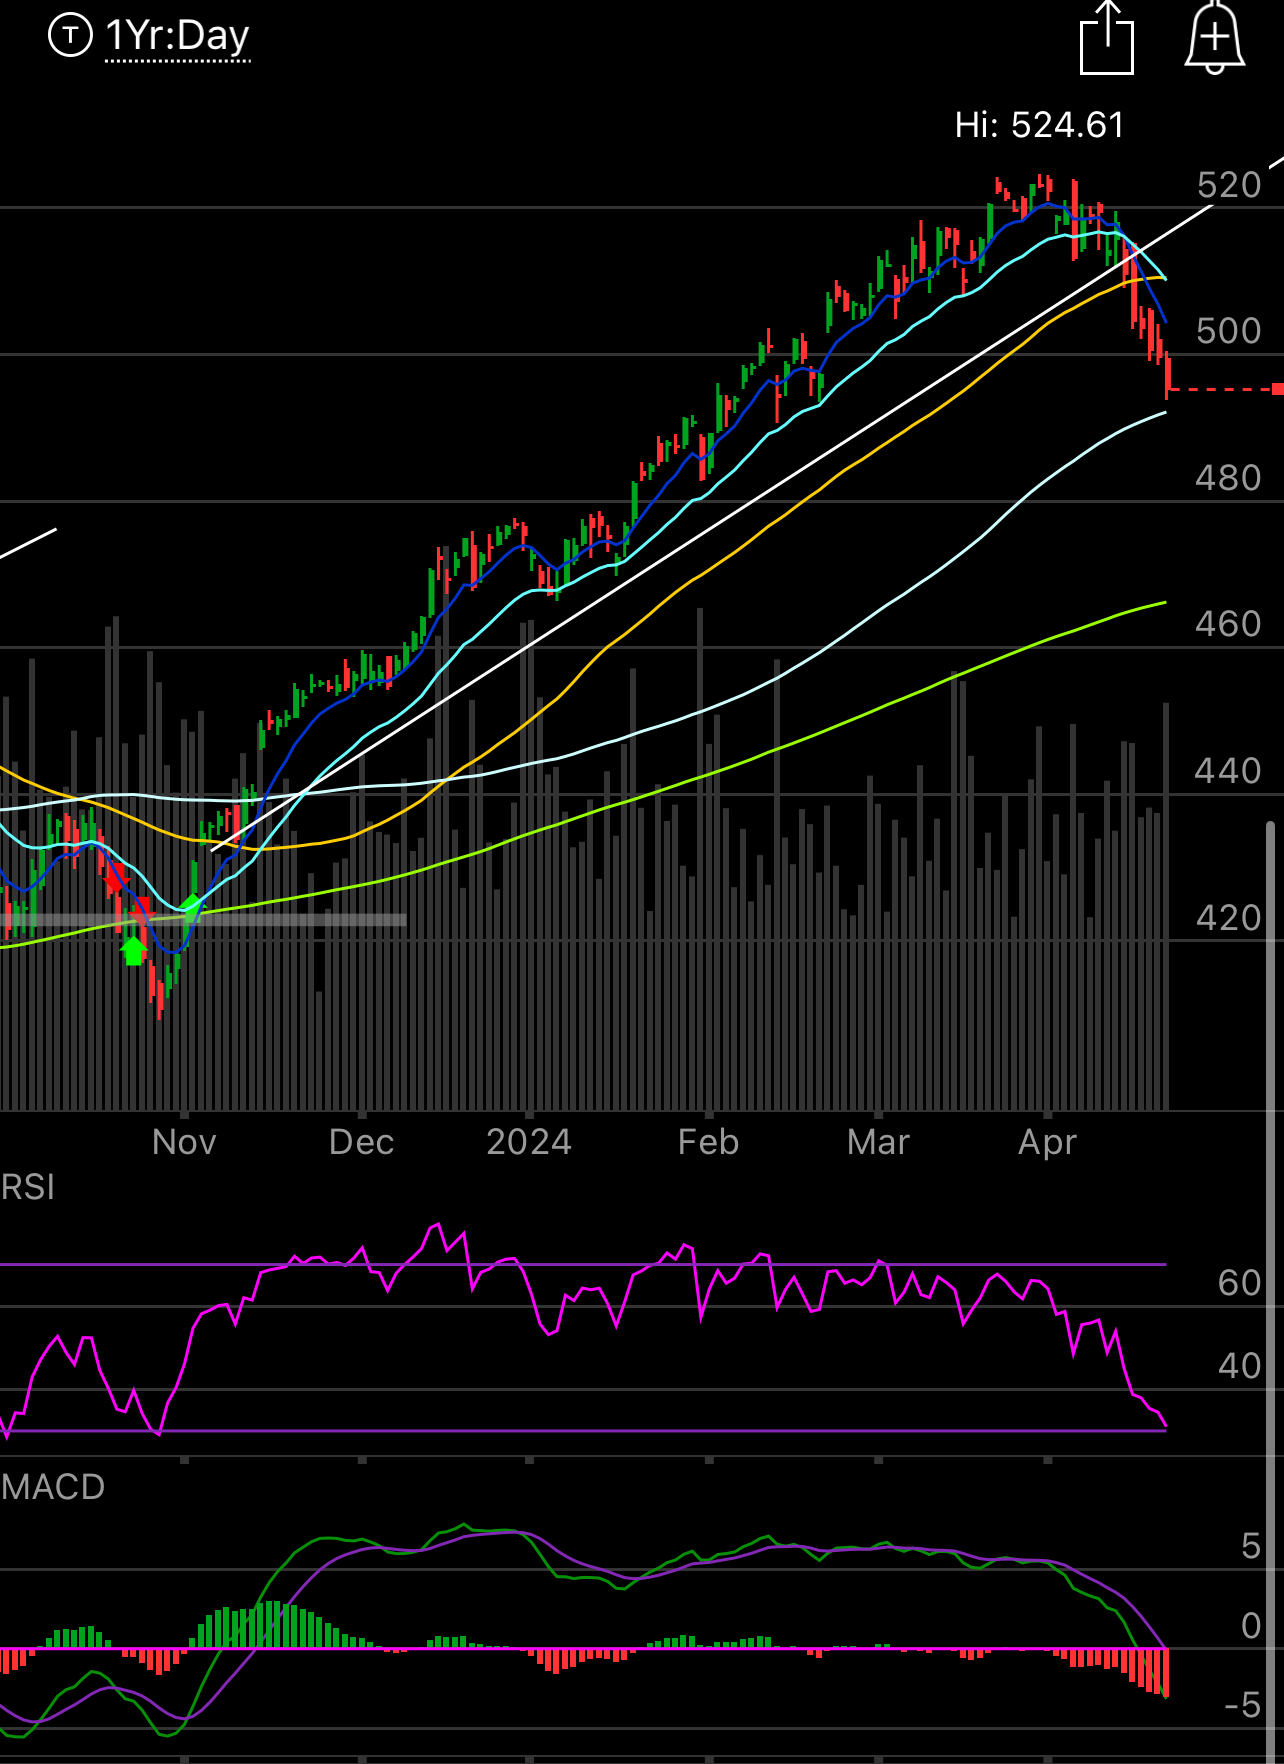
Now look at the whole uptrend we were just in, you see how never once in that entire 6 month run did the 8 ema cross below the 21 ema. That was a very strong uptrend. Those are rare, but they do happen. That is why you have to realize when you’re in an uptrend and press things hard, use leverage in those uptrends, but also understand that when the trend breaks, it is time to stop doing all that.
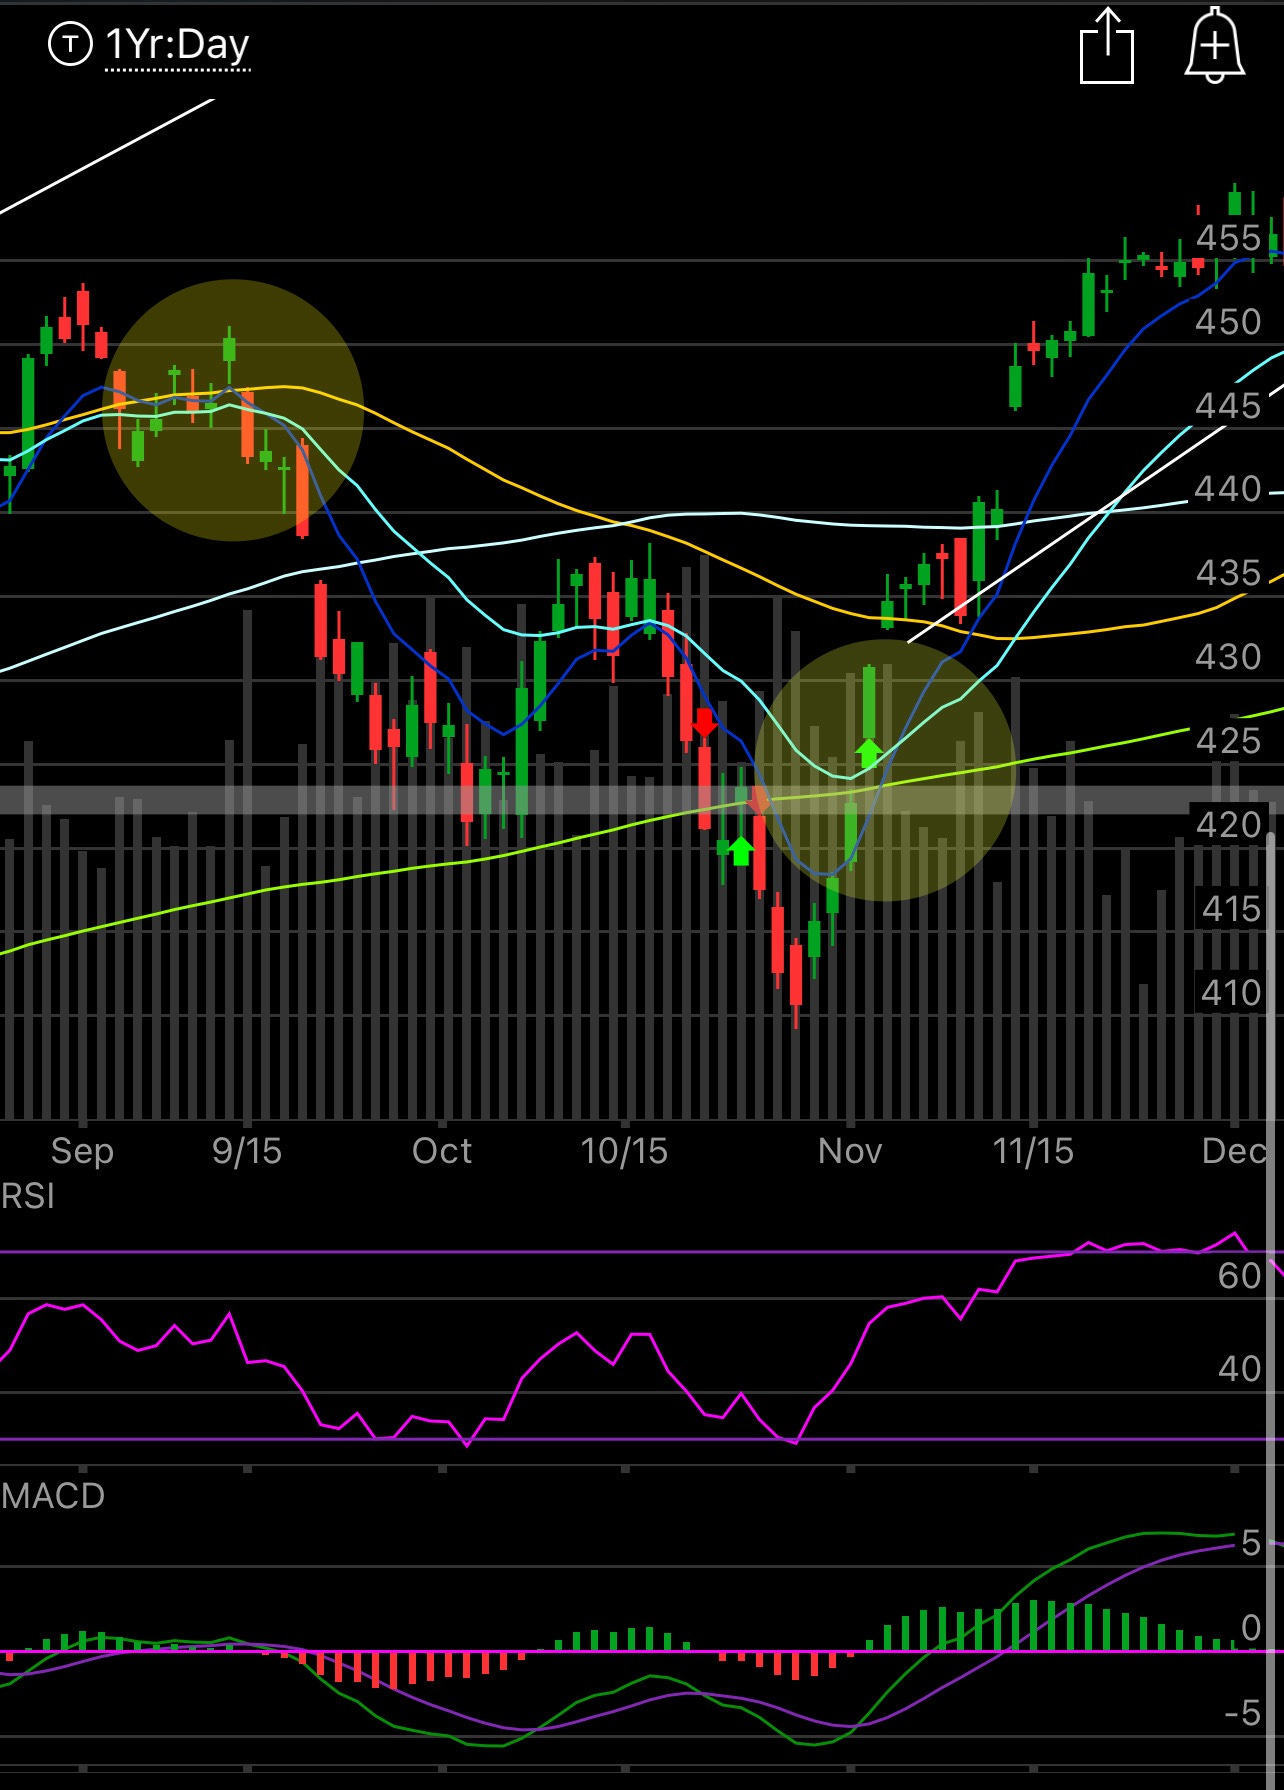
Lastly here is the chart of when the last uptrend ended and this whole uptrend began weeks later. What you will see is 2 circles I have drawn, the first in mid September when we got the last 8/21 bearish crossover we saw, you can see it was around 45 days of weakness until we got the 2nd circle, which is when the 8/21 bullish crossover occurred. That was the the start of the uptrend that just ended.
So you see, I’m not some savant, my timing on the big warning last weekend was just me telling you all the chart is sending out a big warning please be careful. If you just listen to what the charts say, your odds of success greatly improve. At the end of the day the computers that do all the trading, do so based off these same charts, you have to learn to think like them if you’re going to be active and succeed at this game. We are no longer in an uptrend, that is just reality, we will be in another one at some point in time, now you know how to spot it.
Have a great rest of your weekend and I will see you tomorrow.